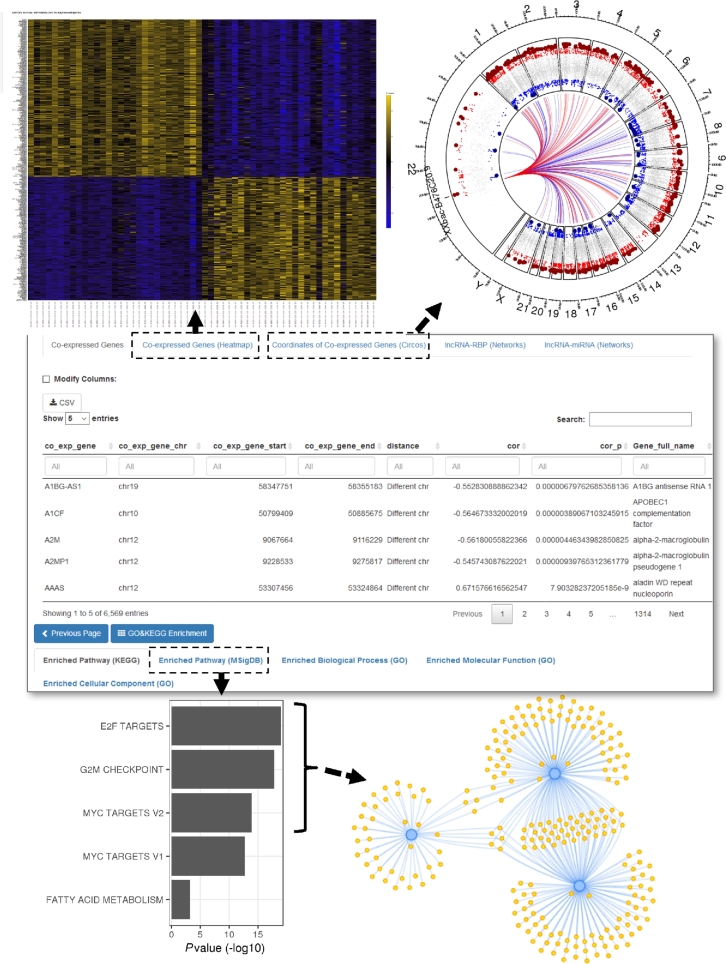
Figure 4:
Additional examples of circlncRNAnet output of lncRNA-based networks in colorectal cancer. In addition to the analyses shown in Fig. 3, more options for network interrogation of ncRNA-based regulation can be accessed on the webpage (middle). For instance, heatmap representation of the genes co-expressed with ELFN1-AS1 (Pearson's |r| > 0.5) can be outputted (upper left). Pathway analysis of the co-expressed genes on the basis of MSigdb Hallmark pathways (bottom left), and its network depiction of the top 3 enriched pathways and the corresponding co-expressed components (bottom right). Circos plot can also be used to illustrate the genome-wide distribution of the top 100 co-expressed genes relative to the location of XXbac-B476C20.9 (upper right).

