

Abstract
Slow maturation time of fluorescent proteins limits accurate measurement of rapid gene expression dynamics and effectively reduces fluorescence signal in growing cells. We used high-precision time-lapse microscopy to characterize, at two different temperatures in E. coli, the maturation kinetics of 50 FPs that span the visible spectrum. We identified fast-maturing FPs that yield the highest signal-to-noise ratio and temporal resolution in individual growing cells.
Fluorescent proteins (FPs) are commonly used to monitor dynamic cellular processes in a wide variety of biological systems. Nascent FPs, however, require a stochastic maturation step to become fluorescent. Consequently, the kinetics of this process directly affects the accuracy with which biological processes can be monitored. While many excellent studies have exhaustively compiled in vitro characteristics of FPs1–4, the maturation times of FPs in living cells remain sparsely characterized5,6. The lack of systematic maturation measurements might be due to the inherent complexity of the maturation process that involves, in addition to the folding of the β-barrel, torsional rearrangements, cyclisation, oxidation and dehydration of the chromophore7. However, even if the full details of these processes are not completely understood, a systematic empirical characterization of maturation time would be highly valuable as it would help researchers select the fastest maturing proteins or be aware of artifacts inherent to slow FPs.
To measure maturation kinetics with high precision, we used an agarose-based, single-cell chemostat that allowed us to image and track hundreds of bacterial colonies growing exponentially in a tightly regulated environment for more than thirty generations8 (Supplementary Fig. 1). In addition, with this setup we could precisely control the delivery of chloramphenicol, a translation inhibitor widely used to assess maturation times6,9, via microfluidic flow. When cells producing FPs are exposed to the drug, translation is arrested but FP maturation continues. As previously synthesized proteins mature and become visible, the fluorescence signal continues to increase despite the absence of newly synthesized FPs (Supplementary Figs. 2–4). From the fluorescence increase, we quantified the fraction of immature protein at the time of translation arrest and extracted the kinetics of maturation (Supplementary Fig. 5). We effectively eliminated photobleaching from our measurements by reducing exposure time to the lowest possible values (Supplementary Note).
FP maturation is often modeled as a first-order process with single exponential kinetics and a characteristic half-time (t50). Surprisingly, however, we observed highly diverse maturation kinetics (see Supplementary Note for all maturation curves) even for FPs within the same spectral class. Some variants such as mEGFP exhibited simple first-order kinetics: the fraction of immature protein as a function of time followed a single exponential (Fig. 1a). The maturation of other variants such as mGFPmut2, however, was better described by two exponentials indicating the existence of effectively two kinetic steps in the maturation process (Fig. 1b). In yet another contrast, the maturation rate of wild-type GFP was initially slow but progressively became faster (Fig. 1c). This “complex maturation” kinetics was not due to multimerization since introducing the monomeric substitution A206K to wtGFP resulted in the same maturation curve (Supplementary Fig. 6). Similar “complex maturation” has previously been observed in red FPs9–11; however, several FPs derived from Aequorea victoria (avFPs), e.g. moxGFP, SCFP1, mTurquoise2 and mClover3 also showed complex maturation kinetics indicating that it is not an exclusive property of red FPs. In view of this diversity of maturation kinetics, we chose to report two effective maturation times, t50 and t90, that correspond to the time it takes for 50% or 90% of fluorescent proteins to become mature, respectively in Table 1 (Supplementary Data 1). Although the precise mechanism behind different maturation kinetics is unclear, we speculate that amino acids flanking the chromophore forming residues may play a key role (Supplementary Fig. 7).
Figure 1. Maturation kinetics and its impact on fluorescence signal in growing cells.
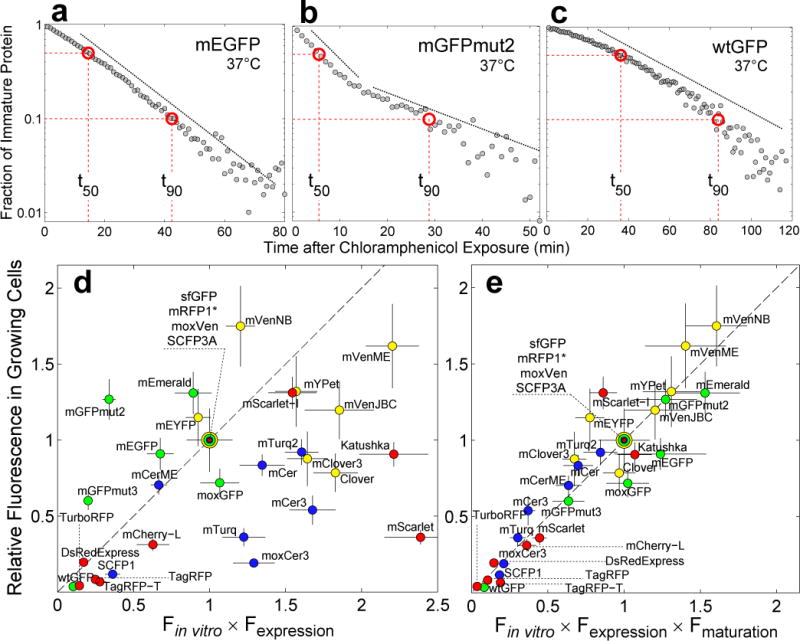
(a), (b) and (c). Fraction of immature protein as a function of time after translational arrest with chloramphenicol in single cells. (a) mEGFP maturation kinetics shows a single exponential decay (dashed line). (b) mGFPmut2 exhibits a more complex maturation process with two kinetic steps (dashed lines). (c) wtGFP matures with a slow non-exponential rate that increases with time. Dashed red lines indicate the time it takes for 50%, t50, and 90%, t90, of FP to mature, respectively. (d) Fluorescence signal in growing cells vs Fin vitro=QY·ε multiplied by Fexpression=amount of protein. Fluorescence signal is the mean fluorescence of single-cells (exponential growth in single-cell chemostat, M9 rich media, 37°C, mean from 70±20 cells, ±SEM). QY and ε are the values reported when the FPs were first published except for mVenusME and mCeruelanME; for these two FPs, we used our own in vitro data, see Online Methods. Fexpression was estimated using SDS-PAGE gel densitometry (±SD, see Online Methods). For green FPs, data normalized by sfGFP data; for yellow FPs, by moxVenus data; for blue FPs, by SCFP3A data; and for red FPs by mRFP1*. Dotted line is the identity. Dilution is given by the doubling time of E. coli, tgr=28.5±2min. (e) Fluorescence signal in growing cells vs Fin vitro × Fexpression multiplied by Fmat=1/(1 + t50/tgr)19. Fluorescence signal data is the same as in (d). QY and ε were quantified in our laboratory independently, except for in vitro data of red FPs, see Online Methods. We have assumed that the in vitro brightness of mRFP1* and mCherry-L is the same as the in vitro brightness of mRFP1 and mCherry, respectively, because amino acid differences are not part of the β-barrel. Error bars calculated by propagation of QY, ε and t50 errors.
Table 1. Maturation time of common fluorescent proteins.
(a) See Supplementary Note for a detailed description of the coding sequences. (b) Because the kinetics in many cases does not follow a single exponential, we report two maturation times, t50 and t90, ± confidence interval of 95%. Temperature has an error of ± 0.5°C. (c) Estimated value of the maturation time at 32°C was taken as 60% longer than the time measured at 37°C; see Online Methods. For mRuby3 Addgene the estimated time at 32°C is taken equal to that of mRuby3 at 32°C. (d) Even though mGFPmut3 is the fastest maturing FP in the green category, its low photostability makes it a poor choice for time-lapse microscopy. Supplementary Data 1 contains the mean fluorescence curves used to calculate maturation times.
| FPsa Order by year of appearance |
37°Cb | 32°Cb | ||
|---|---|---|---|---|
|
| ||||
| t50 (min) | t90 (min) | t50 (min) | t90 (min) | |
|
Cyan | ||||
| mCerulean | 6.6 ± 0.5 | 24.0 ± 2.9 | 11.3 ± 0.9 | 50.7 ± 13.1 |
| SCFP1 | 50.9 ± 2.8 | 118.5 ± 10.8 | 81c | 189c |
| SCFP3A | 6.4 ± 0.5 | 24.2 ± 2.7 | 10.6 ± 0.7 | 49.0 ± 15.3 |
| mCerluean ME | 7.4 ± 0.5 | 26.9 ± 2.2 | 12.1 ± 0.9 | 64.6 ± 13.7 |
| mTurquoise | 112.2 ± 7.1 | 319.9 ± 36.6 | 179c | 512c |
| mCerulean3 | 69.8 ± 3.9 | 177.8 ± 17.8 | 112c | 284c |
| mTurquoise2 | 33.5 ± 2.2 | 95.1 ± 9.3 | 58.7 ± 4.1 | 175.7 ± 21.7 |
| moxCerulean3 | 100.4 ± 5.2 | 236.9 ± 23.6 | 159c | 369c |
|
Green (UV-Excitable) | ||||
| Sapphire | 38.4 ± 2.4 | 103.4 ± 8.4 | 61c | 165c |
| T-Sapphire | 156.5 ± 11.2 | 478.2 ± 57.2 | 250c | 765c |
|
Green | ||||
| wtGFP | 36.1 ± 2.1 | 83.8 ± 4.9 | 58c | 134c |
| mEGFP | 14.5 ± 1.0 | 42.4 ± 4.4 | 22.3 ± 1.5 | 62.8 ± 6.6 |
| mGFPmut2 | 5.6 ± 0.4 | 28.8 ± 4.5 | 6.8 ± 0.5 | 20.0 ± 2.1 |
| mGFPmut3d | 4.1 ± 0.3 | 15.8 ± 3.1 | 4.5 ± 0.3 | 16.6 ± 2.9 |
| mEmerald | 11.2 ± 0.8 | 37.5 ± 12.1 | 17.7 ± 1.1 | 48.4 ± 4.0 |
| sfGFP | 13.6 ± 0.9 | 39.1 ± 4.7 | 19.4 ± 1.3 | 56.7 ± 6.0 |
| moxGFP | 17.1 ± 1.1 | 50.7 ± 4.3 | 35.7 ± 2.2 | 102.8 ± 17.4 |
|
Yellow-Green | ||||
| mEYFP | 9.0 ± 0.7 | 30.9 ± 4.2 | 10.6 ± 0.8 | 34.0 ± 4.3 |
| mVenus NB | 4.1 ± 0.3 | 18.4 ± 6.8 | 4.7 ± 0.4 | 18.0 ± 3.2 |
| mVenus JBC | 17.6 ± 1.3 | 59.1 ± 6.9 | 23.1 ± 1.7 | 87.1 ± 12.9 |
| mYPet | 9.7 ± 0.7 | 33.5 ± 5.4 | 11.9 ± 0.8 | 37.6 ± 4.3 |
| mVenus ME | 9.6 ± 0.7 | 30.9 ± 2.5 | 11.6 ± 0.8 | 37.9 ± 5.9 |
| Venus SX | 18.6 ± 1.3 | 57.7 ± 5.2 | 24.9 ± 1.8 | 74.4 ± 8.1 |
| Clover | 22.2 ± 1.4 | 61.6 ± 6.8 | 34.1 ± 2.2 | 108.3 ± 11.3 |
| mNeonGreen | 10.9 ± 0.8 | 36.8 ± 9.2 | 13.3 ± 0.9 | 37.7 ± 4.0 |
| moxVenus | 25.8 ± 1.8 | 77.8 ± 9.1 | 36.2 ± 2.7 | 119.0 ± 13.8 |
| mClover3 | 43.5 ± 2.9 | 112.4 ± 9.6 | 63.5 ± 3.6 | 176.5 ± 19.8 |
|
Orange-Red | ||||
| DsRed-Express | 26.1 ± 1.4 | 70.8 ± 7.4 | 31.2 ± 1.1 | 85.8 ± 29.7 |
| TurboRFP | 87.8 ± 5.3 | 276.9 ± 33.5 | 142c | 453c |
| TagRFP | 42.1 ± 2.6 | 102.8 ± 7.8 | 51.9 ± 3.6 | 105.0 ± 6.4 |
| TagRFP-T | 42.4 ± 2.1 | 103.2 ± 6.0 | 55.1 ± 3.0 | 113.6 ± 6.0 |
| DsRed-Expresss2 | 33.6 ± 1.8 | 78.5 ± 6.5 | 54c | 126c |
|
Red | ||||
| mRFP1 | 21.9 ± 1.1 | 51.4 ± 4.0 | 35c | 82c |
| mRFP1* | 23.8 ± 1.2 | 53.8 ± 4.7 | 32.5 ± 1.8 | 79.2 ± 9.1 |
| mCherry-L | 37.0 ± 1.8 | 81.4 ± 6.0 | 45.9 ± 3.4 | 105.7 ± 9.5 |
| mCherry2-L | 22.8 ± 1.2 | 51.3 ± 4.1 | 33.4 ± 2.1 | 83.1 ± 6.0 |
| mRuby3 | 130.8 ± 6.8 | 342.4 ± 37.8 | 243.7 ± 15 | 725.0 ± 85.9 |
| mRuby3 Addgene | 136.5 ± 6.9 | 354.4 ± 39.0 | 243.7c | 725.0c |
| mScarlet | 132.4 ± 7.5 | 376.2 ± 43.4 | 212c | 602c |
| mScarlet-I | 25.7 ± 1.5 | 66.3 ± 6.8 | 32.8 ± 1.8 | 83.2 ± 8.8 |
|
Far-Reds | ||||
| Katushka | 34.0 ± 2.3 | 92.8 ± 8.4 | 55.9 ± 4.0 | 154.2 ± 13.8 |
| mKate2 | 34.4 ± 1.8 | 79.4 ± 4.7 | 47.9 ± 2.8 | 113.8 ± 6.5 |
| E2Crimson | 23.4 ± 1.2 | 56.4 ± 4.9 | 30.8 ± 1.8 | 79.0 ± 9.5 |
| Katushka9-5 | 27.4 ± 1.7 | 76.4 ± 7.2 | 44.5 ± 2.7 | 114.3 ± 15.4 |
| mNeptune2 | 591.5 ± 44.8 | 1982 ± 243 | 946c | 3171c |
| mNeptune2.5 | 34.5 ± 1.8 | 87.4 ± 6.9 | 82.0 ± 5.4 | 233.1 ± 26.9 |
The coding sequence (CDS) of FPs is often optimized with synonymous codons to increase FP expression in different organisms. Another common modification to improve expression is the addition of valine at the second amino acid position. We found that maturation kinetics was not affected by either change (Supplementary Figs. 8 and 9). By contrast, we discovered during this work that many FPs reported in the literature under the same name had different non-synonymous CDS. The most surprising case was that of “Venus”, for which we found four slightly different non-synonymous CDSs that we named VenNB12, VenJBC13, VenME14, and VenSX15, each of which had different maturation times. In such cases, we classified each non-synonymous variant as a distinct FP.
There are several FPs that share the same β-barrel structure but have a different chromophore or different residues surrounding the chromophore. These FPs had different maturation times and often, also different kinetics: this pattern was observed for the green FPs mEGFP, mGFPmut2 and wtmGFP; the blue FPs SCFP1, SCFP3A and mTurquoise2; and the yellow FPs mVenNB, VenJBC and mVenElo. By contrast, we decided to study the effect of specific mutations that would not perturb the chromophore environment. We selected four amino acid substitutions classified as “spectroscopically silent” because they do not affect the spectroscopic properties of the chromophore: F99S16, K206A (the revertant of the monomeric substitution A206K)17, ΔC9 (truncation of the last 9 C-terminus amino acids)18, and ΔC9 combined with M153T16 in a mGFPmut2 background. In all cases, the spectroscopically silent mutants retained maturation kinetics similar to that of mGFPmut2 (Supplementary Fig. 10a–d). Moreover, t50, and t90 were practically identical (Supplementary Fig. 10e–f) and the substitutions did not change the original mGFPmut2 spectra (Supplementary Fig. 10g). These experiments suggest that spectroscopically silent mutations do not necessarily affect maturation kinetics. Moreover, since mutations F99S and M153T have been associated with improved folding16, these results suggest that chromophore maturation and folding are not intrinsically coupled processes.
Our experiments also revealed that the in vitro brightness of FPs ( = molar extinction (ε) × quantum yield (QY)) was, alone, a poor predictor of fluorescence signal in growing cells even when adjusted for differences in net expression levels (Fexpression), Fig. 1d and Supplementary Data 2 and 3. In turn, we hypothesized that by taking the maturation time into account as well, we could better predict fluorescence signal in growing cells. Indeed, we found that simply multiplying the term Fin vitro × Fexpression, with an additional factor that quantifies the interplay between maturation time ( ) and dilution of proteins due to cell growth ( ), 19, was sufficient to robustly predict fluorescence signal in growing cells (Fig. 1e). A similar agreement was found between fluorescence signal in batch cultures quantified by flow cytometry and the product Fin vitro × Fexpression × Fmat (Supplementary Fig. 11 and Supplementary Data 4). Note that in growing cell cultures, under steady-state FP expression, fluorescence signal from fast FPs can be greater than that of slower FPs with similar or even greater in vitro brightness. We also found that variations in quantitation of in vitro brightness did not play a role as important as maturation time for selecting FPs with the greatest fluorescence signal in fast growing cells (Supplementary Fig. 12).
We also investigated the effect of maturation time when FPs were used to report transcription in single cells. In these conditions, FP expression can be highly dynamic and may not reach a steady-state. For example, transcription from the lacZ promoter, PlacZ, under repressed conditions (lacI+, glucose+no inducer) occurs in bursts20. To examine how maturation time would affect the measurement of such processes, we monitored the activity of the repressed PlacZ driving the expression of either mGFPmut2 (fast) or mEGFP (slow). To ensure equal Fexpression, both FPs had identical nucleotide sequences except for 3 residues unique to each FP. We also confirmed equal Fexpression by quantifying protein expression by SDS-PAGE gel densitometry (Supplementary Fig. 13). While both proteins had approximately the same in vitro brightness (ε·QY=45.5 for mEGFP vs ε·QY=39.3 for mGFPmut2), we observed that signal from cells with mGFPmut2 was systematically stronger (Fig. 2a–b and Supplementary Fig. 14). Moreover, we observed richer promoter dynamics with the fast maturing FP (Fig. 2a). We reasoned that since fast FPs concentrate fluorescence signal within a shorter time window, they are better suited not only for temporal precision but also to detect small transient events (Fig 2c). In line with this hypothesis, transcriptional bursts reported with the fast FP were consistently greater in amplitude than those reported with the slow FP (Fig. 2d). Moreover, the slow FP smeared the promoter dynamics so much that it almost resembled that of a constitutive promoter, a result which was in stark contrast to the previously reported bursty activity of the repressed PlacZ20. Overall, the dynamic range of the promoter activity was 1.6 times greater when using the fast FP than with the slow FP (Supplementary Fig. 15). Also, the fast FP had the ability to monitor faster promoter dynamics (Fig. 2e). Based on the superior performance of the fast green FP, we predicted that the fastest cyan FP SCFP3A would be a better reporter than the brighter—but slower—mTurquoise2 (ε·QY=28.7 for mTurquoise2 vs ε·QY=17.1 for SCFP3A) to quantify the dynamics of the repressed PlacZ. Indeed the dimmer SCFP3A exhibited a 40% larger dynamic range and had three times better temporal resolution than the brighter mTurquoise2 (Supplementary Fig. 16) despite having similar expression levels (Supplementary Fig. 13).
Figure 2. Impact of maturation time on transcription dynamics.
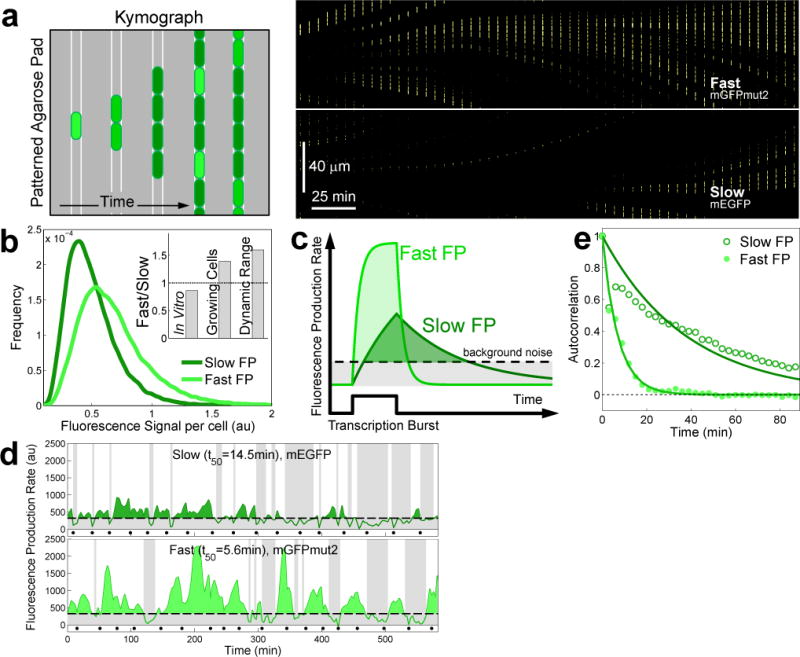
In growing cells, fluorescence signal associated with fast-maturing FPs can exhibit greater intensity and dynamic range than equally bright slow-maturing FPs. (a) Left: cartoon of a kymograph of a linear colony. Kymograph composed from the fluorescence channel of the time-lapse movie. Cells express stochastic bursts of an FP; intensity decreases because of dilution due to growth, thus creating the dark and bright bands in the kymograph. Right: kymograph made from the fluorescence channel showing that a fast FP reports brighter transcriptional events than a slower FP even when both fluorophores have the same in vitro brightness. Upper half, fast FP (mGFPmut2, ε·QY=39.3, t50=5.6min); lower half, slow FP (mEGFP, ε·QY=45.5, t50=14.5min); expression driven by the repressed PlacZ promoter. (b) Distribution of fluorescence signal per cell for the fast (light green, ncell=2489) and the slow FP (dark green, ncell= 2310). Signal from the fast FP is always higher than that from the slow FP (Supplementary Fig. 14). Inset. In vitro brightness, fluorescence signal in growing cells, and dynamic range of the fast relative to the slow FP (Supplementary Fig. 15). (c) Black solid line: transcriptional burst that yields the same amount of either fast- or slow-maturing FP. (d) Time traces of the fluorescence production rate of the repressed PlacZ using the fast or the slow FP. The detection limit (dashed line) is 3σ units above autofluorescence production rate; black dots indicate cell division, tdiv=33min at 37 °C. Shaded bands indicate periods of promoter activity below the detection limit. (e) Autocorrelation of fluorescence production rate for the slow and the fast FP variants (characteristic decay times tslowFP=24.5min and tfastFP=6.3min). Both FPs are driven by the same promoter thus using the fast FP increases temporal resolution.
Our work demonstrates that in growing cells, there exists a fraction of immature FPs, and that accounting for this fraction via the maturation time is crucial for explaining the relationship between in vitro brightness and fluorescence signal (Fig. 1e). We hypothesize that even in different environments fast FPs will remain faster than slow FPs and, thus, remain preferable. For example, at different temperatures (37°C and 32°C), the ranking of maturation times is preserved: fast maturing FPs still mature faster despite changes in the absolute maturation time. We note that independent of and , fluorescence in growing cells might also unexpectedly vary due to organism-specific effects on net protein expression (Fexpression) (extended discussion in Supplementary Note). However, as a general guide, we recommend the use of fast maturing FPs which will likely yield higher fluorescence signals—particularly in fast growing cells—and, independent of growth rate, increase the temporal resolution of any tracked cellular process.
Online Methods
Molecular Cloning
All experiments and cloning were performed with Escherichia coli MG1655 (The Coli Genetic Stock Center, Yale University; CGSC 6300). All avGFP derivatives were constructed from an initial mGFPmut2 template used to generate linear fragments of dsDNA with the appropriate point mutations at the 5′ and 3′ ends. Linear fragments (from 1 to 6 depending on the FP) and the backbone were assembled together in a single isothermal assembly reaction21. The backbone confers kanamycin resistance and harbors the low copy origin SC101. FP expression was controlled by a member of a set of constitutive promoters, proC22, the T7 RBS and the T1 terminator. The mNeonGreen gene was a gift from J. Paulsson. All red FP genes were ordered as gBlocks® from Integrated DNA Technologies (IDT) and cloned into a similar backbone as the one used for avGFPs. All FP coding sequences were confirmed by Sanger DNA sequencing from two clones. See Supplementary Note for the coding sequence definition of all FPs.
PlacZ reporters with FPs of interest were cloned into the chromosome using the λ-Red homologous recombination system23. FPs were controlled by an RBS designed by Ishida and Oshima24. The RBS is a strong RBS and leaves the lacI binding site O1 and its context intact (Supplementary Fig. 17). There is a kanamycin cassette as selection marker located downstream of the FP gene. The sequences used as homologies for the integration were 5′AATTGTGAGCGGATAACAATTTCACACAGGAAACAGCTATGACCA and 5′TTAAATAGTACATAATGGATTTCCTTACGCGAAATACGGGCAGACATGGC.
Estimation of FP expression using SDS-PAGE gel densitometry
Exponentially growing cells were harvested at OD600=0.6, concentrated 15X, aliquoted and immediately stored at −80°C for later processing. Later, 8ul of thawed cells were mixed with 7ul of 4X SDS-PAGE loading buffer and incubated at 98°C for 12min. Samples were loaded into a 4–20% SDS-PAGE gel. The gel was run at 200V for 65min. After electrophoresis, gel was stained with Brilliant Blue and de-stained until gel was transparent. Gel was imaged taking special care not to overexpose the image. Densitometry analysis was performed with the software GelAnalyzer 2010a. Total protein density profile was background corrected using the rolling ball method. Using the protein profile from background strain MG1655, density contribution from endogenous proteins at ~27kDa was estimated and subtracted from the raw FP value. FP densities were normalized using two sets of total protein stereotypical bands around 40kDa and 100kDa. We ran two technical replicates with two different loading patterns to compensate for systematic gel distortions (Supplementary Fig. 18).
Protein extraction and purification
The Three Phase Partitioning (TPP) procedure25,26 was used to extract and purify avFPs. Cultures were grown from single colonies in 50 ml of LB Lennox with shaking at 30°C for two days. Cells were pelleted down at 10,000×g for 1 min, and resuspended in 25 ml of 1.6 M ammonium sulfate in Tris-HCl buffer (50mM Tris, pH 8.0). The resuspension was shaken for 30 min, and cells were again pelleted at 10,000×g for 10 min and resuspended in 7.5 ml of 1.6 M ammonium sulfate. 1st stage of TPP. A 2.4 ml aliquot from the resuspension was transferred to a 5ml Eppendorf tube and mixed vigorously for 10 min at 37°C in a vortex mixer with a special adaptor to fit 5ml tubes. Subsequently, 2.6 ml of t-Butanol was added and the mixture was again shaken vigorously for 10 min at 37°C. The 5 ml tube was centrifuged at 21,000×g for 5 min to separate the mixture into three phases. The bottom phase (~2ml) was transferred into a fresh 5ml Eppendorf tube by piercing through the upper two layers and aspirating. 2nd stage of TPP. To the recovered phase, 3ml of t-Butanol were added, and the mixture was shaken vigorously for 5min at 37°C, and centrifuged at 21,000×g for 10 min to separate the mixture into three phases, the second phase being an extremely thin disc with all the FP. The thin disc was separated by slowly decanting the bottom and upper phases: the thin FP disc remained stuck to the wall of the tube. The tube was left standing for 1 min, and the residual t-Butanol/ammonium sulfate at the bottom was aspirated. The FP disc was redissolved in 150–250ul of 1.6 M ammonium sulfate. 3rd stage of TPP. The 5ml tube with the redissolved FP was centrifuged at 21,000×g for 20 mins. The crystal-clear aqueous phase was transferred with a pipettor to a sterile 1.5 ml Eppendorf tube. Care was taken to avoid pelleted debris and also to avoid aspirating possible residual t-Butanol (a thin upper layer). Purified protein was stored at 4°C.
Spectroscopy
Fluorescence spectra were acquired in a Horiba/Yvon FluoroMax-4 Spectrofluorometer. The instrument corrects for excitation lamp fluctuations and compensates for the spectral dependence of detector efficiency. Spectra were acquired with a 1nm resolution, and the mean spectrum was derived from four readings using the following parameters: YFP Ex 482 and Em 497–685, GFP Ex 455 Em 470–675 and Cyan Ex 425 Em 445–750. The integration range for CFPs was broad enough to capture the complete tail of the coumarin reference dye. Samples were at least a 20X dilution (in Tris-HCl buffer, pH 8) of the purified protein recovered at the end of the 3rd stage of the TPP. Thus, final ammonium sulfate concentration was at most 70 mM.
Absorbance spectra were acquired using a Shimadzu SolidSpec-3700/3700DUV. To avoid reabsorption effects, samples and standard dyes were diluted until the absorption maximum did not exceed a reading of 0.1 units. Three spectrum readings were taken and averaged. We used polymethyl methacrylate (PMMA) cuvettes, BrandTech Scientific 759125. Cuvettes were taken from the same box (i.e. same mold cavity for all cuvettes, manufacturer description) to ensure lowest variation in extinction coefficient. The variation found was minimal in comparison to the absorption maxima of the FPs (less than 0.5%). Thus, all the FPs spectra were corrected with the same average background absorption for a given box of cuvettes (Supplementary Fig. 19).
Quantum yield (QY) and molar extinction coefficient estimation
SDS-PAGE densitometry was used to estimate the amount of purified FP at the end of the 3rd step of TPP. Briefly, 3.25ul of purified protein in 1.6 M ammonium sulfate was mixed with 5.75ul of 4× SDS-PAGE sample loading buffer in PCR tubes. FP samples were denatured by heating at 98°C for 12 min. In parallel, a dilution series of purified BSA (concentrations: 1.000, 0.666, 0.500, 0.333, 0.250, 0.167, 0.125, 0.083, 0.062, 0.041, 0.031ug/ul) was prepared. FP samples were spiked with 8ul of BSA standard such that every sample would have a different known BSA concentration. Volume was adjusted to 20ul. Samples were loaded into a 4–20% SDS-PAGE gel. After electrophoresis, the gel was stained with Brilliant Blue and de-stained until gel was transparent. Gel was imaged taking special care not to overexpose the image. Image was analyzed with the Gel Analysis plug-in from ImageJ27. A standard curve using the known concentrations and corresponding band densities obtained from the Gel Analysis plug-in was created in Matlab R2013a (Supplementary Fig. 20). The standard curve was used to estimate the total FP loaded in every well. The molar concentration of the sample was obtained assuming the weight of the FP as 26.89 kD. The molar extinction was determined using Beer’s law.
We performed a relative determination of fluorescence QYs28,
where F is the integral photon flux, f the absorption factor at the excitation wavelength ( ) and n the refractive index. st denotes the dye reference and x the FP sample. In the QY determination, the refractive indexes of three solvents were relevant: ethanol 200 proof, 0.1 M NaOH and 50mM Tris-HCl pH 8.0. Ethanol was the solvent for coumarin. For ethanol, the refractive index used was 1.364 (using the exact refractive index at the coumarin average emission gives negligible differences, http://refractiveindex.info). For 50mM Tris-HCl pH 8, its refractive index was measured with a Milton Roy Abbe 3L refractometer with different amounts of dissolved ammonium sulfate. Results showed that the refractive index of Tris-HCl at relevant ammonium sulfate concentrations (<70mM, after doing at least a 20X dilution from our stock of purified FP in ammonium sulfate 1.6 M) was equal to that of water at 25°C, n=1.335 at 500nm, http://refractiveindex.info. The refractive index of 0.1M sodium hydroxide, the fluorescein solvent, was also found to be equal to that of water. Note that, because the refractive index of water and ethanol are different, the refractive index ratio, , reduces the relative QY of blue FPs by about 4%. The reference dyes were fluorescein “reference standard” (Molecular Probes F-1300, Lot# 1691-3) and coumarin 153 (99% purity, Sigma-Aldrich 546186-100MG, Lot# MKBV7586V). The QYs used were 0.89 and 0.53 respectively28. For every FP, the protein was extracted/purified, the molar concentration determined and the absorbance/emission spectrum acquired from three independent cultures. QY and molar extinctions were determined from those three independent extractions for all FPs except for moxCerulean, mEmerald, moxGFP, moxVenus. For these FPs only 2 independent extractions were performed. Reported errors are standard deviations.
Maturation time estimation by translational arrest with chloramphenicol
Single-cell chemostat assembly8
Briefly, polydimethylsiloxane (PDMS) chambers were casted using home-made metal molds. Then, chambers and glass cover slips were treated with O2 plasma (Harrick Plasma; 18W, 25s, 1000mTor atmosphere) and put into contact to induce covalent bonding between the two surfaces. Subsequently, the chamber was pierced at its ends to create an inlet and an outlet with 30G needles. To avoid leakages, needles were sealed to PDMS chambers with a drop of freshly prepared PDMS and left to cure for 2hrs at 55°C. Meanwhile, a patterned agarose slab was prepared by pouring dissolved low-melt agarose (BP165, Fisher Scientific) on top of a PDMS intermediate that had on its surface the negative pattern to be printed on the agarose. Then, the PDMS chamber and a second square coverslip were plasma treated (as above). Immediately after, 2ul of saturated cell culture (OD600~ 1) was dispensed at the center of the PDMS chamber, the patterned agarose slab pressed into place and the chamber sealed with the square coverslip. The assembled single-cell chemostat was allowed to set for 15–30min before intubating to introduce growth media.
Growth media composition
M9 rich media: M9 salts 1×, casamino acids 0.1%, glucose 0.5%, thiamine 1ug/ml, MgSO4 2mM, CaCl2 0.1 mM. The day before the experiment, growth media was prepared, its pH was checked (7.1 +/− 0.2) and liquid cultures of individual colonies were set for overnight growth. Next morning cells were diluted 200X in fresh media and incubated for 3–4 hrs before loading them into the single-cell chemostat. For the PlacZ experiment, same M9 rich media was used except that casamino acids were reduced by 200X to decrease background fluorescence. The decrease in nutrients increased division time by ~5min.
Temperature calibration
Single-cell chemostat temperature at the objective was carefully characterized for different buffer flow rates (Supplementary Note). Four hours before starting a maturation experiment, the microscopy setup was left to equilibrate to the desired temperature.
Buffer exchange
The outputs of two 30ml syringes (one with growth media, the other one with growth media plus chloramphenicol 100ug/ml) were connected together to a two input valve with stopcock (Value Plastics). The valve output was connected to the single-cell chemostat. To ensure exponential growth rate prior to data acquisition, cells were grown inside the chemostat for 4hr at 37°C with growth media flowing at a rate of 50ul/min via a peristaltic pump (KDS-210, KD Scientific). Then, data was acquired for one hour at a rate of one frame per minute. After the first hour, the first pump was stopped and the second pump, with growth media and chloramphenicol, was activated at a rate of 70ul/min. At this rate, growth media in the single-cell chemostat was exchanged in <20secs with media with chloramphenicol. After buffer exchange and without interruption, data was acquired for three to four more hours. Due to cell wall damage induced by chloramphenicol treatment, there is an artefactual dependence of photobleaching on chloramphenicol concentration. Nonetheless, there is a chloramphenicol concentration range (40ug/ml to 200ug/ml) where photobleaching rate is constant (Supplementary Note and Supplementary Fig. 21).
Microscopy
Time-lapses were taken with a Zeiss Axiovert 200M and a Plan-Apochromat 40×/1.3 Oil Ph3. Focal plane drift was eliminated by using software-based autofocus following the method described in29. Shortly, we characterize the frequency response of our optical system (camera/objective) to filter out low and mid-range frequencies from Z-stacks. Those frequencies are responsible for unwanted contrast reversals usually found in regular software-based autofocuses. A solid-state white illumination SOLA SE II was used for fluorescence excitation. The filter set for the green channel was Ex. 482/18, Di. 495, Em. 520/35; for the yellow channel was Ex. 500/24, Di. 520, Em. 542/27; for the blue channel was Ex. 438/24, Di. 458, Em. 483/32; and for the red channel Ex. 586/20, Di. 605, Em. 647/57; all filters from Semrock. Images were acquired with a CCD camera (Hamamatsu C4742-98-24ERG). Variation in fluorescence intensity illumination across the field-of-view was less than 10% in all channels. Under our experimental conditions, most maturation curves do not exhibit measurable photobleaching, see Supplementary Note and Supplementary Fig. 22 and 23. The microscope setup was controlled with home-made software using Micro-Manager 1.430 and Matlab R2013a.
Calculation of the immature fluorescent protein fraction from single cell data
(i) Selection of single-cells. Kymographs of individual linear colonies were constructed from time-lapse movies that contained a phase contrast and a fluorescence channel. Using the phase contrast kymographs, we backtracked—starting from the last frame—only cells that remained in the tracks of the agar pad and that did not lyse. (ii) Single-cell fluorescence quantification. For every single-cell, using the fluorescence channel kymograph, raw fluorescence was quantified at frame t by adding signal from all pixels within a rectangular window that was twice the width of the cell in order to capture all out-of-focus light (Supplementary Fig. 24). To measure the background fluorescence as a function of time, a kymograph of an agar pad strip without cells was constructed. To obtain a background-corrected fluorescence value at frame t, the background quantified from the empty agar pad strip at frame t was subtracted from the raw fluorescence value at frame t. (iii) Averaging of data. Independently of colony membership, to obtain a mean fluorescence curve, fluorescence data from all cells was added and divided by the number of cells. Similarly, but with single-cell length data, a mean length curve was obtained. The mean length curve was used to determine the precise moment at which chloramphenicol arrived. (iv) Fraction of immature FP. To obtain the fraction of immature protein, the mean fluorescence was subtracted from the maximum fluorescence value and divided by the fluorescence increase after drug treatment; see Supplementary Fig. 5 for a step-by-step diagram. All analysis was done using Matlab R2013a.
Fluorescence signal estimation by flow cytometry
Three replicate cultures for every avFP were grown overnight in M9 rich media at 37°C. Next day, a first set of replicates was diluted 1000X in fresh M9 rich media and incubated at 37°C. After 20 min, the same procedure was followed for the second set of replicates and, finally, after an additional 20 more minutes the third set was also diluted and incubated. The delay between replicates was set to minimize maturation time artifacts in the in vivo brightness determination using flow cytometry. Typically, a single set of replicates would take ~6min to be quantified. After 2hrs 40min from the first dilution, a second 500× dilution was performed for every set of replicates following the same time delay. After 2hrs, the replicates were growing exponentially (OD600 = 0.05–0.1). An aliquot of the first set was transferred to a 96-well plate pre warmed to 37°C and stored in a styrofoam box. Immediately, samples were measured in a BD LSR Fortessa. The same was done for the second and the third bio-replicate sets. The excitation/emission configuration was CFP Ex 440 (laser), Em 470/20; GFP Ex 488 (laser), Em 520/35; and YFP Ex 488 (laser), Em 542/27.
Statistical methods
Immature FP fraction curves were initially obtained for several FPs (mEGFP, mGFPmut2, mGFPmut3, sfGFP, SCFP3A, mVenME, mCherry) with at least 3 independent replicates. Once the results from these initial FPs were reproducible, new FPs were measured together with a previously characterized FP as a control. If the control displayed an anomalous maturation curve, the experiment was not further analyzed. In a successful experiment, after ~2hrs of chloramphenicol treatment, a small fraction of cells would lose their fluorescence, presumably due to cell wall damage (Supplementary Note). We eliminated manually these cells from the analysis. Mean single cell fluorescence curves were derived from the mean of 70±20 cells. We obtained the t50 and t90 values by smoothing the log transformed immature FP fraction curves using the function csaps in MATLAB R2013a, smoothing parameter equal to 0.01. Maturation time errors were estimated assuming errors in the average fluorescence of ±3%. The typical error in our average fluorescence curves is below 1% at fluorescence saturation. Thus, the assumed ±3% error in average fluorescence gives at least a confidence interval of 66% (one standard deviation), and typically a confidence interval of 95% (2 standard deviations). For specific FPs, the maturation time at 32°C was estimated using the maturation time measured at 37°C (Supplementary Fig. 25). QY and ε average and SD were derived from three independent protein extractions except for moxCerulean, mEmerald, moxGFP, moxVenus. For these FPs only 2 independent extractions were performed. QY and ε values used for the x-axis of Fig. 1d are the values reported when the FPs were first published except for mVenusME and mCeruleanME; for these two FPs, we used our own in vitro data (Supplementary Table 1 and 2). In the x-axis of Fig. 1e, the red FP in vitro data were taken from different laboratories (Supplementary Table 2 and Supplementary Fig. 26). For all other FPs, QY and ε were quantified in our laboratory (Supplementary Table 1). We estimated FP expression by SDS densitometry. Fexpression is the median ±SD of four measurements from two SDS gels (Supplementary Fig. 13 and 18 and Supplementary Data 2). The two gels were technical replicates. Errors of derived experimental quantities (e.g. Fin vitro error) were obtained by propagation of errors from values experimentally determined (e.g. quantum yields and extinction coefficients). In time traces, single-cell fluorescence production rate was approximated by finite differences and the result smoothed with the function filtfilt using a filter order equal to 3 and a cut-off frequency equal to 0.55 (Matlab R2013a). Autocorrelation of fluorescence production rate was calculated along cell lineages eliminating sampling bias by avoiding counting branches more than once31. The estimated autocorrelation decay constants were obtained by fitting the theoretical autocorrelation function given in20. We repeated a single experiment with FPs of different colors: two greens (mGFPmut2 & mEGFP) and two blues (SCFP3A & mTurquoise2) to support the robustness of the observed effect in Fig. 2.
Code availability
Code to generate Fig. 2 and Supplementary Fig. 16 can be found in Dataverse: doi:10.7910/DVN/THTGHS. Code to analyze single-cell data from the single-cell chemostat experiments is available from the corresponding author upon request.
Data availability statement
Fluorescence maturation curves, SDS-PAGE gel densitometry calculations, a worksheet to obtain Fig.1 and Fig.2 and SDS-PAGE images of FP-expressing E. coli total lysate are available with the paper online. Data to obtain Fig. 2 and Supplementary Fig. 16 can be found in Dataverse: doi:10.7910/DVN/YH7LHM and doi:10.7910/DVN/OVZMXF. Flow cytometry source data of Supplementary Fig. 11 can be found in Dataverse: doi:10.7910/DVN/T4VSGH. Maturation time experiments from which Table 1 and Fig. 1 were derived can be found in Dataverse: doi:10.7910/DVN/KBNK6R. FPs listed in Table 1, codon optimized FPs and 2nd valine FPs are available at Addgene, IDs from 103968 to 104034.
Supplementary Material
Acknowledgments
Thanks to A. Mendoza-García for help with spectroscopy, to V. Pham for help with SDS-PAGE, to P. J. Choi for the tsr-venus sequence, and to J. Paulsson for useful comments. This work was partially supported by a fellowship from CONACYT-México and from the PEW Latin American Fellows Program to E.B.; a NSF GRFP fellowship and Harvard University Ashford Fellowship to J.M.K.; and grants NSF 132624-0001, 132662-0001, DARPA 152236-0003, and NIH 1R21AI094363-01A1.
Footnotes
Author contributions
E.B. and P.C conceived the project and analyzed the data. E.B. performed cloning, biochemistry, single-cell experiments and designed software for single-cell analysis. J.M.K. assisted with cloning and single-cell experiments. E.B and J.M.K. designed software for time-lapse microscopy. E.B. and P.C. wrote the manuscript with critical revisions by J.M.K. P.C. supervised the project.
Competing financial interests
The authors declare no competing financial interests.
References
- 1.Tsien RY. The green fluorescent protein. Annu Rev Biochem. 1998;67:509–544. doi: 10.1146/annurev.biochem.67.1.509. [DOI] [PubMed] [Google Scholar]
- 2.Shaner NC, Steinbach PA, Tsien RY. A guide to choosing fluorescent proteins. Nat Methods. 2005;2:905–909. doi: 10.1038/Nmeth819. [DOI] [PubMed] [Google Scholar]
- 3.Shaner NC, Patterson GH, Davidson MW. Advances in fluorescent protein technology. J Cell Sci. 2007;120:4247–4260. doi: 10.1242/jcs.005801. [DOI] [PubMed] [Google Scholar]
- 4.Day RN, Davidson MW. The fluorescent protein palette: tools for cellular imaging. Chem Soc Rev. 2009;38:2887–2921. doi: 10.1039/b901966a. [DOI] [PMC free article] [PubMed] [Google Scholar]
- 5.Hebisch E, Knebel J, Landsberg J, Frey E, Leisner M. High variation of fluorescence protein maturation times in closely related Escherichia coli strains. PLoS One. 2013;8:e75991. doi: 10.1371/journal.pone.0075991. [DOI] [PMC free article] [PubMed] [Google Scholar]
- 6.Megerle JA, Fritz G, Gerland U, Jung K, Radler JO. Timing and dynamics of single cell gene expression in the arabinose utilization system. Biophysical Journal. 2008;95:2103–2115. doi: 10.1529/biophysj.107.127191. [DOI] [PMC free article] [PubMed] [Google Scholar]
- 7.Craggs TD. Green fluorescent protein: structure, folding and chromophore maturation. Chemical Society Reviews. 2009;38:2865–2875. doi: 10.1039/b903641p. [DOI] [PubMed] [Google Scholar]
- 8.Moffitt JR, Lee JB, Cluzel P. The single-cell chemostat: an agarose-based, microfluidic device for high-throughput, single-cell studies of bacteria and bacterial communities. Lab Chip. 2012;12:1487–1494. doi: 10.1039/c2lc00009a. [DOI] [PMC free article] [PubMed] [Google Scholar]
- 9.Bevis BJ, Glick BS. Rapidly maturing variants of the Discosoma red fluorescent protein (DsRed) Nat Biotechnol. 2002;20:83–87. doi: 10.1038/nbt0102-83. [DOI] [PubMed] [Google Scholar]
- 10.Verkhusha VV, et al. An enhanced mutant of red fluorescent protein DsRed for double labeling and developmental timer of neural fiber bundle formation. J Biol Chem. 2001;276:29621–29624. doi: 10.1074/jbc.C100200200. [DOI] [PubMed] [Google Scholar]
- 11.Gross LA, Baird GS, Hoffman RC, Baldridge KK, Tsien RY. The structure of the chromophore within DsRed, a red fluorescent protein from coral. Proc Natl Acad Sci U S A. 2000;97:11990–11995. doi: 10.1073/pnas.97.22.11990. [DOI] [PMC free article] [PubMed] [Google Scholar]
- 12.Nagai T, et al. A variant of yellow fluorescent protein with fast and efficient maturation for cell-biological applications. Nat Biotechnol. 2002;20:87–90. doi: 10.1038/nbt0102-87. [DOI] [PubMed] [Google Scholar]
- 13.Rekas A, Alattia JR, Nagai T, Miyawaki A, Ikura M. Crystal structure of venus, a yellow fluorescent protein with improved maturation and reduced environmental sensitivity. J Biol Chem. 2002;277:50573–50578. doi: 10.1074/jbc.M209524200. [DOI] [PubMed] [Google Scholar]
- 14.Cox RS, 3rd, Dunlop MJ, Elowitz MB. A synthetic three-color scaffold for monitoring genetic regulation and noise. J Biol Eng. 2010;4:10. doi: 10.1186/1754-1611-4-10. [DOI] [PMC free article] [PubMed] [Google Scholar]
- 15.Choi PJ, Cai L, Frieda K, Xie S. A stochastic single-molecule event triggers phenotype switching of a bacterial cell. Science. 2008;322:442–446. doi: 10.1126/science.1161427. [DOI] [PMC free article] [PubMed] [Google Scholar]
- 16.Crameri A, Whitehorn EA, Tate E, Stemmer WP. Improved green fluorescent protein by molecular evolution using DNA shuffling. Nat Biotechnol. 1996;14:315–319. doi: 10.1038/nbt0396-315. [DOI] [PubMed] [Google Scholar]
- 17.Zacharias DA, Violin JD, Newton AC, Tsien RY. Partitioning of lipid-modified monomeric GFPs into membrane microdomains of live cells. Science. 2002;296:913–916. doi: 10.1126/science.1068539. [DOI] [PubMed] [Google Scholar]
- 18.Kim HK, Kaang BK. Truncated green fluorescent protein mutants and their expression in Aplysia neurons. Brain Res Bull. 1998;47:35–41. doi: 10.1016/s0361-9230(98)00020-3. [DOI] [PubMed] [Google Scholar]
- 19.Wang S, Moffitt JR, Dempsey GT, Xie XS, Zhuang X. Characterization and development of photoactivatable fluorescent proteins for single-molecule-based superresolution imaging. Proc Natl Acad Sci U S A. 2014;111:8452–8457. doi: 10.1073/pnas.1406593111. [DOI] [PMC free article] [PubMed] [Google Scholar]
- 20.Yu J, Xiao J, Ren X, Lao K, Xie XS. Probing gene expression in live cells, one protein molecule at a time. Science. 2006;311:1600–1603. doi: 10.1126/science.1119623. [DOI] [PubMed] [Google Scholar]
- 21.Gibson DG, et al. Enzymatic assembly of DNA molecules up to several hundred kilobases. Nat Methods. 2009;6:343–U341. doi: 10.1038/Nmeth.1318. [DOI] [PubMed] [Google Scholar]
- 22.Davis JH, Rubin AJ, Sauer RT. Design, construction and characterization of a set of insulated bacterial promoters. Nucleic Acids Res. 2011;39:1131–1141. doi: 10.1093/nar/gkq810. [DOI] [PMC free article] [PubMed] [Google Scholar]
- 23.Yu D, et al. An efficient recombination system for chromosome engineering in Escherichia coli. Proc Natl Acad Sci U S A. 2000;97:5978–5983. doi: 10.1073/pnas.100127597. [DOI] [PMC free article] [PubMed] [Google Scholar]
- 24.Ishida M, Oshima T. Effective structure of a leader open reading frame for enhancing the expression of GC-rich genes. J Biochem. 2002;132:63–70. doi: 10.1093/oxfordjournals.jbchem.a003199. [DOI] [PubMed] [Google Scholar]
- 25.THOMSON C, WARD W. Bioluminescence and Chemiluminescence. (WORLD SCIENTIFIC); 2011. pp. 115–118. [Google Scholar]
- 26.Ward W. In: Protein Purification. Rizwan Ahmad., editor. InTech; 2012. [Google Scholar]
- 27.Schneider CA, Rasband WS, Eliceiri KW. NIH Image to ImageJ: 25 years of image analysis. Nat Methods. 2012;9:671–675. doi: 10.1038/nmeth.2089. [DOI] [PMC free article] [PubMed] [Google Scholar]
- 28.Wurth C, Grabolle M, Pauli J, Spieles M, Resch-Genger U. Relative and absolute determination of fluorescence quantum yields of transparent samples. Nat Protoc. 2013;8:1535–1550. doi: 10.1038/nprot.2013.087. [DOI] [PubMed] [Google Scholar]
- 29.Oliva MA, Bravo-Zanoguera M, Price JH. Filtering out contrast reversals for microscopy autofocus. Appl Opt. 1999;38:638–646. doi: 10.1364/ao.38.000638. [DOI] [PubMed] [Google Scholar]
- 30.Edelstein AD, et al. Advanced methods of microscope control using muManager software. J Biol Methods. 2014;1 doi: 10.14440/jbm.2014.36. [DOI] [PMC free article] [PubMed] [Google Scholar]
- 31.Dunlop MJ, Cox RS, Levine JH, Murray RM, Elowitz MB. Regulatory activity revealed by dynamic correlations in gene expression noise. Nat Genet. 2008;40:1493–1498. doi: 10.1038/ng.281. [DOI] [PMC free article] [PubMed] [Google Scholar]
Associated Data
This section collects any data citations, data availability statements, or supplementary materials included in this article.
Supplementary Materials
Data Availability Statement
Fluorescence maturation curves, SDS-PAGE gel densitometry calculations, a worksheet to obtain Fig.1 and Fig.2 and SDS-PAGE images of FP-expressing E. coli total lysate are available with the paper online. Data to obtain Fig. 2 and Supplementary Fig. 16 can be found in Dataverse: doi:10.7910/DVN/YH7LHM and doi:10.7910/DVN/OVZMXF. Flow cytometry source data of Supplementary Fig. 11 can be found in Dataverse: doi:10.7910/DVN/T4VSGH. Maturation time experiments from which Table 1 and Fig. 1 were derived can be found in Dataverse: doi:10.7910/DVN/KBNK6R. FPs listed in Table 1, codon optimized FPs and 2nd valine FPs are available at Addgene, IDs from 103968 to 104034.