

Abstract
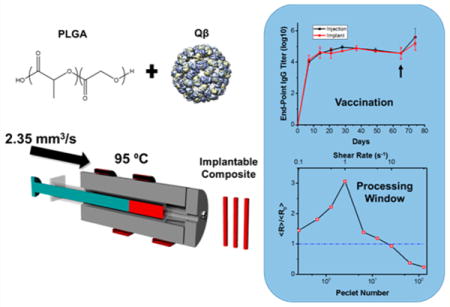
Viral nanoparticles have been utilized as a platform for vaccine development and are a versatile system for the display of antigenic epitopes for a variety of disease states. However, the induction of a clinically relevant immune response often requires multiple injections over an extended period of time, limiting patient compliance. Polymeric systems to deliver proteinaceous materials have been extensively researched to provide sustained release, which would limit administration to a single dose. Melt-processing is an emerging manufacturing method that has been utilized to create polymeric materials laden with proteins as an alternative to typical solvent-based production methods. Melt-processing is advantageous because it is continuous, solvent-free, and 100% of the therapeutic protein is encapsulated. In this study, we utilized melt-encapsulation to fabricate viral nanoparticle laden polymeric materials that effectively deliver intact particles and generate carrier specific antibodies in vivo. The effects of initial processing and postprocessing on particle integrity and aggregation were studied to develop processing windows for scale-up and the creation of more complex materials. The dispersion of particles within the PLGA matrix was studied, and the effect of additives and loading level on the release profile was determined. Overall, melt-encapsulation was found to be an effective method to produce composite materials that can deliver viral nanoparticles over an extended period and elicit an immune response comparable to typical administration schedules.
Keywords: viral nanoparticle, melt-processing, vaccination, PLGA, single administration vaccine, Peclet number
Graphical abstract
Vaccination is an essential treatment in modern medicine to impart long-lasting humoral and cellular responses as well as immune memory against viral infections. Typical vaccines have consisted of live-attenuated or inactivated whole viruses, inactivated toxins, or viral subunits.1 These vaccines are often weakly immunogenic, requiring adjuvants and multiple booster injections to elicit effective protective immunity.2 This requirement can result in adverse side effects due to adjuvant systems and a decrease in patient compliance to return to a physician for the next injection. Many noninfectious synthetic- and protein-based nanoparticle systems have been studied as a replacement for typical vaccines.3,4 Nanoparticle systems incorporating viral subunits and genomes have the ability to affect the immune system in a similar manner to whole viruses due to their size, regularity, and high carrying capacity of antigenic epitopes.5 Regardless of the carrier, however, most vaccines require multiple administrations and may need to be co-delivered with adjuvants for effective immunization. This requirement provides impetus to develop single administration vaccines that could act as all-in-one slow release delivery devices.
Viral nanoparticles (VNPs) are a class of protein-based nanoparticles that have been extensively studied for immunology and biomedical applications. VNPs can consist of native or modified viral capsid proteins encapsidating the viral genome or self-assembled capsid proteins that are non-infectious, also termed virus-like particles (VLPs). The proteinaceous nature of VNPs makes them inherently more biocompatible than synthetic nanoparticles derived from metals or polymers. The precise self-assembly of VNPs yields monodisperse sizes, overcoming heterogeneity and lack of reproducibility often seen with synthetic nanoparticles. The size range of VNPs is 20–500 nm, which promotes uptake by antigen presenting cells (APCs) and induction of an immune response.6,7 Furthermore, the surface of VNPs can be modified by covalent coupling or genetic engineering to display multiple epitopes in a regular array to direct an immune response against a nonviral target.8–10 Five FDA approved VNP vaccines are currently on the market, with several more in clinical trials, further bolstering interest in developing new VNP delivery systems.11
Bacteriophage Qβ is a Levivirus phage that has been engineered for recombinant expression in Escherichia coli to produce 28 nm diameter icosahedral VNPs. Qβ is typically expressed as a non-infectious VLP, has a known crystal structure, and is extremely tolerant to diverse chemical conjugation reactions.12 Qβ has thus been extensively researched as a platform for drug delivery, imaging, and vaccine development.13–15 Most notably, platforms consisting of Qβ covalently coupled with peptide motifs derived from tumor necrosis factor alpha, angiotensin II, ghrelin, and interleukin-1 beta have been utilized as vaccine candidates for treatment and prevention of psoriasis, hypertension, obesity, and diabetes, respectively.9,16–18 These VNP conjugates are effective in inducing the generation of long-lasting neutralizing IgG against the displayed epitopes, and several have advanced to clinical trials. Qβ can also be genetically engineered to produce chimeric particles displaying an epitope or motif,19,20 which has been used to prevent intravascular hemolysis in vivo.21 Thus, Qβ is a versatile, stable, and easily modifiable platform for exploration as a VNP-based vaccine.
Effective immunization using VNP vaccines requires multiple administrations typically over the span of one to two months. Recent studies have focused on creating nanoparticle devices for the sustained delivery of antigens to eliminate the need for a booster regimen. These polymeric nanoparticles encapsulate antigens that can be delivered to APCs after cell uptake and enhance the immune response.22–25 The nanoparticles, however, are formed through emulsification processes that are of low-throughput and often contain trace toxic organic solvents. Emulsification exposes proteins to organic–aqueous interfaces and can result in denaturation and aggregation of complex protein antigens potentially diminishing their effectiveness.26–28 Emulsion techniques also suffer from low encapsulation efficiencies, losing 50–70% of a protein that can be expensive to produce and purify.29–31 Size dispersity and batch-to-batch reproducibility is also challenging with these techniques, as they are dependent on exact mixing speed, ratios, and drying rates. While emulsion synthesis is effective in creating materials for vaccine delivery, it is not trivial to scale-up to large-scale manufacturing of devices for sustained delivery of antigens and VNPs.
Melt encapsulation has been studied as an alternative to emulsion encapsulation techniques for proteins. Melt encapsulation consists of mixing dry powders of polymer, protein, and additive and then heating to above the melt or glass transition of the polymer. The melted blend can then be molded and cooled to form a solid device laden with protein and additive. The most common polymer studied for protein encapsulation has been poly(lactic-co-glycolic acid) (PLGA) due to its biocompatibility, biodegradability, and wide application in FDA-approved devices.32,33 PLGA has a glass transition temperature ranging from 40 to 60 °C depending on the copolymer composition and molecular weights, requiring the temperature of melt encapsulation to be carried out between 80 and 100 °C. The traditional thinking is that proteins would denature and aggregate under these conditions, however in the solid-state proteins largely maintain their secondary structure and enzymatic activity at elevated temperatures.34–37 This is due to a reduced hydration state of the protein, thus lowering the amount of kinetic energy from water molecule vibration transferred to the protein when it is heated. The melt-based process has a theoretical encapsulation of 100%. The resulting device can be molded into many different shapes and sizes by controlling the die geometry or by further melt-molding the material. This concept has been utilized to encapsulate lysozyme and bovine serum albumin, with the recovered lysozyme retaining from 50 to 90% activity and bovine serum albumin maintaining its secondary structure.34,35,38,39 Release of the encapsulated protein can be tuned by the size of the protein being encapsulated, the loading level of the protein, and incorporation of additives.34,40 These factors allow for the modulation of the release kinetics to a desired level based on the device formulation.
In this study, melt encapsulation was utilized to create solid-state PLGA implants laden with Qβ for applications in slow-release vaccine development. Processing parameters relevant to extrusion or injection molding could be tuned to maintain particle integrity postprocessing, providing a window for scale up to commercial polymer processing equipment. Of utmost importance, single-dose implants perform equivalently to traditional vaccine administration schedules. The work presented within lays the foundation for the high-throughput manufacture of single-dose vaccines.
RESULTS AND DISCUSSION
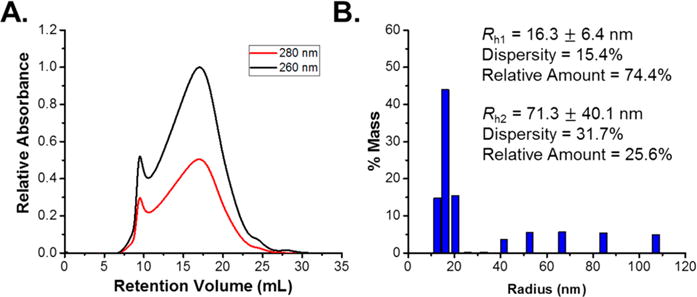
Qβ VLPs were expressed recombinantly in E. coli and purified with typical yields of ~50–100 mg per liter of culture. Chromatographic analysis verified the purity as a single peak in the size-exclusion chromatogram with no aggregates, free protein, or free RNA present (Figure 1A). The purified VLPs exhibited a hydrodynamic radius of ~15 nm determined by dynamic light scattering (DLS) and verified by transmission electron microscopy (TEM). TEM analysis yielded an average radius of 13.2 nm determined via image analysis (Figures 1B,C and S1A). The smaller radius observed in the TEM micrographs is a result of dehydration during TEM preparation versus the hydrodynamic radius measured by DLS. The VLPs were dialyzed into deionized water and lyophilized to yield a fluffy white powder. Resuspension of the powder into PBS and analysis by DLS and fast protein liquid chromatography (FPLC) indicated that lyophilization yielded no negative effect on Qβ and did not result in the formation of aggregates or disassembly of the particles (Figure S2A,B).
Figure 1.
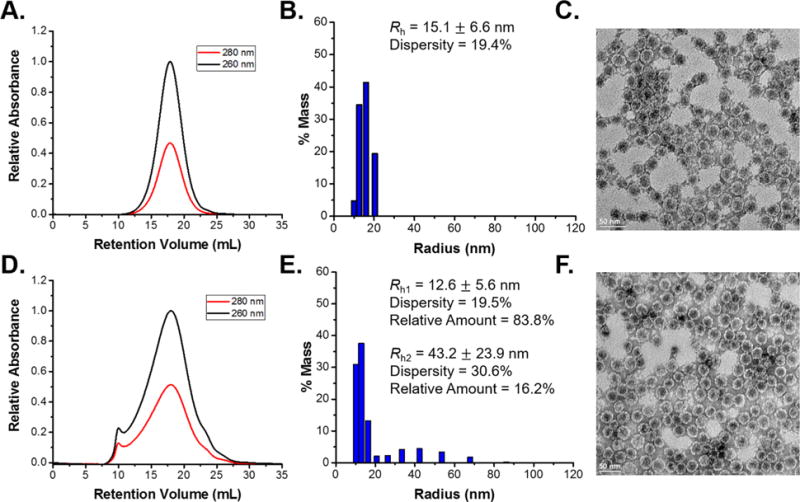
(A) FPLC chromatogram. (B) DLS histogram. (C) TEM image of Qβ showing the typical Gaussian peak on the chromatogram and expected sizes in the DLS and TEM results. (D) FPLC chromatogram. (E) DLS histogram. (F) TEM image of recovered Qβ after melt-encapsulation with PLGA. The peak at 10 mL in the FPLC chromatogram corresponded to aggregated species eluting at the void volume, which also appear as the larger peak in the DLS histogram. The TEM result, along with the FPLC and DLS results, indicated that a large proportion of the particles remain intact and are of the correct size.
Dynamic scanning calorimetry (DSC) of Qβ was conducted to determine thermal transitions that may occur in the processing window for PLGA (Figure S3A,B). The DSC thermogram of the freeze-dried Qβ yielded two endothermic peaks, at 130 and 236 °C respectively. The peak at 130 °C was attributed to the breakup of the disulfide bonds that stabilize coat protein dimers in the icosahedral Qβ structure. Disulfide bond dissociation has been observed in the range of 80–160 °C in solid-state rubber vulcanization and self-healing materials.41,42 The endothermic peak at 236 °C can be attributed to the dissociation of coat protein dimers and denaturation of the coat proteins. Previous DSC studies of lysozyme, glycinin, and human growth hormone in the solid-state have indicated protein denaturation over temperature ranges of 180–200 °C.38,43,44 The higher denaturation temperature observed with lyophilized Qβ was likely due to strong intermolecular attractions associated with dimer stability. The DSC study of Qβ provided insight into the denaturation process during heating in the solid state and ensured that no major denaturation processes occurred in the processing window of 80–100 °C typically used for melt-encapsulation of proteins with PLGA.
Qβ laden implantable polymeric materials were manufactured via melt-encapsulation with PLGA utilizing a lab-built syringe-die extrusion device (Scheme 1). The syringe-die extruder allows for melt-processing of material amounts as low as 100 mg. This provides access to laboratory-scale experiments since commercial small-scale extruders require a minimum of 5 g for effective processing. The low amount of material required makes this a valuable tool for pilot-scale experiments using high-value materials for initial testing. PLGA and Qβ powders were combined and vortexed repeatedly to homogenize the mixture. SEM micrographs and size analysis of the PLGA powder are shown in Figure S4. The mixture was then loaded into a syringe, placed in the extrusion device at 95 °C for 10 min, and then pushed through a 1 mm cylindrical die to yield cylindrical opaque materials. The temperature profile of the syringe extruder is shown in Figure S5. The DSC thermogram of PLGA indicated a glass transition temperature of 37 °C with a small melting endotherm at 41 °C (Figure S2B). The processing temperature was the lowest that gave the most homogeneous cylindrical shape, with no observable aggregated portions of Qβ powders along the length of the extruded material. PLGA materials loaded with 1, 5, and 10 w/w% Qβ were prepared via this method.
Scheme 1.
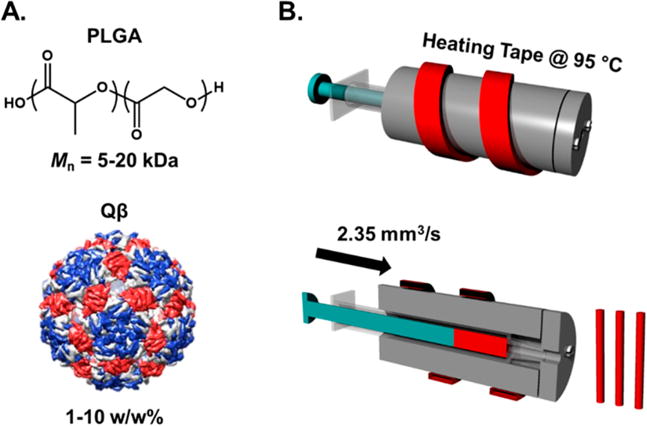
(A) Structures of PLGA and Qβ and (B) Schematic Diagram of the Syringe-Die Melt-Encapsulation Device Showing the Internal Structure of Device and Resulting Cylindrical Extrudates
Following implant fabrication, Qβ was extracted to determine particle integrity, aggregation state, and capsid disassembly. Extraction of Qβ processed at 1 wt % was performed utilizing ethyl acetate to dissolve the polymer, and the remaining Qβ was resuspended in PBS. Treatment of lyophilized Qβ with ethyl acetate and resuspension yielded no aggregated or disassociated species. Qβ extracted after melt-encapsulation was recovered at ~90% and analyzed via DLS and FPLC (Figure 1D,E). DLS and FPLC both indicated the formation of small amounts of aggregated species after melt-encapsulation. The aggregated species apparent in the DLS histogram span from ~30 to 70 nm in radius, indicating small-scale aggregated clusters of 2–5 VLPs. The DLS data were plotted as a mass percentage to better represent the proportion of aggregated species as percent intensity skews toward larger species. The aggregates made up ~16% of the recovered VLPs calculated from the mass percentage distribution. The peak at 10 mL retention volume in the FPLC chromatogram appeared at the void volume of the column with all aggregated species eluting at this volume. Curve fitting and integration of the FPLC curves yielded a relative percentage of 12% aggregated VLPs. Minor peak broadening was observed in the portion of the curve corresponding to dispersed Qβ. Both DLS and FPLC analysis yielded similar values of aggregated species and indicate roughly 85% of VLPs remain dispersed and intact after melt-encapsulation with PLGA at 95 °C. TEM further verified that the particles retained their characteristic icosahedral shape after melt-encapsulation, and the radius determined via image analysis was 13.3 nm, in good agreement with the size determined via TEM prior to melt-encapsulation (Figures 1F and S1B).
The dispersion of Qβ within the PLGA matrix in the solid state was explored through elemental mapping using energy dispersive X-ray spectroscopy coupled with scanning electron microscopy (EDS-SEM). Aggregation and segregation of proteins within the polymer matrix can occur during melt-processing, resulting in regions of protein-rich and protein-poor areas through the cross-section of the material. This poor dispersion of protein can result in irreversible aggregation and denaturation as well as an inconsistent release profile due to burst release when the aggregated regions are exposed to solvent during matrix degradation. All of these factors would negatively affect the desired properties of the Qβ/PLGA materials, thus the effect of loading level on the dispersion of Qβ within PLGA in the solid state was studied to ensure the particles were properly dispersed throughout the matrix. EDS-SEM was a valuable tool for studying dispersion, as it allowed for the visualization of distinct elemental signals through a cross-section of material. SEM images of the freeze-fractured cylindrical materials were obtained, and the distribution of the EDS sulfur K-series signal throughout a 12.5 × 12.5 μm cross-section was obtained (Figures 2 and S6). The sulfur K-series signal was chosen for EDS analysis since it is unique to the protein component in the implant. Qualitative assessment of mapping from neat PLGA indicated very little background signal (Figure S7). The mapping of PLGA loaded with 1, 5, and 10% Qβ resulted in good qualitative dispersion and no segregation of sulfur-poor and -rich regions. The number of spots corresponding to sulfur signal does not increase proportionately to the loading level, however the color intensity of the spot is dependent on the amount of sulfur in the system. Signal thresholding of the images to 50% of maximum signal yielded images that more clearly show the increase in sulfur signal in response to increased loading levels (Figure S8). Furthermore, the quantitative sulfur signal from the EDS spectrum was 0.08, 0.33, and 0.82 wt % for loading levels of 1, 5, and 10 wt %, respectively, indicating that sulfur content scales proportionally with loading level. Quantitative dispersion analysis was performed utilizing ImageJ to determine the cumulative distribution function (CDF) of particles based on the nearest-neighbor and point-to-point distance analysis. The CDF gives the probability that a particle–particle distance is equal to or less than the distance on the plot. The nearest-neighbor and point-to-point distance cumulative distributions followed similar profiles for all loading levels (Figure S9). The nearest-neighbor analysis gave relatively small values for nearest-neighbor distance, with 75% of the particles having a nearest-neighbor <0.5 μm away. The linearity of the point-to-point distance plot is also indicative of the particles being well dispersed, as the distance of the points away from each other would increase sporadically if they were aggregated into clusters. Overall, loading levels of 1, 5, and 10 wt % Qβ did not form aggregated regions within the PLGA during melt-encapsulation based on the qualitative and quantitative results. This result indicated that Qβ can be melt-encapsulated at 1, 5, and 10 wt % with PLGA without aggregation within the matrix, ensuring that the release of Qβ from the matrix will not be adversely effected and will be replicable.
Figure 2.
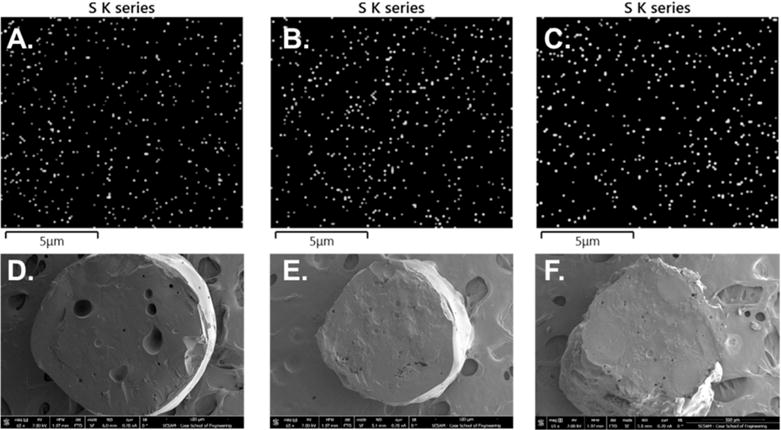
EDS spectrum sulfur K-series emission signal (S K series) map of (A) 1 wt % Qβ, (B) 5 wt % Qβ, and (C) 10 wt % Qβ loaded PLGA material cross sections indicating good dispersion of Qβ within the polymeric matrix. Full-scale SEM images of (D) 1 wt % Qβ, (E) 5 wt % Qβ, and (F) 10 wt % Qβ loaded PLGA material cross sections.
Qβ VLP laden cylindrical polymeric devices were successfully manufactured via melt-encapsulation, and the VLPs maintained particle integrity following extraction. However, most commercial manufacturing processes for polymer nanocomposites typically follow a two-step process: a masterbatch of the composite is compounded, followed by geometric molding. The syringe extrusion process described above is representative of the initial compounding step in the manufacturing of polymeric nanocomposites. Next, we sought to evaluate how VLP integrity in the masterbatch could be maintained in downstream processes such as extrusion, injection molding, or compression molding. All of these processes introduce the composite to similar stress forces, namely pressure and shear forces. Thus, the cylindrical Qβ/PLGA material was subjected to a melt-press, to simulate pressure, or to shear application using a rheometer. The 1 wt % loaded samples were utilized for postprocessing studies as they could be produced in the highest amount due to the lower amount of Qβ needed for material processing.
Typical compression molding is performed by pumping material into a cavity at high pressures for a set amount of time to mold the material into the desired shape. The pressures and times range depending on the polymer, mold, and desired device properties, but generally a pressure range of 500–2000 psi and cycle times of 2–5 min are utilized.45,46 A melt-press was used to apply a pressure of 1200 psi for 5 min at 95 °C, an intermediate range for compression molding. The melt-pressed and extracted VLPs were analyzed via DLS and FPLC to determine the integrity and aggregation state of extracted and recovered Qβ (Figure 3). The resulting DLS histogram indicated an increase in both the amount and size of aggregated particles. Aggregates in the range of 40 to 100 nm radius were observed in the DLS data, corresponding to systems of 3–7 particle aggregates. The percentage of recovered VLPs that were aggregated was 25.5%, an increase of ~10% from the initial melt-encapsulation step. The FPLC chromatogram of the recovered Qβ indicated the presence of aggregates and intact particles with peak maxima at 10 and 18 mL, respectively. The peak centered at 18 mL had considerable broadening toward lower retention volume. A minor tail was observed at higher elution volumes indicating some particle breakup, however this was negligible compared to the remainder of the population. Relative integration of curves fit at 10 and 18 mL resulted in 13% of the recovered particles being aggregated. The discrepancy between the percentage of aggregated species between the DLS and FPLC is a result of the curve in the FPLC not being a true Gaussian curve, thus skewing the curve fitting result. The simulated compression molding conditions resulted in a modest increase in aggregated species from initial melt-encapsulation (~10%) and the majority of Qβ remained as single dispersed particles, demonstrating this system can be suitable for processing via compression molding.
Figure 3.
(A) FPLC chromatogram and (B) DLS histogram of melt-pressed and recovered Qβ indicating an increase in aggregated species eluting at 10 mL in the chromatogram and an increase in the size of aggregated species centered at Rh = 71.3 nm in the DLS histogram.
A rheometer was used to apply different shear rates to 1 wt % Qβ loaded PLGA to emulate the shear effects applied during postprocessing steps. The range of shear rates chosen was from 0.1 to 50 s−1, which correlated to processes with relatively low applied shear. This range is most commonly used in compression molding, blow molding, and 3D printing processes and relevant in conditions the Qβ/PLGA material would be under during production of more complex architectures for implantation.47,48 Shear was applied utilizing a rheometer with a parallel plate configuration for 3 min at 95 °C, and Qβ was recovered via ethyl acetate extraction. The DLS and FPLC results of Qβ after application of shear rates from 0.1 to 50 s−1 indicated a three-phase response to increasing shear rates (Figures 4 and S10). The lowest shear rates from 0.1 to 1 s−1 resulted in an increase in both the size and amount of aggregates in the recovered VLPs in response to increasing shear rate. Further increase in applied shear rate to 2.5–10 s−1 diminished the size and amount of aggregates observed. Increasing the applied shear rate to 25 and 50 s−1 yielded no observable aggregates in the DLS histogram. Analysis of the recovered Qβ via FPLC indicated the same trend observed with DLS, and the intensity of the aggregate peak at 10 mL increased relative to the Qβ peak at 18 mL after application of shear rates from 0.1 to 1 s−1.
Figure 4.
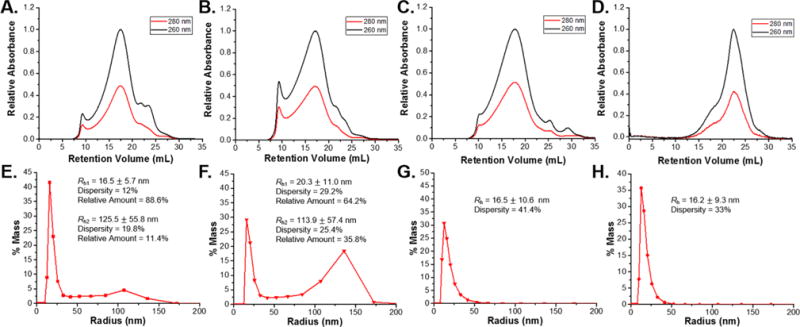
FPLC chromatograms of recovered Qβ samples subjected to shear rates of (A) 0.1 s−1, (B) 1 s−1, (C) 10 s−1, and (D) 50 s−1. DLS plots of recovered Qβ samples subjected to shear rates of (E) 0.1 s−1, (F) 1 s−1, (G) 10 s−1, and (H) 50 s−1. Both FPLC and DLS results indicate that low shear rates, from 0.1 to 1 s−1, resulted in an increase in aggregated species. Higher shear rates, up to 10 s−1, dispersed aggregated species due to the higher shear forces applied. Shear rates exceeding 10 s−1 induced particle breakup as evidenced by the appearance of a large peak at 22.5 mL on the FPLC chromatogram.
FPLC chromatograms of samples subjected to shear rates from 2.5 to 10 s−1 were also in good agreement with the DLS results, with the aggregate peak diminishing in intensity as the shear rate increased. All samples subjected from 0.1 to 10 s−1 exhibited some degree of disassociated species eluting at higher retention volumes. These species likely consist of partially disassociated VLPs, free coat protein dimers, and free RNA. Thus, any application of shear to the samples appears to result in a degree of disassociation of Qβ, however these are all relatively minor when compared to the aggregates and single particles based on the peak area observed in the FPLC. As shear rates approached 10 s−1, a significant reduction in particle aggregates is observed, and the chromatograms show predominately intact particles. Finally, as the shear rate continues to increase to 25 and 50 s−1, extensive capsid dissociation is seen, as evidenced by the predominant peak at 23.2 mL in the FPLC. Curve-fitting and relative integration of the FPLC curves yielded values of 35% and 22% of particles maintaining integrity after application 25 and 50 s−1 shear rates, respectively. The disassociated species were not observed in the DLS data, as the estimated radius of ~3 nm, based on the crystal structure, falls below the limit of detection for the instrument. The particle breakup observed at 25 and 50 s−1 indicates that care must be taken in applying higher shear rates to the Qβ/PLGA material. Processes such as twin-screw extrusion and injection molding often have shear rates above 100 s−1, which would not be suitable for this system. However, these limitations could be overcome with slower screw speeds during extrusion to maintain shear rates in the acceptable range to retain particle integrity.
It was evident from the DLS and FPLC analysis that the aggregation state and integrity of Qβ within PLGA are dependent on the shear rate applied during melt-processing. As such, we sought to derive a physical model to determine particle stability versus aggregation state in varying shear environments. The mass average radius of all species in the recovered VLPs was estimated from the DLS distribution for samples at shear rates from 0.1 to 10 s−1. Shear rates of 25 and 50 s−1 cause extensive particle breakup, with the disassociated particles unable to be measured via DLS due to the lower limits of detection. Thus, the radius average for the 25 and 50 s−1 samples was estimated using the DLS radius for intact particles and the radius of 3.2 nm for coat protein dimer using a globular estimation of the coat protein dimer from the crystal structure. These two values were averaged using the percentage of intact particle and coat protein dimer estimated from the relative integration of the FPLC curves. The averaged radii were normalized by the average radius of Qβ recovered before the application of shear (⟨R⟩/⟨R0⟩) and plotted versus the applied shear (Figure 5A, top axis). The resulting plot demonstrated a clear dependence of particle aggregation and disassociation on applied shear rate. The average particle size increases to 3 times the initial radius with increasing shear rate, with a maximum reached at 1 s−1. Processing particles at shear rates >1 s−1 causes a return to the initial radius, until a critical shear rate of 25 s−1 was reached where particle dissociation occurred. This information is useful for designing postprocessing conditions for Qβ laden PLGA materials, however the trend in aggregation state observed is only applicable to this polymer system.
Figure 5.
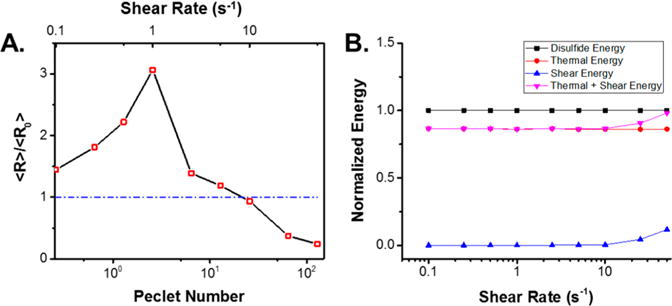
(A) Plot of the mass average normalized radius versus applied shear rate (top axis) and Peclet number (bottom axis). Plotting the aggregation behavior versus the shear rate and Peclet number allows for the determination of ideal processing parameters to prevent excessive aggregation and particle breakup of Qβ in PLGA and other polymeric systems during melt-processing (B) Applied energy to the particles versus total particle disulfide energy analysis indicating the thermal and shear energy approached the level of disulfide energy in the Qβ particles at 25 and 50 s−1 shear rates, resulting in the observed particle breakup.
The shear rate relationship was transformed into a Peclet number relationship to expand the utility of the data to processing Qβ with other polymer systems and at differing temperatures (Figure 5A, bottom axis). The Peclet number is a dimensionless number that represents the ratio of convective forces to diffusive forces. The convective forces are dependent on the shear rates applied, and the diffusive forces are dependent on the Brownian motion in the system. This allowed for the estimation of shear forces based on the viscosity of the melted system, the shear rate, and the volume of the system. The Brownian forces were estimated by the Stokes–Einstein equation, which is directly dependent on temperature. Conversion of the aggregation state relative to the Peclet number generalizes the relationship and allows for the estimation of aggregation state in other shear dependent processes. Understanding the aggregation state in response to the applied shear, polymer viscosity, and temperature allows for the calculation of relevant processing conditions without extensive scouting experiments. Thus, the relationship derived from the shear rate application, aggregation states, and Peclet number will allow for the determination of processing conditions to create materials with minimal aggregation and particle breakup for other polymer systems and temperatures. In this case, Peclet values between ~5 and 25 resulted in well-dispersed single nanoparticles without dissociation, providing a baseline value for translation to alternative systems.
The stability of Qβ during melt-processing is theorized to be due to the highly interconnected network of disulfide bonds that link coat protein dimers together, forming a thermally and chemically stable covalently attached assembly.49 The extensive particle breakup observed in samples subjected to 25 and 50 s−1 shear rates was hypothesized to be a result of the disassociation of disulfide linkages stabilizing adjacent coat protein dimers. The total energy applied to the system from thermal and shear stress sources was estimated and compared to the total energy of disulfide bonds present to validate this theory. The peak at 130 °C from the DSC thermogram (Figure S2A) was integrated to yield a total disulfide bond energy of 43,860 kJ per mol of particle, assuming the peak centered at 130 °C corresponded to disulfide bond breakage.41,42 Theoretical calculation of the total disulfide bond energy per particle using the bond enthalpy of a disulfide bond yielded a value of 45,180 kJ/mol, in good agreement with the DSC result; further validating the peak assignment of 130 °C as disulfide bond breakage. Therefore, the amount of disulfide bond energy in each sample was calculated using the value derived from the DSC peak integration and the amount of Qβ present in each sample. The energy derived from the shear and thermal effects during shear application was calculated and normalized by the disulfide bond energy per sample for comparison. The resulting plot clearly shows that the energy contribution of the shear stress does not greatly affect the system until shear rates of 25 and 50 s−1 (Figure 5B). The thermal energy present in the system is always 20% below the disulfide bond energy by these calculations and remains constant for all samples. The shear energy increase observed only with 25 and 50 s−1 and subsequent increase in total applied energy relative to the total disulfide bond energy in the system support the conclusion that the higher shear rates result in disulfide bond disassociation between dimers.
After the validation and analysis of the effect of processing conditions on VLP integrity, the effects of loading level and additives on cylindrical materials containing Qβ was studied to determine how Qβ would release from the implant in vitro. Understanding the release properties in vitro was important in designing an optimal system for in vivo implantation that would release appropriate amounts of VNP to elicit an immune response without excessive burst release phases or extremely slow release. All of the samples studied were manufactured via melt-encapsulation with the syringe-die extrusion device and used without any further postprocessing. First, PEG additives were utilized to determine the effect on release of Qβ from 1 wt % loaded samples prepared via syringe-die melt-encapsulation. Samples loaded with 1 wt % Qβ did not demonstrate any burst release and had a significant lag period over the first 15 days (Figure 6A). The first 15 days of release from PLGA materials corresponds to the initial swelling and induction phase, where the polymer matrix swells and minimal hydrolysis of the polymer occurs. The lowest loading level of Qβ exhibited a significant delay in release, likely due to the VLPs remaining within unswelled regions of PLGA until the matrix begins to degrade. Release begins after 15 days as the polymer degrades and erodes, allowing for the Qβ to diffuse out of the matrix into the surroundings. This process continued until day 80 when the material had degraded into small pieces in solution. The total amount of protein released was ~62% of the total amount present. PEG additives were added during the melt-encapsulation process to accelerate the release, as PEG is a known porogen for PLGA materials.34 Upon hydration of the material, PEG will diffuse into the aqueous media rapidly leaving behind voids through which Qβ can diffuse. Two PEG molecular weights were used (8 and 20 kDa) to avoid negative immune responses in vivo and to keep the molecular weight of the porogen in the same range as PLGA.50 Both PEG molecular weights were manufactured at 10 wt % loading levels and resulted in a burst release of Qβ during the initial swelling. The Qβ release was increased over the induction phase from days 10 to 30 as the VLPs were able to diffuse more readily through the matrix as porosity was increased by PEG. Matrix erosion started after day 30, and the remaining Qβ was released rapidly as a result of oligomeric PLGA species diffusing more rapidly from the matrix. No significant difference was observed between 8 and 20 kDa PEG additive (Figure 6A). PEG sizes from 10 to 20 kDa exhibit hydrodynamic radii of 3–3.5 nm, thus the small difference in hydrodynamic size between 8 and 20 kDa PEG results in the minimal differences seen in release profiles.51 Nonetheless, either PEG additive greatly accelerated the release rate of Qβ and had no negative effect during processing.
Figure 6.
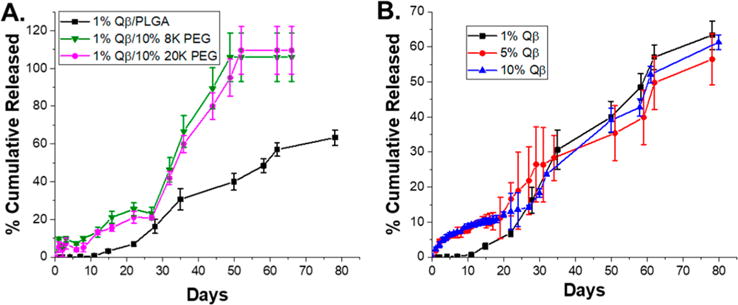
Release profiles of (A) 1 wt % Qβ loaded PLGA samples with 10 wt % PEG 8K and PEG 20K additives and (B) 1, 5, and 10 wt % loaded Qβ loaded PLGA. Reported as the average and standard deviation of 3 samples.
Loading level is known to influence the release profile from protein-laden PLGA materials, thus the effect of loading for PLGA samples containing 1, 5, and 10 wt % Qβ was studied.35,40 Increasing the loading level to 5 and 10 wt % Qβ increased the amount released over the swelling and induction phase by 10% compared to 1 wt % Qβ samples (Figure 6B). Furthermore, the release after the initial burst was relatively linear for both loading levels. After matrix erosion started, the release increased dramatically, and all samples followed a similar release profile regardless of loading level. The increased loading levels of 5 and 10 wt % had little effect on the matrix erosion phase, which is hypothesized to be due to the small size of the VLPs not greatly increasing the void size after diffusion out of the matrix. The void size allowing for oligomeric PLGA diffusion would control the speed at which the matrix erodes, and the loading levels explored did not appear to affect this greatly enough to influence the overall release profile. All samples broke down into small pieces in solution at 80 days and had similar final cumulative release levels. FPLC analysis of samples collected at the 2 and 50 day time points released from implants loaded with 10% Qβ indicated good stability throughout the release process with minimal increase in particle aggregation or breakup (Figure S11).
The in vitro release of 10 wt % Qβ loaded PLGA was studied in release medium with varying ionic strengths to determine how interparticle and particle–polymer interactions effect release behavior. Increasing the ionic strength by increasing the molarity of NaCl has previously been shown to increase the release of lysozyme from PLGA microspheres through disruption of ionic interactions between carboxylic acid moieties in PLGA and the cationically charged lysozyme.52 The release of Qβ from the PLGA implants exhibited a clear dependence on ionic strength, with decreasing amounts released in response to higher concentrations of NaCl (Figure S12). Qβ exhibits a negative zeta potential at pH 7.4, indicating that under the release conditions the particles would exhibit an overall negative charge.53 Therefore, increasing salt concentration would shield the negative charges on both Qβ and PLGA and decrease repulsion between both adjacent Qβ particles and Qβ with PLGA. The decrease in ionic repulsion due to charge shielding would result in closer association and aggregation between particles; a similar result has been previously observed in surface adsorption studies of Qβ.53 The increase in ionic strength has also been thought to slow release by decreasing PLGA swelling via charge shielding.54 We speculate this would result in a “jamming” effect of particles as they diffuse out of the polymer matrix through water filled pores and channels, slowing the release and resulting in the observed decrease in release rate with increasing ionic strength.
The release samples at all ionic strengths were then incubated sequentially with buffered solutions of 1 M NaCl, 5 M guanidine hydrochloride (GnHCl), and 5 mM sodium dodecyl sulfate (SDS) to determine the factors resulting in the observed incomplete release of Qβ (Table S1). The addition of 1 M NaCl did not result in any further significant release of Qβ, indicating that ionic interactions do not play a major role in unreleased Qβ, which is consistent with the decreasing release of Qβ in response to increasing ionic strength. Further incubation with 5 M GnHCl, which would disrupt noncovalent aggregates of Qβ, resulted in an increase in released Qβ for all samples with higher ionic strength samples exhibiting higher amounts of released protein. This result indicated that noncovalent aggregation of Qβ is a factor in particles remaining entrapped within the polymer matrix and that high ionic strength release medium results in more aggregation between particles. The final incubation with SDS would breakup any aggregates not disrupted via GnHCl incubation and Qβ adsorbed on PLGA. The results of SDS incubation released an additional 42–53% of Qβ, indicating a significant amount of Qβ remained within the polymer matrix due to adsorption onto the polymer. This amount was nearly the amount of Qβ remaining from the previous release study, and all samples reached approximately full cumulative release after incubation with SDS. Based on this release study, the incomplete release of Qβ was predominately due to adsorption of Qβ onto the polymer. Noncovalent aggregates of Qβ were formed more readily with increasing ionic strength, based on the release observed with GnHCl, owing to charge shielding. These factors in the incomplete release of Qβ are common issues observed in the release of proteins from PLGA systems.55 While in vitro release studies are important to understand how the release of Qβ is influenced by different factors after melt-encapsulation, the behavior of PLGA materials in vivo is much more complex due to multitude of enzymes, chemicals, and fluid dynamics present.
PLGA materials laden with Qβ were then utilized to assess their performance to stimulate a humoral immune response in a murine model; we tested whether a robust IgG response was generated against Qβ after melt-encapsulation and release. The subcutaneously implanted Qβ laden devices were evaluated alongside a subcutaneous immunization schedule of 50 μg Qβ injected 3 times biweekly (Figure 7A). Control implantation of neat PLGA cylinders indicated mild swelling over the first 2 weeks, with mice exhibiting no other adverse health or behavioral conditions. The amounts injected and schedule were based on previous studies utilizing VLPs displaying antigen epitopes without adjuvants to successfully generate humoral immunity in mice.56,57 PLGA loaded with 10 wt % Qβ was utilized for the immunization studies, and mice were implanted with 0.5 cm (~8 mg) of 1 mm cylindrical material. The amount of implanted material correlated to ~150 μg of released Qβ over 30 days based on the in vitro release profile, delivering roughly the same amount of Qβ over the first 28 days as the mice immunized via subcutaneous injection. Consistent levels of anti Qβ-IgG titers were observed over 65 days and the booster administration lead to a successful increase in IgG levels, as expected (Figure 7B). Overall, the Qβ vaccine implant matched the IgG titer profile compared to a contemporary repeat-administration schedule using soluble Qβ. The resulting titers were also consistent with previous studies using VLPs to immunize with the same vaccination schedule.9 This demonstrates that the VLP delivery systems manufactured via melt-encapsulation can potentially eliminate the need for multiple injections for immunization and that the VLPs maintain the integrity of the surface epitopes after melt-encapsulation.
Figure 7.
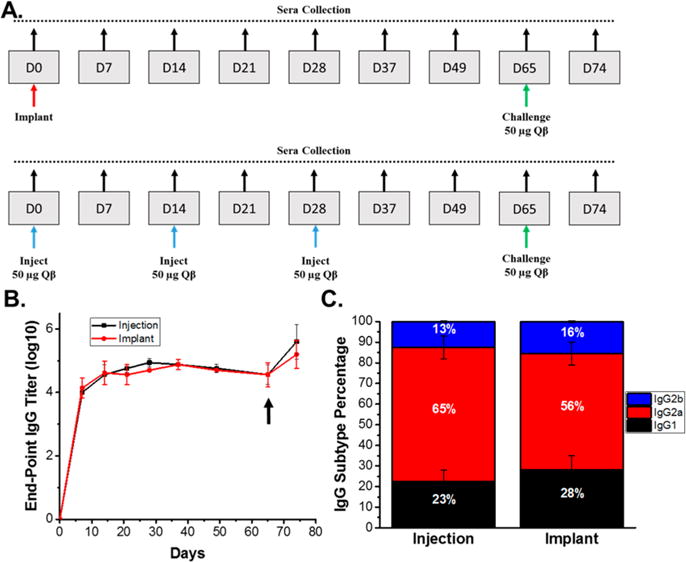
(A) Immunization and bleeding schedule of mice implanted with 0.5 cm of 10 wt % Qβ loaded PLGA and mice immunized via 3 subcutaneous injections of 50 μg Qβ. (B) End-point titers of anti-Qβ IgG indicating the implanted PLGA/Qβ devices immunize as effectively as repeated Qβ administration and (C.) IgG subtype percentages of mice immunized via subcutaneous injection and device implantation, which indicate similar immune response via the same IgG subtype generation between mice immunized via injection and implantation. The arrow indicates a challenge with 50 μg Qβ for all mice, and the IgG subtypes were measured using sera collected on day 65. Titers and subtype percentages are reported as the average and standard deviation of measurements from five mice.
Different subtypes of IgG are indicative of different mechanisms of immune system activation, hence the subtypes of anti-Qβ IgG were determined at day 49, for both the implanted and injected animals (Figure 7C). In the future, the Qβ/PLGA platform is envisioned as a single administration cancer immunotherapy. Both immunization methods generated predominately IgG2a, which has a high binding ability of FCγ receptors and mediates the antibody-dependent cell cytotoxicity (ADCC) of cancer cells by neutrophils.58,59 This is important when exploring Qβ as a cancer vaccine candidate, as this pathway is necessary to utilize the immune response to prevent cancer. IgG1 was the second most predominate species for both immunization methods and is involved in complement fixation and the ADCC by natural killer cells.60 IgG2b was a minor fraction of both IgG pools and serves a similar function as IgG2a. The ability of melt-encapsulated Qβ to generate a statistically identical IgG subtype profile when compared to injected Qβ further validated the implanted material as an alternative delivery vehicle for VLPs.
CONCLUSIONS
Melt-encapsulation was a viable method to create polymeric materials laden with Qβ particles. Qβ maintained integrity with minimal aggregation after processing at 95 °C and withstood emulated postprocessing conditions of compression molding and extrusion/injection molding. The relationship of Qβ aggregation to shear rate was nondimensionalized to be applicable to other polymer systems and processing conditions. The addition of PEG and increasing loading level increased the amount of Qβ released over time, and the materials prepared were able to sustain Qβ delivery over an 80 day period in vitro. PLGA materials loaded with 10 wt % Qβ were able to generate the same levels of anti-Qβ IgG relative to a 3 injection immunization schedule in vivo. Furthermore, the IgG subclass types generated were present in the same percentages between mice immunized via implantation or injection. The IgG subclasses generated are identical to injections with boosts, providing confidence that the Qβ delivery system can be expanded to include a variety of vaccination targets. These results demonstrate that VLPs can be successfully melt-encapsulated with PLGA and maintain structural integrity and biochemical signature to affect the immune system in vivo.
EXPERIMENTAL SECTION
Preparation of PLGA/Protein Implants
Poly(lactic-co-glycolic acid) (PLGA), 8 kDa polyethylene glycol (8KPEG), and 20 kDa PEG (20KPEG) were individually ground manually with a mortar and pestle twice, 10 min each time, into a fine powder. The PLGA powder consisted of particles with an average length of 185.8 ± 89.1 μm as determined via SEM image analysis (Figure S4). PLGA was mixed with the appropriate weight percent of lyophilized Qβ and PEG (if added) via repeated vortexing in a 2 mL Eppendorf tube. Formulations were as follows with all percentages expressed as a weight percent: PLGA/1%Qβ; PLGA/1%Qβ/10%8KPEG; PLGA/1%Qβ/10%20KPEG, PLGA/5%Qβ, PLGA/10%Qβ. Two different custom built aluminum syringe-dies were used for melt processing of the blends to minimize material input. Both syringe-die systems consisted of a cylinder with a circular 1 mm exit diameter that was wrapped with heating tape, combined with a digital control element to provide constant heating. The die used for melt encapsulation of samples for in vitro testing utilized polypropylene BD LUER LOK syringes which were filled with 500–200 mg of the PLGA/Qβ blends and heated at 95 °C as determined by a glass thermometer (99.9 °C average along the temperature profile as determined via an infrared thermometer) for 10 min. The melted PLGA/Qβ blend was flowed through the die using a syringe pump with a velocity of 3 mm s−1 (~2.35 mm3 s−1 volumetric flow rate). The resulting cylindrical implants had diameters ranging from 1.0 to 1.3 mm. Melt encapsulation of ClearColi produced Qβ for in vivo testing was performed with a cylinder manufactured to fit polypropylene 1 mL volume Norm-Ject syringes. The die still consisted of a circular 1 mm hole. This barrel was used to minimize materials due to the lower yield of ClearColi produced particles. The syringe was filled with 50–100 mg of the appropriate PLGA/Qβ blend and extruded in the same method as previously described. There was no difference observed in implant diameter or particle integrity between samples fabricated with different barrels.
Shear Application
Shear application was performed by loading 150–300 mg of PLGA/1%Qβ onto a 25 mm wide parallel plate rheometer at 95 °C. Samples were allowed to equilibrate for 5 min, then the top plate was lowered to a gap of 0.45 mm and shear rates from 0.1 to 50 s−1 were applied for 3 min. The sample was recovered from the rheometer postshear, and the Qβ was recovered and analyzed via the extraction method previously described. The viscosity of the samples was also measured during this process and found to be in the range of 120–130 Pa·s, with an average of 128 Pa·s.
Radius Shear Dependency and Peclet Number Calculations
Qβ samples recovered postshear application were analyzed via DLS and FPLC. Weight-average hydrodynamic radii were calculated from the DLS data for samples subjected to 0.1, 0.25, 0.5, 1, 2.5, 5, 10, 25, and 50 s−1. Samples subjected to 25 and 50−1 exhibited extensive particle breakup when analyzed via FPLC. The breakup product was assumed to be coat protein dimers, which exhibit a radius of 3.21 nm estimated from the crystal structure (PDB: 1QBE).12 This estimate is similar to the hydrodynamic radius of green fluorescent protein (2.8 nm), which is of similar molecular weight to the coat protein dimer (27 and 28 kDa, respectively).61 The ratio of intact particles to coat protein dimers was calculated via curve fitting of the two major curves observed in the FPLC. The ratio of intact particles was multiplied by the weight-average radius determined via DLS and added to the ratio of coat protein dimer multiplied by 3.21 nm to give an average radius of species in the 25 and 50 s−1 samples, as shown by the equation below:
where Rave is the average radius for samples subjected to 25 and 50 s−1 shear rates, Rave, DLS is the mass average radius calculated from the DLS result, %particle is the percentage of particle calculated from curve fitting of the FPLC, and %dimer is the percentage of dimer calculated from curve fitting of the FPLC.
The weight-average radius was divided by the weight-average radius of Qβ that had been extracted from PLGA/1%Qβ samples that had not been subjected to shear. This result was plotted as the radius of shear applied samples to the initial radius versus shear rate. This result was nondimensionalized by calculating the Peclet number for each shear rate. The Peclet number (Pe) is a dimensionless number of the ratio of convective forces versus the diffusive forces in a fluid system. The Peclet number was calculated as the ratio of shear stress applied on the particles over the diffusive forces estimated by the Stokes–Einstein equation, as shown by the equation below:
where η is the viscosity of the polymer melt (Pa·s), is the shear rate applied to the system (s−1), R is the weight-average radius of the particles before shear application (m), kB is the Boltzmann’s constant (J·K−1), and T is the temperature of the system (K).
The resulting plot of particle radius of shear applied samples to the initial radius versus Peclet number is useful in relating the aggregation behavior of Qβ during melt encapsulation to other polymer systems with different viscosities and processing temperatures.
Shear Application Thermal Analysis Calculations
Mathematical analysis was performed to estimate the total applied energy to the system during shear application and correlate it to the observed particle breakup. Qβ particle breakup into free dimers involves the breakage of disulfide bonds between adjoining dimers on the particle, with each dimer containing 4 disulfide linkages and one particle containing 90 coat protein dimers. The bond dissociation energy of a disulfide bond is typically 251 kJ/mol. Thus, the theoretical energy of all disulfides per particle was calculated to be 45,180 kJ/mol of particle. Integration of the first endothermic peak on the DSC thermogram (from 84 to 172 °C) as shown by the equation below, which is speculated to be disulfide breakup, yielded a value of 43,860 kJ/mol particle in good agreement with the theoretical value.41,42
where Edisulfide is the total enthalpy of disulfides per mole of particle (J/mol Qβ), MWQβ is the molecular weight of Qβ = 2,556,000 g/mol, ΔT/s is the heating rate of the DSC study, 0.333 K/s, and mW/g is the heat flux of the DSC sample per gram (W/g).
The value determined via DSC integration was used to calculate the total disulfide bond energy present based on the mass of Qβ present in each shear application sample. The moles of PLGA in the system was calculated based on the mass of PLGA in the system and an average molecular weight of 12.5 kDa.
The total applied energy to the system during shear application was calculated as the sum of the energy applied by shear stress and thermal energy with the effects of shear heating taken into account utilizing the equations shown below. The energy values were normalized by the total disulfide bond energy present in each sample.
where η is the viscosity of the polymer melt (Pa·s), is the shear rate applied to the system (s−1), Vsystem is the total volume of Qβ and PLGA (m3), kB is the Boltzmann’s constant (J·K−1), NA is Avogadro’s number, Tapplied is the temperature during shear application (K), ΔTshear is the temperature increase due to shear heating (K), molQβ is the moles of Qβ in the system, and molPLGA is the moles of PLGA in the system.
Immunization and ELISA Analysis
All experiments were carried out in accordance with Case Western Reserve University’s Institutional Animal Care and Use Committee. Prior to immunization studies, 3 male Balb/c mice aged 7 weeks were implanted subcutaneously with ~0.5 cm of neat PLGA cylinder via puncture with a 16 gauge needle and insertion with forceps. The mice were monitored for 4 weeks and exhibited swelling at the site of insertion for 2 weeks after insertion, which subsequently subsided. The mice did not exhibit any adverse health or behavioral response to the implantation of the neat PLGA cylinders. For standard immunization, male Balb/c mice (Charles River) aged 7 weeks (n = 5) were immunized 3 times on days 0, 14, and 28 with 50 μg Qβ in 100 μL sterile PBS through subcutaneous injections behind the neck using a 29G insulin syringe. The Qβ was produced in ClearColi E. coli cells that contain a modified lipopolysaccharide (LPS) outer membrane that does not elicit an immune response in mice. Blood (~100 μL) was drawn prior to the first immunization and on a weekly to biweekly basis via the retro-orbital plexus using heparinized capillary tubes and collected in Greiner Bio-One VACUETTE MiniCollect tubes. Serum was separated by centrifuging blood samples at 14,800 rpm, 4 °C, for 10 min and stored at 4 °C until analyzed via enzyme-linked immunosorbent-assay (ELISA). For implant immunization, male Balb/c mice (Charles River) aged 7 weeks (n = 5) had 0.5 cm (~8 mg) of PLGA/10%Qβ inserted into the subcutaneous space on the neck via puncture with the tip of a 16 gauge needle and insertion with forceps. The amount of implanted material was chosen to deliver roughly the same amount of Qβ over the first 28 days as the mice immunized via subcutaneous injection based on the in vitro release profile, with ~0.8 mg of implant correlating to ~150 μg of released Qβ over 30 days. Orbital bleeds were conducted as previously described on the same days as the standard immunization schedule mice. All mice were boosted at day 65 with 50 μg of Qβ. After day 75, all mice were euthanized, and the subcutaneous space was examined. No implant material was present in any of the implanted mice, and no extensive scar tissue was present compared to nonimplanted mice.
The anti-Qβ IgG response was measured by first coating Nunc Maxisorp 96-well plates with 2 μg of Qβ in 200 μL of sterile PBS, pH 7.4 at 4 °C overnight. The wells were then blocked with 200 μL of blocking buffer (2.5% w/v dry milk, 25% neonatal calf serum in PBS, pH 7.4) at 37 °C for 1 h. The wells were then incubated with mouse sera at dilutions from 1:100 to 1:1000000 in 100 μL blocking buffer for 2 h at 37 °C. The wells were then incubated with 100 μL of a 1:1000 dilution in blocking buffer of alkaline-phosphatase labeled goat antimouse IgG for 1 h at 37 °C. The wells were washed between each incubation step using 3 × 250 μL of 0.1% w/v Tween-20 in PBS, pH 7.4. The wells were developed using 100 μL of 1-step PNPP substrate at 4 °C for 10 min. The reaction was stopped with 100 μL of 2 M NaOH, and the absorbance was read at 405 nm in triplicate for each sample. The end-point titer value was determined by comparison to a statistically defined cutoff value based on the prebleed measurements of 10 mice and a confidence level of 99%.62 Values are expressed as the average and standard deviation of five mice.
Murine anti-Qβ IgG subtypes were determined via the ELISA method described above with alkaline-phosphatase labeled goat antimouse IgG1, IgG2a, and IgG2b used for detection. Percentages are expressed as the average and standard deviation of five mice.
Supplementary Material
Acknowledgments
This research was funded in part by a grant from Clinical and Translational Science Collaborative of Cleveland, 4UL1TR000439 from the National Center for Advancing Translational Sciences (NCATS) component of the National Institutes of Health (to J.K.P.), the National Science Foundation (DMR 0423914), and the Susan G. Komen Foundation CCR14298962 (to N.F.S.). The authors would like to thank Dr. Yinghua Chen and the Protein Expression Purification Crystallization and Molecular Biophysics Core of department of Physiology and Biophysics Core (Case Western Reserve University, Cleveland) for assistance with DLS measurement. The authors would like to thank the Dr. Nanthawan Avishai and the Swagelok Center for Surface Analysis of Materials for the EDX-SEM facilities.
Footnotes
Supporting Information
The Supporting Information is available free of charge on the ACS Publications website at DOI: 10.1021/acsnano.7b02786.
FPLC chromatograms and DLS histograms of lyophilized Qβ and Qβ after application of 0.25–25 s−1, DSC thermograms of Qβ and PLGA, SEM micrographs of the EDS map sites, the SEM micrograph and EDS map of neat PLGA, cumulative distribution function plots for the EDS maps, FPLC chromatograms of Qβ released from 10% w/w loaded implants, and full material and methods are provided (PDF)
ORCID
Parker W. Lee: 0000-0002-0491-3742
Nicole F. Steinmetz: 0000-0002-0130-0481
Jonathan K. Pokorski: 0000-0001-5869-6942
Notes
The authors declare no competing financial interest.
References
- 1.Arnon R, Ben-Yedidia T. Old and New Vaccine Approaches. Int Immunopharmacol. 2003;3:1195–1204. doi: 10.1016/S1567-5769(03)00016-X. [DOI] [PubMed] [Google Scholar]
- 2.Kersten GFA, Crommelin DJA. Liposomes and ISCOMs. Vaccine. 2003;21:915–920. doi: 10.1016/s0264-410x(02)00540-6. [DOI] [PubMed] [Google Scholar]
- 3.Park J, Wrzesinski SH, Stern E, Look M, Criscione J, Ragheb R, Jay SM, Demento SL, Agawu A, Licona Limon P, Ferrandino AF, Gonzalez D, Habermann A, Flavell RA, Fahmy TM. Combination Delivery of TGF-B Inhibitor and IL-2 by Nanoscale Liposomal Polymeric Gels Enhances Tumour Immunotherapy. Nat Mater. 2012;11:895–905. doi: 10.1038/nmat3355. [DOI] [PMC free article] [PubMed] [Google Scholar]
- 4.Van der Veen AH, Eggermont AM, Seynhaeve AL, van Tiel ST, ten Hagen TL. Biodistribution and Tumor Localization of Stealth Liposomal Tumor Necrosis Factor-Alpha in Soft Tissue Sarcoma Bearing Rats. Int J Cancer. 1998;77:901–906. doi: 10.1002/(sici)1097-0215(19980911)77:6<901::aid-ijc17>3.0.co;2-3. [DOI] [PubMed] [Google Scholar]
- 5.Fan Y, Moon JJ. Nanoparticle Drug Delivery Systems Designed to Improve Cancer Vaccines and Immunotherapy. Vaccines. 2015;3:662–685. doi: 10.3390/vaccines3030662. [DOI] [PMC free article] [PubMed] [Google Scholar]
- 6.Gamvrellis A, Leong D, Hanley JC, Xiang SD, Mottram P, Plebanski M. Vaccines That Facilitate Antigen Entry into Dendritic Cells. Immunol Cell Biol. 2004;82:506–516. doi: 10.1111/j.0818-9641.2004.01271.x. [DOI] [PubMed] [Google Scholar]
- 7.Blank F, Stumbles PA, Seydoux E, Holt PG, Fink A, Rothen-Rutishauser B, Strickland DH, von Garnier C. Size-Dependent Uptake of Particles by Pulmonary Antigen-Presenting Cell Populations and Trafficking to Regional Lymph Nodes. Am J Respir Cell Mol Biol. 2013;49:67–77. doi: 10.1165/rcmb.2012-0387OC. [DOI] [PubMed] [Google Scholar]
- 8.Yusibov V, Rabindran S, Commandeur U, Twyman RM, Fischer R. The Potential of Plant Virus Vectors for Vaccine Production. Drugs R&D. 2006;7:203–217. doi: 10.2165/00126839-200607040-00001. [DOI] [PubMed] [Google Scholar]
- 9.Spohn G, Keller I, Beck M, Grest P, Jennings GT, Bachmann MF. Active Immunization with IL-1 Displayed on Virus-like Particles Protects from Autoimmune Arthritis. Eur J Immunol. 2008;38:877–887. doi: 10.1002/eji.200737989. [DOI] [PubMed] [Google Scholar]
- 10.Lomonossoff GP, Johnson JE. Use of Macromolecular Assemblies as Expression Systems for Peptides and Synthetic Vaccines. Curr Opin Struct Biol. 1996;6:176–182. doi: 10.1016/S0959-440X(96)80072-8. [DOI] [PMC free article] [PubMed] [Google Scholar]
- 11.Zhang X, Xin L, Li S, Fang M, Zhang J, Xia N, Zhao Q. Lessons Learned from Successful Human Vaccines: Delineating Key Epitopes by Dissecting the Capsid Proteins. Hum Vaccines Immunother. 2015;11:1277–1292. doi: 10.1080/21645515.2015.1016675. [DOI] [PMC free article] [PubMed] [Google Scholar]
- 12.Golmohammadi R, Fridborg K, Bundule M, Valegård K, Liljas L. The Crystal Structure of Bacteriophage Q Beta at 3.5 A Resolution. Structure. 1996;4:543–554. doi: 10.1016/s0969-2126(96)00060-3. [DOI] [PubMed] [Google Scholar]
- 13.Prasuhn DE, Singh P, Strable E, Brown S, Manchester M, Finn MG. Plasma Clearance of Bacteriophage Qbeta Particles as a Function of Surface Charge. J Am Chem Soc. 2008;130:1328–1334. doi: 10.1021/ja075937f. [DOI] [PMC free article] [PubMed] [Google Scholar]
- 14.Huber A, Bachmann M, Jennings G, Tissot A, Langedijk J, Timmerman P, Slootstra J, Boshuizen R. Circular ccr5 Peptide Conjugates and Uses Thereof. CA2672826. Patent. 2008 Jun 26;
- 15.Pokorski JK, Breitenkamp K, Liepold LO, Qazi S, Finn MG. Functional Virus-Based Polymer–Protein Nanoparticles by Atom Transfer Radical Polymerization. J Am Chem Soc. 2011;133:9242–9245. doi: 10.1021/ja203286n. [DOI] [PMC free article] [PubMed] [Google Scholar]
- 16.Bachmann M, Fulurija A. Ghrelin-Carrier Conjugates. US20050191317. Patent. 2005 Sep 1;
- 17.Spohn G, Guler R, Johansen P, Keller I, Jacobs M, Beck M, Rohner F, Bauer M, Dietmeier K, Kündig TM, Jennings GT, Brombacher F, Bachmann MF. A Virus-like Particle-Based Vaccine Selectively Targeting Soluble TNF-Alpha Protects from Arthritis without Inducing Reactivation of Latent Tuberculosis. J Immunol. 2007;178:7450–7457. doi: 10.4049/jimmunol.178.11.7450. [DOI] [PubMed] [Google Scholar]
- 18.Ambühl PM, Tissot AC, Fulurija A, Maurer P, Nussberger J, Sabat R, Nief V, Schellekens C, Sladko K, Roubicek K, Pfister T, Rettenbacher M, Volk HD, Wagner F, Müller P, Jennings GT, Bachmann MF. A Vaccine for Hypertension Based on Virus-like Particles: Preclinical Efficacy and Phase I Safety and Immunogenicity. J Hypertens. 2007;25:63–72. doi: 10.1097/HJH.0b013e32800ff5d6. [DOI] [PubMed] [Google Scholar]
- 19.Pokorski JK, Hovlid ML, Finn MG. Cell Targeting with Hybrid Qβ Virus-Like Particles Displaying Epidermal Growth Factor. ChemBioChem. 2011;12:2441–2447. doi: 10.1002/cbic.201100469. [DOI] [PMC free article] [PubMed] [Google Scholar]
- 20.Brown SD, Fiedler JD, Finn MG. Assembly of Hybrid Bacteriophage Qβ Virus-like Particles. Biochemistry. 2009;48:11155–11157. doi: 10.1021/bi901306p. [DOI] [PMC free article] [PubMed] [Google Scholar]
- 21.Zhang L, Qiu W, Crooke S, Li Y, Abid A, Xu B, Finn MG, Lin F. Development of Autologous C5 Vaccine Nanoparticles to Reduce Intravascular Hemolysis in Vivo. ACS Chem Biol. 2017;12:539–547. doi: 10.1021/acschembio.6b00994. [DOI] [PMC free article] [PubMed] [Google Scholar]
- 22.Phanse Y, Carrillo-Conde BR, Ramer-Tait AE, Broderick S, Kong CS, Rajan K, Flick R, Mandell RB, Narasimhan B, Wannemuehler MJ. A Systems Approach to Designing next Generation Vaccines: Combining A-Galactose Modified Antigens with Nanoparticle Platforms. Sci Rep. 2015;4:3775. doi: 10.1038/srep03775. [DOI] [PMC free article] [PubMed] [Google Scholar]
- 23.Bobbala S, Tamboli V, McDowell A, Mitra AK, Hook S. Novel Injectable Pentablock Copolymer Based Thermoresponsive Hydrogels for Sustained Release Vaccines. AAPS J. 2016;18:261–269. doi: 10.1208/s12248-015-9843-4. [DOI] [PMC free article] [PubMed] [Google Scholar]
- 24.Rosalia RA, Cruz LJ, van Duikeren S, Tromp AT, Silva AL, Jiskoot W, de Gruijl T, Löwik C, Oostendorp J, van der Burg SH, Ossendorp F. CD40-Targeted Dendritic Cell Delivery of PLGA-Nanoparticle Vaccines Induce Potent Anti-Tumor Responses. Biomaterials. 2015;40:88–97. doi: 10.1016/j.biomaterials.2014.10.053. [DOI] [PubMed] [Google Scholar]
- 25.Chen M, Ouyang H, Zhou S, Li J, Ye Y. PLGA-Nanoparticle Mediated Delivery of Anti-OX40 Monoclonal Antibody Enhances Anti-Tumor Cytotoxic T Cell Responses. Cell Immunol. 2014;287:91–99. doi: 10.1016/j.cellimm.2014.01.003. [DOI] [PubMed] [Google Scholar]
- 26.Manning MC, Chou DK, Murphy BM, Payne RW, Katayama DS. Stability of Protein Pharmaceuticals: An Update. Pharm Res. 2010;27:544–575. doi: 10.1007/s11095-009-0045-6. [DOI] [PubMed] [Google Scholar]
- 27.Pérez-Rodriguez C, Montano N, Gonzalez K, Griebenow K. Stabilization of Alpha-Chymotrypsin at the CH2Cl2/water Interface and upon Water-in-Oil-in-Water Encapsulation in PLGA Microspheres. J Controlled Release. 2003;89:71–85. doi: 10.1016/s0168-3659(03)00074-9. [DOI] [PubMed] [Google Scholar]
- 28.Morlock M, Koll H, Winter G, Kissel T. Microencapsulation of Rh-Erythropoietin, Using Biodegradable Poly(d,l-Lactide-Co-Glycolide): Protein Stability and the Effects of Stabilizing Excipients. Eur J Pharm Biopharm. 1997;43:29–36. [Google Scholar]
- 29.Wang W, Nema S, Teagarden D. Protein aggregation—Pathways and Influencing Factors. Int J Pharm. 2010;390:89–99. doi: 10.1016/j.ijpharm.2010.02.025. [DOI] [PubMed] [Google Scholar]
- 30.Fan Y, Li X, Zhou Y, Fan C, Wang X, Huang Y, Liu Y. Improved Intestinal Delivery of Salmon Calcitonin by Water-in-Oil Microemulsions. Int J Pharm. 2011;416:323–330. doi: 10.1016/j.ijpharm.2011.06.029. [DOI] [PubMed] [Google Scholar]
- 31.Blanco-Príeto MJ, Fattal E, Gulik A, Dedieu JC, Roques BP, Couvreur P. Characterization and Morphological Analysis of a Cholecystokinin Derivative Peptide-Loaded Poly(lactide-Co-Glycolide) Microspheres Prepared by a Water-in-Oil-in-Water Emulsion Solvent Evaporation Method. J Controlled Release. 1997;43:81–87. [Google Scholar]
- 32.Jain RA. The Manufacturing Techniques of Various Drug Loaded Biodegradable Poly(lactide-Co-Glycolide) (PLGA) Devices. Biomaterials. 2000;21:2475–2490. doi: 10.1016/s0142-9612(00)00115-0. [DOI] [PubMed] [Google Scholar]
- 33.Lü J-M, Wang X, Marin-Muller C, Wang H, Lin PH, Yao Q, Chen C. Current Advances in Research and Clinical Applications of PLGA-Based Nanotechnology. Expert Rev Mol Diagn. 2009;9:325–341. doi: 10.1586/erm.09.15. [DOI] [PMC free article] [PubMed] [Google Scholar]
- 34.Ghalanbor Z, Körber M, Bodmeier R. Improved Lysozyme Stability and Release Properties of Poly(lactide-Co-Glycolide) Implants Prepared by Hot-Melt Extrusion. Pharm Res. 2010;27:371–379. doi: 10.1007/s11095-009-0033-x. [DOI] [PubMed] [Google Scholar]
- 35.Ghalanbor Z, Körber M, Bodmeier R. Protein Release from Poly(lactide-Co-Glycolide) Implants Prepared by Hot-Melt Extrusion: Thioester Formation as a Reason for Incomplete Release. Int J Pharm. 2012;438:302–306. doi: 10.1016/j.ijpharm.2012.09.015. [DOI] [PubMed] [Google Scholar]
- 36.Chang J-Y, Li L. The Unfolding Mechanism and the Disulfide Structures of Denatured Lysozyme. FEBS Lett. 2002;511:73–78. doi: 10.1016/s0014-5793(01)03284-7. [DOI] [PubMed] [Google Scholar]
- 37.Moriyama Y, Watanabe E, Kobayashi K, Harano H, Inui E, Takeda K. Secondary Structural Change of Bovine Serum Albumin in Thermal Denaturation up to 130 °C and Protective Effect of Sodium Dodecyl Sulfate on the Change. J Phys Chem B. 2008;112:16585–16589. doi: 10.1021/jp8067624. [DOI] [PubMed] [Google Scholar]
- 38.Lee P, Towslee J, Maia J, Pokorski J. PEGylation to Improve Protein Stability During Melt Processing. Macromol Biosci. 2015;15:1332–1337. doi: 10.1002/mabi.201500143. [DOI] [PMC free article] [PubMed] [Google Scholar]
- 39.Cossé A, König C, Lamprecht A, Wagner KG. Hot Melt Extrusion for Sustained Protein Release: Matrix Erosion and In Vitro Release of PLGA-Based Implants. AAPS PharmSciTech. 2017;18:15–26. doi: 10.1208/s12249-016-0548-5. [DOI] [PubMed] [Google Scholar]
- 40.Ghalanbor Z, Körber M, Bodmeier R. Interdependency of Protein-Release Completeness and Polymer Degradation in PLGA-Based Implants. Eur J Pharm Biopharm. 2013;85:624–630. doi: 10.1016/j.ejpb.2013.03.031. [DOI] [PubMed] [Google Scholar]
- 41.Mukhopadhyay R, De SK, Chakraborty SN. Effect of Vulcanization Temperature and Vulcanization Systems on the Structure and Properties of Natural Rubber Vulcanizates. Polymer. 1977;18:1243–1249. [Google Scholar]
- 42.Xu Y, Chen D. A Novel Self-Healing Polyurethane Based on Disulfide Bonds. Macromol Chem Phys. 2016;217:1191–1196. [Google Scholar]
- 43.Huson MG, Strounina EV, Kealley CS, Rout MK, Church JS, Appelqvist IAM, Gidley MJ, Gilbert EP. Effects of Thermal Denaturation on the Solid-State Structure and Molecular Mobility of Glycinin. Biomacromolecules. 2011;12:2092–2102. doi: 10.1021/bm200080h. [DOI] [PubMed] [Google Scholar]
- 44.Pikal MJ, Rigsbee D, Roy ML. Solid State Stability of Proteins III: Calorimetric (DSC) and Spectroscopic (FTIR) Characterization of Thermal Denaturation in Freeze Dried Human Growth Hormone (hGH) J Pharm Sci. 2008;97:5122–5131. doi: 10.1002/jps.21386. [DOI] [PubMed] [Google Scholar]
- 45.Giles HF. Pressure/temperature Measurements during Compression Molding of Glass Mat Reinforced Thermoplastic Composites. J Vinyl Addit Technol. 1995;1:174–177. [Google Scholar]
- 46.Parasnis NC, Ramani K. Analysis of the Effect of Pressure on Compression Moulding of UHMWPE. J Mater Sci: Mater Med. 1998;9:165–172. doi: 10.1023/a:1008871720389. [DOI] [PubMed] [Google Scholar]
- 47.Lee T-S. Rheological Behavior of Linear Polyethylene at Low Shear Rates. J Appl Polym Sci. 1969;13:395–396. [Google Scholar]
- 48.Genina N, Holländer J, Jukarainen H, Mäkilä E, Salonen J, Sandler N. Ethylene Vinyl Acetate (EVA) as a New Drug Carrier for 3D Printed Medical Drug Delivery Devices. Eur J Pharm Sci. 2016;90:53–63. doi: 10.1016/j.ejps.2015.11.005. [DOI] [PubMed] [Google Scholar]
- 49.Ashcroft AE, Lago H, Macedo JMB, Horn WT, Stonehouse NJ, Stockley PG. Engineering Thermal Stability in RNA Phage Capsids via Disulphide Bonds. J Nanosci Nanotechnol. 2005;5:2034–2041. doi: 10.1166/jnn.2005.507. [DOI] [PubMed] [Google Scholar]
- 50.Lubich C, Allacher P, de la Rosa M, Bauer A, Prenninger T, Horling FM, Siekmann J, Oldenburg J, Scheiflinger F, Reipert BM. The Mystery of Antibodies Against Polyethylene Glycol (PEG) - What Do We Know? Pharm Res. 2016;33:2239–2249. doi: 10.1007/s11095-016-1961-x. [DOI] [PubMed] [Google Scholar]
- 51.Linegar KL, Adeniran AE, Kostko AF, Anisimov MA. Hydrodynamic Radius of Polyethylene Glycol in Solution Obtained by Dynamic Light Scattering. Colloid J. 2010;72:279–281. [Google Scholar]
- 52.Park TG, Yong Lee H, Sung Nam Y. A New Preparation Method for Protein Loaded Poly(d,l-Lactic-Co-Glycolic Acid) Microspheres and Protein Release Mechanism Study. J Controlled Release. 1998;55:181–191. doi: 10.1016/s0168-3659(98)00050-9. [DOI] [PubMed] [Google Scholar]
- 53.Armanious A, Aeppli M, Jacak R, Refardt D, Sigstam T, Kohn T, Sander M. Viruses at Solid-Water Interfaces: A Systematic Assessment of Interactions Driving Adsorption. Environ Sci Technol. 2016;50:732–743. doi: 10.1021/acs.est.5b04644. [DOI] [PubMed] [Google Scholar]
- 54.Bodmer D, Kissel T, Traechslin E. Factors Influencing the Release of Peptides and Proteins from Biodegradable Parenteral Depot Systems. J Controlled Release. 1992;21:129–137. [Google Scholar]
- 55.Giteau A, Venier-Julienne MC, Aubert-Pouëssel A, Benoit JP. How to Achieve Sustained and Complete Protein Release from PLGA-Based Microparticles? Int J Pharm. 2008;350:14–26. doi: 10.1016/j.ijpharm.2007.11.012. [DOI] [PubMed] [Google Scholar]
- 56.Spohn G, Jennings GT, Martina BE, Keller I, Beck M, Pumpens P, Osterhaus AD, Bachmann MF. A VLP-Based Vaccine Targeting Domain III of the West Nile Virus E Protein Protects from Lethal Infection in Mice. Virol J. 2010;7:146. doi: 10.1186/1743-422X-7-146. [DOI] [PMC free article] [PubMed] [Google Scholar]
- 57.Röhn TA, Jennings GT, Hernandez M, Grest P, Beck M, Zou Y, Kopf M, Bachmann MF. Vaccination against IL-17 Suppresses Autoimmune Arthritis and Encephalomyelitis. Eur J Immunol. 2006;36:2857–2867. doi: 10.1002/eji.200636658. [DOI] [PubMed] [Google Scholar]
- 58.Nimmerjahn F, Ravetch JV. Fcγ Receptors as Regulators of Immune Responses. Nat Rev Immunol. 2008;8:34–47. doi: 10.1038/nri2206. [DOI] [PubMed] [Google Scholar]
- 59.Stewart R, Hammond SA, Oberst M, Wilkinson RW. The Role of Fc Gamma Receptors in the Activity of Immunomodulatory Antibodies for Cancer. J Immunother Cancer. 2014;2:29. [Google Scholar]
- 60.Wang W, Erbe AK, Hank JA, Morris ZS, Sondel PM. NK Cell-Mediated Antibody-Dependent Cellular Cytotoxicity in Cancer Immunotherapy. Front Immunol. 2015;6:368. doi: 10.3389/fimmu.2015.00368. [DOI] [PMC free article] [PubMed] [Google Scholar]
- 61.Baum M, Erdel F, Wachsmuth M, Rippe K. Retrieving the Intracellular Topology from Multi-Scale Protein Mobility Mapping in Living Cells. Nat Commun. 2014;5:4494. doi: 10.1038/ncomms5494. [DOI] [PMC free article] [PubMed] [Google Scholar]
- 62.Frey A, Di Canzio J, Zurakowski D. A Statistically Defined Endpoint Titer Determination Method for Immunoassays. J Immunol Methods. 1998;221:35–41. doi: 10.1016/s0022-1759(98)00170-7. [DOI] [PubMed] [Google Scholar]
Associated Data
This section collects any data citations, data availability statements, or supplementary materials included in this article.