

Summary
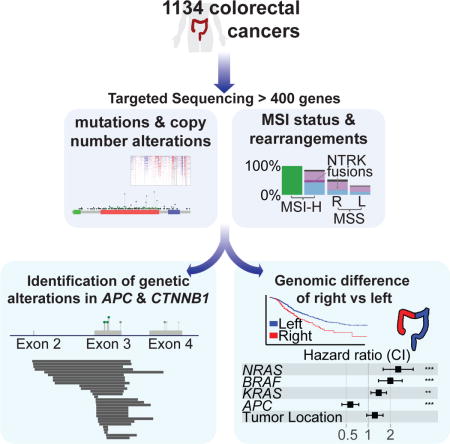
Metastatic colorectal cancers (mCRCs) are clinically heterogeneous, but the genomic basis of this variability remains poorly understood. We performed prospective targeted sequencing of 1134 CRCs. We identified splice alterations in intronic regions of APC and large in-frame deletions in CTNNB1, increasing oncogenic WNT pathway alterations to 96% of CRCs. Right-sided primary site in microsatellite stable mCRC was associated with shorter survival, older age at diagnosis, increased mutations, and enrichment of oncogenic alterations in KRAS, BRAF, PIK3CA, AKT1, RNF43, and SMAD4 compared to left-sided primaries. Left-sided tumors frequently had no identifiable genetic alteration in mitogenic signaling, but exhibited higher mitogenic ligand expression. Our results suggest different pathways to tumorigenesis in right- and left-sided microsatellite stable CRC that may underlie clinical differences.
Graphical Abstract
Introduction
Colorectal cancer (CRC) was one of the first tumor types to be viewed as a genetic disease where the accumulation of genetic alterations underlies the development of dysplasia and the progression to carcinoma and invasion (Fearon and Vogelstein, 1990). More recently, comprehensive sequencing studies, such as The Cancer Genome Atlas (TCGA) (Cancer Genome Atlas Network, 2012; Giannakis et al., 2016; Haan et al., 2014), have defined molecular subtypes of CRC, by identifying genomic events characteristic of ultra-mutated, microsatellite instability-high (MSI-H)/hypermutated, and microsatellite stable (MSS) CRCs (Donehower et al., 2013). These studies have focused on early stage and resectable disease.
Metastatic CRC (mCRC) is a large public health problem: it is the third most common cause of cancer death worldwide (Siegel et al., 2017a), and there is a growing incidence of CRC, often metastatic, among younger patients (Siegel et al., 2017b). Metastatic CRC, however, can exhibit a range of clinical behavior, from curable oligometastatic disease to rapidly progressing fatal disease. The goal of this study is to define the genomic landscape of metastatic tumors and to identify prognostic and predictive biomarkers. Additionally, by analyzing mCRC within the clinical setting, we aimed to evaluate how often genomic analysis provides clinically actionable therapeutic information.
Results
We analyzed a total of 1134 colorectal adenocarcinomas, consisting of 1011 tumors (478 primaries, 533 metastases) from 979 patients with mCRC and 123 tumors from 120 patients with early stage CRC (Table 1, Figures S1A and S1B, Table S1). Tumors were analyzed using MSK-IMPACT, a capture based next generation sequencing platform that can detect mutations, copy number alterations, and select rearrangements in 341 or more cancer genes (Table S2, Figure S1A). The average depth of sequencing coverage across all tumor samples was 747 reads. We identified a total of 14,671 nonsynonymous, somatic variants (median 7, range 1–361) (Table S3).
Table 1.
Patient characteristics
| All Subjects | MSS | MSI - H/Hypermutated | POLE | |
|---|---|---|---|---|
| Total patients | 1099 | 995 (90.5%) | 96 (8.7%) | 8 (0.7%) |
| Age (years) | ||||
| Mean +/− SD | 54.5 ± 12.8 | 54.2 ± 12.4 | 57.6 ± 16.5 | 51.0 ± 13.7 |
| Median | 54 | 54 | 60.5 | 52 |
| Range | 13–93 | 13–93 | 20–85 | 24–70 |
| Sex | ||||
| Male | 597 (54.3%) | 536 (53.9%) | 54 (56.3%) | 7 (87.5%) |
| Female | 502 (45.7%) | 459 (46.1%) | 42 (43.8%) | 1 (12.5%) |
| Stage at diagnosis | ||||
| Stage I | 40 (3.6%) | 34 (3.4%) | 6 (6.3%) | 0 (0%) |
| Stage II | 128 (11.6%) | 88 (8.8%) | 37 (38.5%) | 3 (37.5%) |
| Stage III | 267 (24.3%) | 228 (22.9%) | 35 (36.5%) | 4 (50%) |
| Stage IV | 664 (60.4%) | 645 (64.8%) | 18 (18.8%) | 1 (12.5%) |
| Primary tumor site | ||||
| Right colon | 326 (29.7%) | 254 (25.5%) | 67 (69.8%) | 5 (62.5%) |
| Left colon | 505 (45.9%) | 482 (48.4%) | 20 (20.8%) | 2 (25%) |
| Rectum | 255 (23.2%) | 246 (24.7%) | 8 (8.3%) | 1 (12.5%) |
| NOS | 14 (1.3%) | 13 (1.3%) | 1 (1%) | 0 (0%) |
| Race | ||||
| White | 866 (78.8%) | 784 (78.8%) | 78 (81.3%) | 4 (55.6%) |
| Black | 74 (6.7%) | 68 (6.8%) | 5 (5.2%) | 1 (11.1%) |
| Asian | 74 (6.7%) | 67 (6.7%) | 5 (5.2%) | 2 (22.2%) |
| Native Hawaiian | 1 (0.1%) | 1 (0.1%) | 0 (0%) | 0 (0%) |
| Other | 7 (0.6%) | 7 (0.7%) | 0 (0%) | 0 (0%) |
| Unknown | 77 (7.0%) | 68 (6.8%) | 8 (8.3%) | 1 (11.1%) |
| Sample Histology | ||||
| Conventional | 572 (50.4%) | 546 (53.2%) | 24 (24.2%) | 2 (25%) |
| Conventional with mucinous component | 88 (7.8%) | 67 (6.5%) | 19 (19.2%) | 2 (25%) |
| MANEC | 3 (0.3%) | 2 (0.2%) | 1 (1%) | 0 (0%) |
| Medullary | 2 (0.2%) | 0 (0%) | 2 (2%) | 0 (0%) |
| Mucinous | 33 (2.9%) | 23 (2.2%) | 9 (9%) | 1 (12.5%) |
| PDC | 82 (7.2%) | 67 (6.5%) | 14 (14.1%) | 1 (12.5%) |
| Signet ring cell | 5 (0.4%) | 5 (0.5%) | 0 (0%) | 0 (0%) |
| N/A and Other | 349 (30.8%) | 317 (30.9%) | 30 (30.3%) | 2 (25%) |
| Sample Grade | ||||
| Moderately differentiated | 595 (52.5%) | 555 (54.0%) | 36 (36.4%) | 4 (50%) |
| Moderately to poorly differentiated | 92 (8.1%) | 78 (7.6%) | 13 (13.1%) | 1 (12.5%) |
| Poorly differentiated | 96 (8.5%) | 77 (7.5%) | 18 (18.2%) | 1 (12.5%) |
| N/A and Other | 351 (31.0%) | 317 (30.9%) | 32 (32.3%) | 2 (25%) |
| Sample Type Sequenced | ||||
| Total samples | 1134 | 1027 (90.6%) | 99 (8.7%) | 8 (0.7%) |
| Early Stage Primary | 123 (10.8%) | 61 (5.9%) | 59 (59.6%) | 3 (37.5%) |
| mCRC Primary | 478 (42.2%) | 447 (43.5%) | 28 (28.2%) | 3 (37.5%) |
| mCRC Metastasis | 53435 (47.0%) | 519 (50.5%) | 12 (12.1%) | 2 (25%) |
Subtype classification
Cases were classified as POLE mutant, MSI-H/hypermutated, or MSS. First, POLE-mutated cases were identified based on the presence of a known POLE exonuclease domain mutation (P286R, S459F, or V411L) (Church et al., 2013) (Figure 1A). The remaining samples were then grouped as MSI-H/hypermutated based on a MSIsensor score of ≥10 (see Methods) or a mutation burden of >25 per MB (Figure 1A), resulting in 1027 MSS tumors (90.6%), 99 MSI-H/hypermutated tumors (8.7%), and 8 POLE mutant tumors (0.7%) (Figure 1B).
Figure 1.
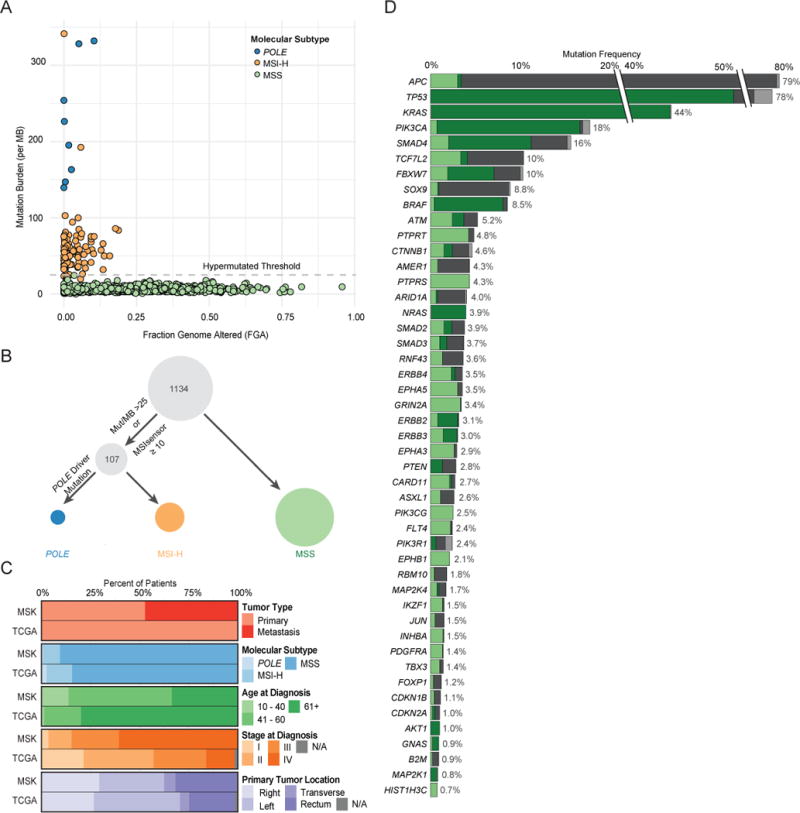
Cohort characteristics and significantly recurrently altered genes identified by MSK-IMPACT testing. (A) Mutation burden versus fraction of genome altered in the 1134 CRC samples sequenced. (B) Classification schema for molecular subtypes: POLE-mutated, MSI-H/hypermutated, and MSS. (C) Comparison of clinical characteristics between the MSK and TCGA CRC cohorts. (D) Significantly recurrently mutated genes identified in MSS CRC and the breakdown of genetic changes within these genes. As the MSK-IMPACT gene panel was successively expanded during the study period, all frequencies and p values were adjusted by the number of samples in which the gene was sequenced. TCF7L2, INHBA, and HIST1H3C were not included in the earliest gene panel. See also Figures S2 and S3 and Tables S2 and S3.
The one case of ambiguous classification was the tumor with the highest mutation burden (361 mutations), which included a non-hotspot POLE N363D exonuclease domain mutation. While we found a similar spectrum of single nucleotide changes in this tumor compared to all known POLE mutant cases sequenced by MSK-IMPACT (Zehir et al., 2017) (Figure S2A), the case lacked the trinucleotide mutation spectrum characteristic of POLE mutant tumors (Alexandrov et al., 2013) (Figure S2B). The tumor had an MSIsensor score of 8.7, but showed loss of MSH6 expression by IHC and harbored three somatic alterations (2 nonsense mutations and 1 missense mutation) in MSH6. We thus classified it as MSI-H/hypermutated.
Cohort characteristics
Thirty percent of samples were collected by needle biopsies, while 70% of samples analyzed were resection specimens (Figure S1B). Just over half of specimens (52%) were obtained before any treatment. Patient characteristics for our series are summarized in Table 1. POLE mutant cases were predominantly early stage, male patients, consistent with the known clinical features of this group (Domingo et al., 2016). There was enrichment for MSI-H cases among early stage tumors due to clinical selection. Median age at diagnosis was significantly higher for MSI-H/hypermutated CRC patients than for MSS CRC patients (60 years versus 54 years, p=0.01). Among MSI-H/hypermutated cases, median age at diagnosis was 72 years for BRAF V600E mutant cases and 55 years for cases without BRAF V600E mutation (p<0.01).
The MSK cohort was demographically distinct from the TCGA CRC cohort (Figure 1C) and consists of more aggressive and advanced disease. Median follow-up for MSS early-stage cases (n=59) was 23.7 months (range: 2.0–131.6 months) and for MSS mCRC was 28.6 months (range: 0–292.9 months). In total, 47% of sequenced samples in the MSK cohort were metastases compared to zero such cases in TCGA. The median age at diagnosis of patients in the MSK series was lower than in TCGA-CRC (54 compared to 70 years), and stage at diagnosis was more advanced in the MSK cohort compared to TCGA-CRC (60% versus 14% stage IV). The distribution of molecular subtype was similar between the two cohorts, but there were fewer POLE mutant cases in the MSK cohort, consistent with the known better prognosis of these cases (Domingo et al., 2016), and early stage MSI-H tumors were more commonly submitted for clinical sequencing than MSS tumors. Among mCRC cases analyzed, 4% were MSI-H. Distribution of primary tumor site was similar between the MSK cohort and TCGA. Genomic studies in the MSK cohort may thus provide insights into more advanced disease that were not apparent in the TCGA CRC cohort.
Significantly recurrently mutated genes in MSS CRC
With the goal of identifying oncogenic alleles, we sought to define recurrently mutated genes in MSS CRC (Figure 1D, see Methods). Forty-seven recurrently mutated genes were identified, the most frequently mutated being APC (79%), TP53 (78%), KRAS (44%), PIK3CA (18%), and SMAD4 (16%). We identified potentially novel recurrently mutated genes in MSS CRC, which included PTPRS, PIK3CG, FLT4, MAP2K4, IKZF1, JUN, TBX3, FOXP1, INHBA, and CDKN1B. Mutations in these genes, affect between 1% and 4% of tumors. Five of the 47 genes (EPHA5, ERBB4, GRIN2A, HIST1H3C, PTPRT) had low levels of expression in the TCGA CRC cohort (bottom quartile) (Figure S2C), and mutations in these genes were likely passenger events.
To identify genes associated with progression to metastatic disease, we compared the frequencies of oncogenic genomic alterations in early stage primaries, from TCGA or the MSK cohort, to primaries or metastases from patients with mCRC, focusing on the 42 genes that were identified as significantly recurrently mutated within the MSS cases in our series (Figures S3A, S3B). TP53 alterations were the only genomic event significantly enriched in mCRC. Thus, while we identified many genes as recurrently altered in CRC, only TP53 alterations are selectively enriched in metastatic disease. FBXW7 alterations were enriched in early stage tumors compared to mCRC, suggesting a potential protective effect. Eighteen patients in our series had more than one sample sequenced and comparison of the spectrum of genomic alterations in the multiple samples from the same patient suggested few genomic differences between tumor specimens (Figure S3C). Overall, these data indicate a high level of genomic concordance between primary and metastatic colorectal tumors.
WNT Pathway alterations
The most common genomic alterations in this cohort were diverse and largely truncating mutations in APC. Other recurrently mutated genes in the WNT pathway were CTNNB1 (8%) and RNF43 (9%), resulting in an overall pathway alteration frequency of 93% in MSI-H tumors and 85% in MSS tumors (Figure 2A). Notably, we identified 35 MSS cases harboring a recurrent intronic single-nucleotide variant eight nucleotides upstream of APC exon 9 (chr5:112151184 A>G; NM_000038). Sixteen of these occurred in tumors without another WNT pathway alteration, and the remaining nineteen occurred in cases with a single APC mutation. This somatic intronic mutation was specific to MSS CRC, as we did not identify the mutant allele in any other tumor type analyzed by MSK-IMPACT (n = 9,939) (Zehir et al., 2017). We hypothesized that this mutation introduces a splice acceptor site that results in a frameshift in the protein (Figure 2B), and we were able to detect the presence of this splice variant in all five tumors that we tested using a digital PCR assay. We experimentally tested the biological effect of this non-coding mutation in five tumors, and all five exhibited nuclear β-catenin staining, consistent with WNT activation (three representative examples are shown in Figure 2B). These data suggest that recurrent genomic alterations in introns can affect mRNA splicing, and our identification of a splice site variant extends known functional genomic alterations in APC into the introns of the gene.
Figure 2.
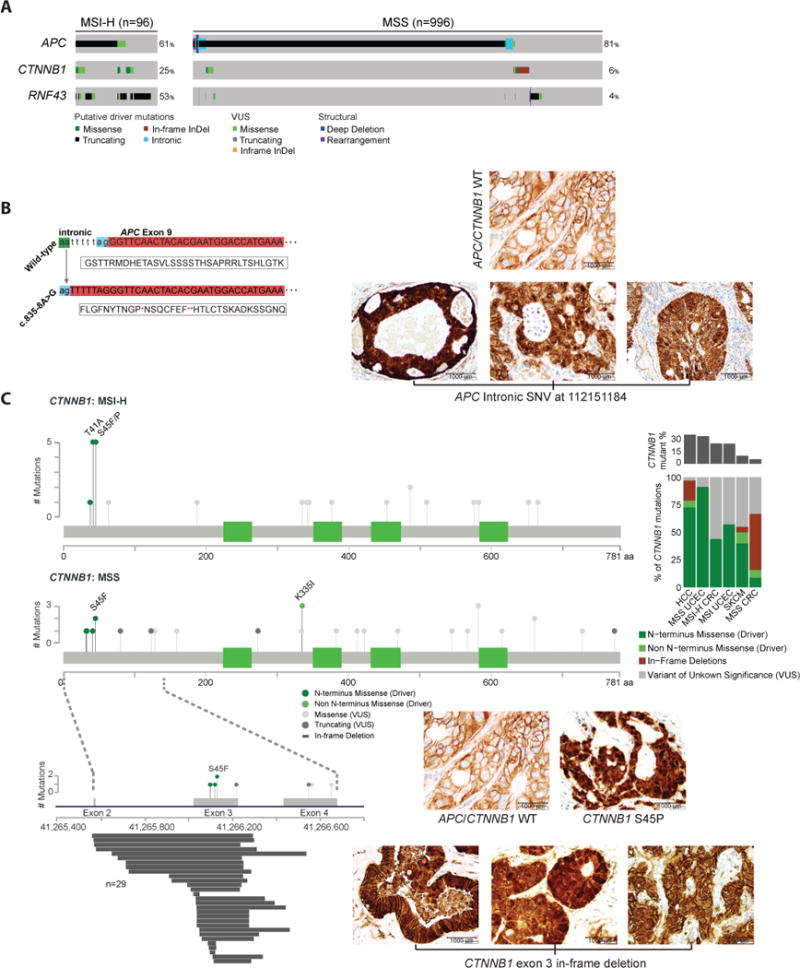
WNT pathway alterations. (A) Alteration frequencies, types of alterations and alteration patterns of genes in the WNT pathway in MSI-H and MSS CRC cases. (B) A mutation in the intron upstream of exon 9 of APC introduces a splice acceptor site, which leads to a change in protein frame (left). Representative images of β-catenin immunohistochemistry in tumors with this APC splice variant (right). (C) Genomic alterations identified in CTNNB1 in MSI-H and MSS CRC cases and representative pictures of β-catenin immunohistochemistry in tumors with the indicated genotypes. Genomic alterations in exons 2–4 in the MSS CRC lollipop plot are shown in detail below, with in-frame deletions identified in CTNNB1 aligned to their start and stop sites. Bar graph shows relative frequency and spectrum of CTNNB1 alterations across tumor types, including hepatocellular carcinoma (HCC), endometrial carcinoma (UCEC), and skin cutaneous melanoma (SKCM). See also Figure S4.
Extending our interrogation of WNT signaling effectors, CTNNB1 mutations were identified in 83 cases (8% total, 24% of MSI-H, 6% of MSS). Twenty of these were previously known activating N-terminal exon 3 hotspot mutations (T41A, S45F, S45P) or mutations in the APC/Axin binding domain (K335I, W383R), and the majority of these occurred in MSI-H tumors (Figure 2C). The most common mutant allele in CTNNB1 in this cohort were not these known hotspot mutations, but a cluster of intragenic in-frame deletions that spanned exon 3, which occurred in 29 cases and were exclusive to MSS tumors. Twenty-six of these resulted in the loss of the entire exon, while three others affecting the region between amino acids 22 and 33. The CTNNB1 in-frame deletions were largely mutually exclusive with APC alterations and other WNT pathway alterations (p<0.001). In cases with these large CTNNB1 exon 3-spanning in-frame deletions, IHC for β-catenin showed nuclear staining of β-catenin, indicating WNT pathway activation in these tumors (Figure 2C). A re-analysis of TCGA CRC cases revealed three tumors harboring long exon 3 deletions in CTNNB1 (<1%). A mutational analysis across 62 cancer types and nearly 10,000 tumors (Zehir et al., 2017) showed that these long CTNNB1 exon 3 deletions were most common in CRC, but short deletions that spanned amino acid 33 were also seen in hepatobiliary cancer (2%) and melanoma (1%) (Figure 2C). These deletions were not found in endometrial cancer, a cancer type in which CTNNB1 mutations are common (Figure S4).
Clinical actionability of genomic alterations
We evaluated how often genomic analysis provides potentially clinically actionable therapeutic information in mCRC and compared the spectrum of targetable genomic alterations by primary tumor site. Using the OncoKB classification system (Chakravarty et al., 2017) (oncokb.org), we stratified genomic alterations by highest level of clinical actionability (Figure 3A). OncoKB assigns levels of actionability to genomic alterations based on evidence for the genomic alteration to serve as a biomarker either in that cancer type or in other cancer types. With the recent approval of pembrolizumab for MSI-H solid tumors, all MSI-H tumors are now considered actionable (Level 1, Figure 3A). The only other Level 1 alteration in CRC is hotspot mutations in KRAS and NRAS, which are Level 1 Resistance markers for anti-EGFR antibodies. Beyond microsatellite instability, potentially actionable alterations were enriched in MSI-H/hypermutated tumors compared with MSS tumors (86% versus 37%, p<0.001), including BRAF V600E (22% versus 5%), BRCA1/BRCA2 alterations (22% versus 1%), and NTRK fusions (8% versus 1%) (Figures 3A, 3B). PIK3CA and PTEN oncogenic mutations were both significantly enriched in MSI-H versus MSS mCRC (41% versus 16%, p<0.01; 35% versus 5%, p<0.01). Forty-six percent of right-sided and 30% of left-sided MSS mCRC harbored potentially targetable oncogenic alterations, and these consisted primarily of BRAF V600E and PIK3CA mutations, both of which are currently considered actionable based on highest level data from other tumor types. Receptor tyrosine kinase (RTK) alterations were infrequent in MSS mCRC, the most common of which were ERBB2 amplifications found in 4% of cases. RTK altered RAS wild-type mCRC predominantly arose from left-sided primaries (7% versus 2% of right-sided primaries).
Figure 3.
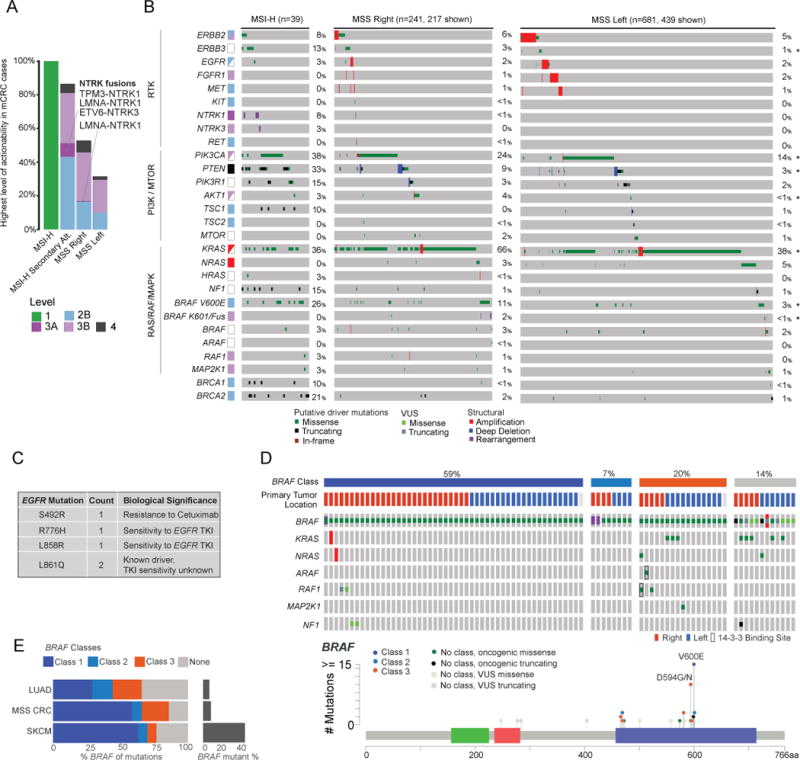
Potentially actionable oncogenic drivers identified by MSK-IMPACT testing. (A) Highest level alterations (alt) for potential clinical actionability in MSI-H and MSS right-sided and left-sided metastatic CRC. (B) Frequency, associated level of actionability, and co-mutation pattern of genomic alterations in mitogenic signaling pathways in metastatic CRC. Star (*) indicates statistically significant difference at p<0.05 level. (C) Frequency and location of oncogenic mutations identified in EGFR. (D) Oncoprint (Top) showing concurrent mutations in the RAS pathway, and lollipop plot (Bottom) showing relative frequency of BRAF mutations in CRC. (E) Bar graphs indicating relative frequency of BRAF mutations and mutation classes in CRC, lung adenocarcinoma (LUAD), and skin cutaneous melanoma (SKCM).
While rare, we identified clinically significant mutations in EGFR as well as several kinase fusions (Figure 3C). Four tumors exhibited hotspot mutations in EGFR (two L861Q, one L858R, one R776H), which may sensitize to EGFR tyrosine kinase inhibitors. One tumor harbored EGFR S492R, a known resistance alteration to cetuximab (Montagut et al., 2012). Review of this patient’s chart confirmed the specimen was collected after cetuximab treatment of one and a half years. Interestingly, this tumor also harbored ERBB2 amplification, another potential mechanism of cetuximab resistance. The only RTK fusions identified in MSS mCRC were LMNA-NTRK1 (1 case) and NCOA4-RET (1 case). Four NTRK fusions were identified in MSI-H cases, including LMNA-NTRK1 (2 cases), TPM3-NTRK1, and ETV6-NTRK3. Two MSS mCRC cases harbored activating BRAF fusions – AGAP3-BRAF and CUL1-BRAF.
Coexistence patterns of targetable alterations are illustrated in Figure 3B. MSS CRCs harbored a range of BRAF alterations, and concurrent RAS pathway alterations varied by type of BRAF alteration (Figure 3D). Wild-type RAF signals as RAS-dependent dimers; BRAF mutants can be classified by their dependence on RAS signaling for activation and ability to signal as a momoner (Yao et al., 2017). Class 1 BRAF mutants consist of V600 substitutions and can signal independent of RAS as monomers or dimers; class 2 BRAF mutants form constitutively activated dimers independent of RAS (Yao et al., 2015); and class 3 BRAF mutants are hypoactive or kinase dead, require RAS activation for signaling, and signal as a dimer, primarily with CRAF as a partner. These class 3 BRAF mutants act to amplify upstream RAS signaling (Yao et al., 2017). All three classes occur in MSS mCRC (Figure 3D) and are important clinically, as class 1 and 2 mutants do not depend on EGFR and are predicted to be insensitive to EGFR inhibition. The signaling of the BRAF mutants also explains their co-mutation pattern with other RAS pathway genes. Class 1 and 2 BRAF mutants are highly activated and do not require upstream activation for signaling, so rarely co-occur with other RAS pathway mutations. Class 3 mutants, in contrast, commonly co-occur with RAS mutations. A large portion of class 3 mutants, however, do not have concurrent genomic alterations in the RAS signaling pathway, and we have recently shown that the low activity mutants in these tumors amplify RTK signaling, primarily EGFR in the colon (Yao et al., 2017). These tumors are thus predicted to be particularly sensitive to EGFR antibodies. Comparison of the spectrum of BRAF alterations in CRC to that in other tumor types with recurrent BRAF mutations showed a higher frequency of class 3 BRAF mutants in the epithelial lineages of lung cancer and CRC compared to melanoma (Figure 3E).
Genomic analysis by primary tumor site
Recent studies suggest that mCRC originating from a primary tumor in the right colon are associated with shorter survival compared to those originating in the left side of the colon or rectum (Holch et al., 2017; Venook, 2017). We assessed overall survival (OS) in MSS mCRC from time of diagnosis of metastasis by primary tumor site (right versus left). We found that the 5-year median OS for patients with right-sided tumors was 45% compared to 67% for patients with left-sided tumors (p<0.001, Figure 4A). Tumor stage at diagnosis, among left-sided MSS mCRC, was 3% stage I, 8% stage II, 22% stage III, and 67% stage IV, and among right-sided MSS mCRC, was 1% stage I, 6% stage II, 20% stage III, and 73% stage IV. Right-sided (MSS) primaries exhibited more complex histologies and were more commonly high-grade as compared to left-sided primaries (Figure S5A). The frequency of only a single site of metastasis at the time of diagnosis of metastatic disease also significantly varied by primary tumor site (66% of right-sided tumors versus 74% of left-sided mCRC) (Figure S5B). The most common sites of first metastasis for the better prognosis left-sided tumors were the liver and lung, two metastatic sites which are potentially curable by resection (Figure 4B). Peritoneal and omental metastases were enriched among right-sided primary tumors and as with the outcome difference we observed above, these metastatic sites are associated with poor survival (Franko et al., 2012).
Figure 4.
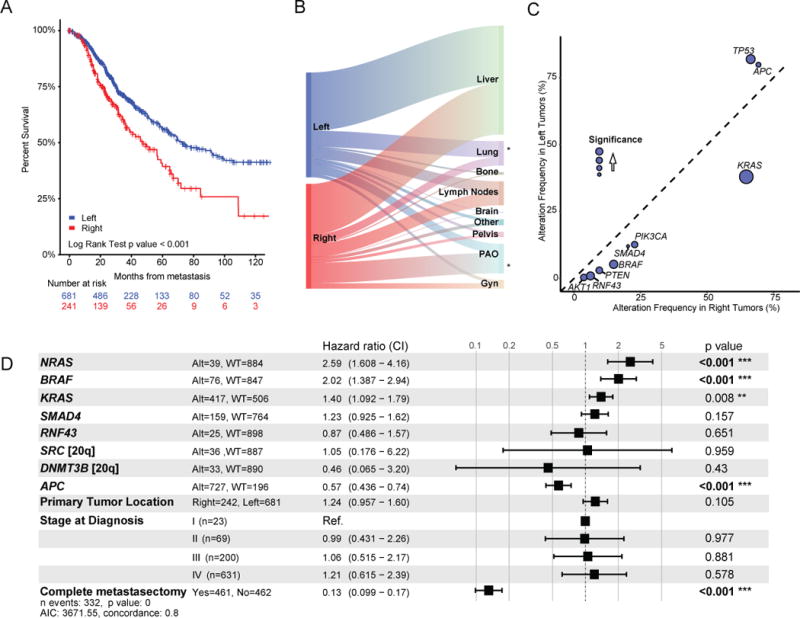
Genomic alterations by primary tumor site. (A) Kaplan-Meier analysis of overall survival (OS) from time of diagnosis of metastatic disease by primary tumor site. (B) Sankey diagram illustrating relative flow of first site of metastasis from left- and right-sided metastatic CRC. (Gyn refers to ovaries, fallopian tubes, uterus, cervix, and vagina; PAO refers to peritoneum, abdominal wall or omentum) (C) Genomic alteration enrichment analysis by primary tumor site. (D) Multivariate model for OS for patients with metastatic MSS CRC. Included in cases that underwent complete metastasectomy are 6 cases with ablation of isolated metastasis and 2 cases with radiation to a single site of metastasis. Square boxes correspond to the hazard ratio (HR) and the ranges indicate the confidence intervals for the HRs. See also Figure S5.
To evaluate whether a genetic basis exists for the difference in survival for disease that originates in the right versus left side of the colon, we analyzed mutation burden and gene alterations by primary tumor site in MSS mCRC. The median mutation burden and median oncogenic mutation burden was significantly higher in MSS tumors with right-sided primaries compared to those with left-sided primaries (7.15 versus 5.92 per MB, p<0.001; 4.11 versus 3.44, p<0.001, respectively). Fewer DNA copy number alterations were seen in right-sided primary tumors than in left-sided primary tumors (0.18 versus 0.21 fraction of genome altered, p=0.001). There was an enrichment of patients older than 50 years in MSS metastatic CRCs with right-sided primaries: in patients younger than 50 years at diagnosis in our series, 19% have right-sided primaries and 81% have left-sided primaries, while in patients 50 years or older at diagnosis, 31% have right-sided primaries and 69% have left-sided primaries (p<0.001). The mutation burden also varied significantly in young patients between right- and left-sided MSS mCRC; median mutation burden in patients < 50 years at diagnosis was 5.1 versus 4.2 for right- versus left-sided primary site (p<0.001). There was a significant enrichment of oncogenic alterations in KRAS, BRAF, PIK3CA, PTEN, AKT1, RNF43, SMAD2, and SMAD4 in right-sided primary tumors and of APC and TP53 in left-sided primary tumors (Figure 4C). Beyond the gene-level associations, an analysis at the level of oncogenic pathways demonstrated that the only pathways differing by primary tumor site consisted of an enrichment of WNT signaling in left-sided primary tumors, and of RAS, phosphatidylinositol 3-kinase (PI3K), and transforming growth factor beta (TGFβ) signaling in right-sided primary tumors (Figures 4C and S5C).
Thirty-seven percent of MSS mCRC originating in the left colon or rectum had no detectable genomic alteration in mitogenic signaling. To evaluate if ligand expression may be activating mitogenic signaling in these tumors, we analyzed levels of ligand expression in TCGA non-hypermutated CRCs. Previous studies indicated increased amphiregulin and epiregulin expression in the left colon (Lee et al., 2016; Missiaglia et al., 2014). We found significantly higher expression of multiple ligands, including amphiregulin, epiregulin, neuregulin, and hepatoctye growth factor, in left-sided primary tumors versus right-sided primary tumors (Figure S5D).
A systematic per gene univariate survival analysis within MSS mCRC of all genes with at least 20 oncogenic alterations in our series comparing wild-type and altered cases showed significant differences in survival associated with mutations in the following genes: APC, BRAF, KRAS, NRAS, RNF43, SMAD4, DNMT3B, and SRC (Figure S5E). Using these genes in a multivariate model correcting for primary tumor location, oncogenic alterations in APC (HR=0.57, p<0.01), BRAF (HR=2.02, p<0.001), KRAS (HR=1.40, p<0.01), and NRAS (HR 2.59, p<0.01) were predictive of survival, whereas primary site was not (HR=1.29, p=0.14) (Figure 4D), suggesting that differences in the complement of somatic alterations largely underlie the differences in survival between patients with mCRC whose primary tumors arose in the left versus right side of the colon.
Genomic classification system for CRC
Based on the genomic heterogeneity of MSS mCRC in our cohort, we sought to classify these tumors into genomic pathway subgroups based on alterations in mitogenic signaling. We identified five subgroups from this analysis, each with differing distribution by primary tumor site. These subgroups consisted of (1) RTK activated alone, (2) RAS-MAPK pathway activated, (3) PI3K pathway activated, (4) concurrent RAS-MAPK/PI3K pathway activation, and (5) no alterations (Figure 5A, Table S4). Over three-quarters of right-sided tumors had RAS-MAPK/PI3K pathway activation, while nearly half of left-sided tumors had no mitogenic pathway alteration or had RTK alterations alone. The genomic pathway subgroups exhibited significantly different outcomes (Figure 5A). Survival was longest for patients whose tumors had either no genomic pathway alteration or only RTK alterations. Survival was shortest for patients whose tumors had RAS pathway alterations. The presence of RAS pathway alterations was significantly associated with multiple sites of first metastases (Figure 5B). These genomically-driven subgroups were also associated with different site(s) of involvement by first metastasis (Figure S6A). Since the most common first site(s) of metastasis varied significantly between right-sided and left-sided primaries, the varied pattern of metastasis by genomic subgroups may underlie this difference in metastatic tropisms by primary site and thus underlie survival differences seen between right-sided and left-sided primaries. Within the genomic subgroups, there were no significant survival differences by tumor primary site (Figure S6B).
Figure 5.
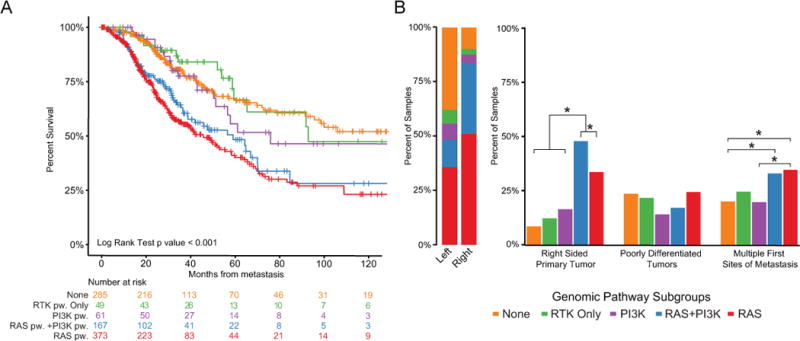
Genomic pathway subgroups and associated outcomes. (A) Kaplan-Meier analysis of overall survival by genomic pathway (pw) subgroups from time of diagnosis of metastatic disease. (B) Bar graphs illustrating relative proportion of genomic subtypes by clinical variables. Star (*) indicates statistically significant difference at p<0.05 level. See also Figure S6 and Table S4.
Discussion
Colorectal cancer is a genomically heterogeneous disease. Here, we report a comprehensive genomic analysis of over 1000 advanced CRCs in the clinical setting. Through the use of a targeted capture assay, MSK-IMPACT, we were able to assess mutations and DNA copy-number alterations, select gene fusions, overall mutation burden, MSI status, and global DNA copy number profiles prospectively in active patients.
Notably, we identified multiple recurrent alterations that impact β-catenin degradation and converge on its nuclear translocation, a key step in CRC pathogenesis. β-catenin degradation is regulated by several phosphorylation steps. First β-catenin undergoes a priming phosphorylation by casein kinase 1α at S45 and subsequently phosphorylation by GSK3β at S33, S37, and T41. Hotspot mutations in β-catenin disrupt these phosphorylation sites, allowing β-catenin to escape recognition by β-TRCP and subsequent degradation (Orford et al., 1997). The recurrent large in-frame deletions we identified here spanning exon 3 eliminate these regulatory phosphorylation sites, preventing β-catenin degradation. These in-frame deletions were previously not reported in CRC, likely due to their unusual size – too large to be detected by some mutation callers and too small to be detected as copy-number alterations. However, our re-analysis of TCGA data showed that these mutations were present in a subset of TCGA CRC samples. While we found short in-frame CTNNB1 exon 3 deletions in other tumor types, these long deletion events are highly enriched in CRC, suggesting differences in the mechanisms of WNT pathway activation in CRC. We also identified a recurrent non-coding mutation adjacent to exon 9 in APC and showed that this mutation introduces a splice acceptor site, which results in a frameshift in the protein. Since this mutation is outside of the canonical splice site region, it was not reported by previous sequencing efforts. We also showed the presence of this mutation in a subset of TCGA CRC samples. In sum, these data suggest that previously occult non-coding mutations significantly expand the spectrum of APC/β-catenin oncogenic genomic alterations in CRC.
We also evaluated the biologic differences between proximal and distal MSS colorectal tumors. We found that tumors originating from the left side of the colon or rectum had more modest mutational burden and simpler histologies. For primary tumors originating in the right side of the colon, nearly all exhibited mutational activation of mitogenic oncogenes compared to less than half of cases with a left-sided primary site. These data suggest that the growth of the simpler left colon histology may rely on the native RTK (predominantly EGFR) signaling rather than mutations to activate mitogenic pathways. We speculate that there may be less native RTK signaling in the right side of the colon, perhaps due to its distinct ontogenesis as right-sided tumors derive from the embryonic midgut and left-sided tumors derive from the embryonic hindgut. Thus there may be a selective pressure for more mutations, which leads to more complicated histologies in tumors that arise in the right colon (Shia et al., 2017). Consistent with this hypothesis, we and others have found significantly increased expression of multiple ligands for RTKs in the left colon compared to the right colon (Lee et al., 2017). These data provide a potential explanation for the differing response to EGFR inhibitors by primary tumor site and suggest that selective inhibitors of other RTKs, such ERBB2, may exhibit higher efficacy in left-sided tumors.
Epidemiologic data suggest an increase in CRC incidence among adults younger than 50 years old, driven solely by tumors in the distal colon and rectum (Siegel et al., 2017b). In our series, we find a relatively higher incidence of left-sided MSS mCRC among younger patients. Our data provides a potential explanation for the differing incidence by primary site. We find that right-sided colon tumors harbor many mutations, including an enrichment of alterations affecting RAS-MAPK, PI3K, and TGFβ signaling pathways; the development of cumulative genomic alterations would be expected to take time, providing an explanation for the observation that right-sided tumors, including MSS tumors, are more common in older patients and have not increased in younger patients. In contrast, we find that transcriptional up-regulation of ligands that activate receptor tyrosine kinases likely plays a pathogenic role in left-sided CRC. Changes in environmental exposures, possibly affecting intestinal microbiota (Flemer et al., 2017), could thus have a greater impact on cancer development in the distal colon and rectum.
Our data suggest that the survival differences seen between patients having right- and those having left-sided primary tumor sites in mCRC are largely driven by genomic differences. The differing frequencies of oncogenic alterations in four genes - APC, KRAS, NRAS, and BRAF - were independent predictors of survival by primary site in multivariate analysis. In our model, we considered APC oncogenic alterations as a single group, but further analysis with larger datasets may be able to refine the positive prognostic effect of APC alterations, as recent data suggest that the number of APC alterations also impacts survival (Schell et al., 2016). Genomic subtypes, which varied by primary tumor site, were also associated with different patterns of metastatic spread and number of metastatic sites at time of diagnosis of metastases. Our series thus links genomic subtypes and metastatic patterns to help explain survival differences by primary tumor sites.
Other series have looked at patterns of metastatic spread by primary tumor site or by single genes of interest. A recent large autopsy study of more than 5000 cases looking at metastatic patterns and correlating metastatic sites with primary tumor site found, similarly to our study, a higher rate of liver and lung metastases with left-sided primary tumors and a higher rate of peritoneal metastases and metastases to other sites with right-sided primary tumors (Hugen and Nagtegaal, 2017). BRAF mutations have been associated with increased peritoneal disease and ascites and KRAS mutations have been associated with increased ovarian metastases, both genotypes enriched in right-sided primary tumors (Yaeger et al., 2014).
In conclusion, our analysis of a large series of advanced CRCs in the clinical setting refined the landscape of genomic alterations, revealed the frequency of potentially actionable alterations in patients with mCRC, and provided a plausible biologic explanation for clinical differences seen by primary tumor site. Our dataset of matched tumor and normal DNA sequenced from advanced CRC patients with associated pathological and clinical data will provide a resource for further studies of the biology of CRC. To facilitate such studies, we have made the full dataset publicly available through the cBioPortal for Cancer Genomics (http://www.cbioportal.org/study?id=crc_msk_2017) (Cerami et al., 2012).
STAR Methods
Contact for Reagent and Resource Sharing
Further information and requests for resources and reagents should be directed to and will be fulfilled by the Lead Contact, Nikolaus Schultz (schultzn@mskcc.org).
Experimental Model and Subject Details
We analyzed all colorectal adenocarcinomas sequenced using the MSK-IMPACT assay in the clinical laboratories of the Molecular Diagnostics Service at Memorial Sloan Kettering Cancer Center (MSKCC) from April 2014 to September 2016. A total of 1134 clinical specimen from 1099 patients were analyzed. A full description of the samples included is provided in Table S1, and patient characteristics are summarized in Table 1. Cases consisted largely of tumors from mCRC patients submitted for KRAS, NRAS, and BRAF genotyping to guide anti-EGFR antibody treatment. Sequencing was also performed on mCRC in surveillance without active disease as part of a research study (IRB #16-1343) and in some patients with early stage CRC to define BRAF status in mismatch repair deficient tumors or for research studies of early stage CRC (IRB #15-044). All patients signed a clinical consent or a research consent form (IRB #12-245) for genomic analysis of their tumors. This study was reviewed and approved by the MSK Institutional Review Board/Privacy Board which granted a waiver of documentation of consent (IRB retrospective research protocol 16–261). All tumors were reviewed by an expert gastrointestinal pathologist to confirm colorectal adenocarcinoma.
The electronic medical record was reviewed to collect information on patient sex, date of birth, date of diagnosis, stage, primary tumor location, primary tumor histology, date of diagnosis of metastatic disease (where applicable), first site(s) of metastases, date of complete metastasectomy (where applicable), last date of follow-up or date of death, and vital status. Date of diagnosis was defined by first pathologic diagnosis (e.g., biopsy at time of colonoscopy). Patients were considered to have metastatic disease at diagnosis if metastases were documented on initial staging or if metastases were found intraoperatively or within 6 months of date of CRC diagnosis. For rectal cancers, tumors treated with upfront surgery were staged pathologically, and tumors treated with neoadjuvant therapy (i.e., locally advanced tumors) were staged clinically based on either rectal MRI or transrectal ultrasound. Primary tumor site was designated as right-sided for tumors from the cecum up to the distal transverse colon, and left-sided for tumors from the distal transverse colon/splenic flexure (inclusive) to the rectum. Date of diagnosis of metastasis was the date of first radiographic evidence of metastasis.
Method Details
Genomic analysis
Sequencing was performed with MSK-IMPACT, a hybridization capture-based next-generation sequencing assay (Cheng et al., 2015). Genomic DNA from formalin-fixed paraffin-embedded (FFPE) primary or metastatic colorectal tumors and patient-matched normal blood samples were extracted using the Qiagen DNeasy Tissue kit and the EZ1 Advanced XL system (Qiagen, Valencia, CA), respectively. Extracted DNA was sheared using the Covaris E200 instrument (Covaris, Woburn, MA). Custom DNA probes were designed for targeted sequencing of all exons and selected introns of 341, 410, or 468 genes (as the assay was expanded during the study period) in 214, 911, and 9 cases, respectively (Figure S1, Table S2). Probes were synthesized using the NimbleGen SeqCap EZ library custom oligo system and were biotinylated to allow for sequence enrichment by capture using streptavidin-conjugated beads. Sequencing libraries were prepared using the KAPA HTP protocol (Kapa Biosystems, Wilmington, MA) and the Biomek FX system (Beckman Coulter, Brea, CA). Pooled libraries containing captured DNA fragments were sequenced using the Illumina HiSeq 2500 to high, uniform coverage (>500× median coverage). All classes of genomic alterations including substitution, indels, copy number alteration, and rearrangement were determined and called against the patient’s matched normal sample. Samples with no mutations or copy number alterations in the setting of low tumor purity (n=18) were deemed to have insufficient tumor content and removed from the dataset. Testing was performed in a CLIA-certified clinical laboratory.
Digital droplet PCR
Using the RNeasy FFPE kit (Qiagen) and mineral oil de-paraffins methods, RNA was extracted from cases with exon 9 APC intronic alterations. Digital Droplet PCR assay to detect APC_Exon9_Splicing was designed using Prime3Plus and ordered through Biorad: forward primer 5′AGAAATCAACATGGCAACT 3′; Reverse primer: 5′ACTAGAACTCAAAACACTGG 3′; wild-type (WT) probe: 5′TAATGGTCAGGGTTCAACTAC 3′-HEX_IowaBlack; mutation specific probe: 5′TGGTCAGTTTTTAGGGTTCA 3′-FAM_IowaBlack. Cycling conditions were tested to ensure optimal annealing/extension temperature as well as optimal separation of positive from empty droplets. All reactions were performed on a QX200 ddPCR system (Biorad). Each sample was evaluated in technical duplicates. PCR reactions contained APC_Exon9_Splicing gene specific primers and probes, APC_Exon9_WT gene specific primers and probes, BioRad validated gene expression control primers and probes (B2M) and RNA from FFPE samples using One-Step RT-ddPCR Advanced kit for probes. Reactions were partitioned into a median of ~15,000 droplets per well using the QX200 droplet generator. Emulsified reactions were amplified on a 96-well thermal cycler using cycling conditions identified during the optimization step (42°C 60′; 95°C 10′;40 cycles of 95°C 30″ 60°C 1′; 98°C 10′, 4°C h old). Plates were read and analyzed with the QuantaSoft sotware to assess the number of droplets positive for APC_Exon9_Splicing gene/wild-type APC gene or Control B2M gene, both, or neither.
Immunohistochemistry (IHC)
Four-micrometer-thick sections were cut from FFPE tumor blocks for IHC. IHC for β-catenin was performed on a BenchMark XT automated immunostainer (Ventana Medical Systems Inc., Tucson, AZ). Sections were incubated with anti-β-catenin antibody (Cell Marque, catalog #760-4242) at a concentration of 1.73 ug/mL. Antigen retrieval was performed with Cell Conditioning Solution (CC1, Ventana Medical Systems Inc.) for 24 hours, and primary antibody incubation was for 24 hours. Antigen detection was performed using the Optiview DAB Detection kit (Ventana Medical Systems Inc.). For analysis of mismatch repair protein expression, primary monoclonal antibodies against MLH1 (clone G168-728, diluted 1:250, BD PharMingen, San Diego, CA), MSH2 (clone FE11, diluted 1:50, Oncogene Research Products, La Jolla, CA), MSH6 (clone 44, ready to use, Ventana Medical Systems Inc.), and PMS2 (clone A16-4, diluted 1:200, BD PharMingen) were used. Non-neoplastic colonic mucosa and colorectal tumors known to be deficient of MLH1, MSH2, MSH6, and PMS2 were used as external positive and negative controls, respectively. Retained expression of each protein was defined by nuclear IHC reactivity of tumor cells, whereas loss of expression for each protein was defined by the total absence of nuclear staining.
Quantification and Statistical Analysis
Mutation Burden and MSI analysis
Mutation burden per sample was calculated as the total number of nonsynonymous mutations divided by the actual number of bases analyzed. MSIsensor scores were calculated for all cases (Niu et al., 2014) and represent the percentage of unstable microsatellites of all tested microsatellites. MSIsensor interrogates the aligned sequencing data for available microsatellite regions with sufficient coverage in a tumor/normal pair where it identifies deletion length variation. χ2 test is used to identify the significantly varied loci, and the percentage of unstable loci, after multiple testing correction on the p values, is reported as a MSIsensor score. Tumors with values ≥10 were defined as microsatellite instability-high (MSI-H) status (Hechtman et al., 2017; Middha et al., 2017). In our series there was a 98.6% concordance rate between MSIsensor score and mismatch repair (MMR) IHC; 795 of 806 samples with MMR IHC were concordant for MSI status by MMR IHC and the MSIsensor algorithm.
Mutational Significance Analysis
Significantly recurrently mutated genes (SMGs) were identified for the microsatellite stable (MSS) cohort using four different tests: MutSigCV 1.4 (Lawrence et al., 2013) and MuSic (Dees et al., 2012) algorithms, as well as binomial distribution tests for tumor suppressor and for hotspot enrichment. Genes with q values <0.1 from MutSig and MuSic (2 out of 3 tests) were considered to be significantly recurrently mutated. The tumor suppressor enrichment analysis was used to determine if any genes had a significant fraction of truncating variants (Nonsense Mutations, Nonstop Mutations, Frameshift Insertion/Deletions, and Splice Site Mutations). Hotspot enrichment analysis (Chang et al., 2016) was used to identify genes that had a significant fraction of hotspot mutations. Multiple hypothesis test correction for both the tumor suppressor and hotspot enrichment tests was performed utilizing the Benjamini-Hochberg method, and genes with q values <0.1 were considered to be significantly recurrently mutated. Furthermore, genes that displayed low expression within CRC (median expression below bottom quartile of TCGA CRC RNAseq (Cancer Genome Atlas Network, 2012)) were noted.
Comparison of genomic alterations
Genomic alterations were filtered for oncogenic variants using OncoKB (Chakravarty et al., 2017), a precision oncology knowledgebase that tracks the effects of cancer variants and their potential clinical actionability (http://oncokb.org). Two-sided Fisher’s exact test was performed to compare the frequency of oncogenic alterations. Multiple hypothesis correction was performed using the Benjamini-Hochberg method.
Survival Analysis
Overall survival (OS) was examined from date of metastatic disease to date of death or last available follow-up. Kaplan-Meier survival curves were generated and compared using the log-rank test.
Supplementary Material
Table S1, related to Table 1. Full clinical dataset.
Table S2, related to Figure 1. Genes included on MSK-IMPACT platform.
Table S3, related to Figure 1. List of all somatic mutations.
Table S4, related to Figure 5. Genes included in the molecular pathway subgroups.
Significance.
We present an integrative genomics analysis of metastatic colorectal cancer (mCRC) in the clinical setting. Alterations in non-coding regions in APC and in-frame deletions in CTNNB1 highlight the near universal activation of the WNT pathway in mCRC and extend functional alterations in this pathway. Genetic differences we identified between right and left primary site may underlie recent reports of different clinical behavior. Our observations suggest that left-sided tumors rely on native receptor tyrosine kinase signaling and thus are more susceptible to environmental changes, such as intestinal microbiota. Our results provide mechanistic insight into the differential sensitivity of right- and left-sided CRC to targeted agents and the isolated increased incidence of young-onset colorectal cancer in the left colon and rectum.
Highlights.
Prospective targeted sequencing of 1134 colorectal cancers in the clinical setting
Few genomic differences between primaries and metastases
Identified CTNNB1 in-frame deletions enriched in microsatellite stable cases
Differences in APC, BRAF, KRAS and NRAS predict varied survival by tumor laterality
Yaeger et al. perform prospective sequencing of metastatic colorectal cancers (mCRC). Right-sided primary microsatellite stable mCRC are associated with increased oncogenic mutations whereas most left-sided tumors lack identifiable genetic mitogenic signaling alterations but highly express mitogenic ligands.
Acknowledgments
We gratefully acknowledge the members of the Molecular Diagnostics Service in the Department of Pathology. This study was supported by the Marie-Josée and Henry R. Kravis Center for Molecular Oncology, NCI Cancer Center Core Grant (P30-CA008748), the Robertson Foundation (N.S.), and by a Stand Up To Cancer Colorectal Cancer Dream Team Translational Research Grant (Grant Number: SU2C-AACR-DT22-17). Stand Up to Cancer is a program of the Entertainment Industry Foundation. Research grants are administered by the American Association for Cancer Research, the Scientific Partner of SU2C.
Footnotes
Publisher's Disclaimer: This is a PDF file of an unedited manuscript that has been accepted for publication. As a service to our customers we are providing this early version of the manuscript. The manuscript will undergo copyediting, typesetting, and review of the resulting proof before it is published in its final citable form. Please note that during the production process errors may be discovered which could affect the content, and all legal disclaimers that apply to the journal pertain.
Author Contributions
R.Y., W.K.C., M.D.L, F.S.V., D.B.S., and N.S. designed the study. R.Y., W.K.C., M.D.L., J.F.H, A.C., F.S.V., G.J., S.M., A.Z., M.T.A.D., D.Y., A.V., N.K., N.H.S., Z.K.S., A.M.V., R.K., A.S., D.M.H., E.V., M.L., M.F.B., J.S., L.S., and N.S. generated and collected the data. R.Y., W.K.C., M.D.L., J.F.H., A.C., F.S.V., G.J., S.M., A.Z., M.T.A.D., D.Y., A.V., Z.K.S., J.G., A.S., N.R., B.S.T., M.L., M.F.B., D.B.S., J.S., and L.S. analyzed and interpreted the data. All authors participated in the drafting or reviewing of the manuscript, and all authors approved the submitted manuscript.
Data and Software Availability
Our full dataset is publicly available through the cBioPortal for Cancer Genomics (http://www.cbioportal.org/study?id=crc_msk_2017) and is also deposited in the European Variation Archive (https://www.ebi.ac.uk/eva/) accession #PRJEB23844.
References
- Alexandrov LB, Nik-Zainal S, Wedge DC, Aparicio SAJR, Behjati S, Biankin AV, Bignell GR, Bolli N, Borg A, Børresen-Dale AL, et al. Signatures of mutational processes in human cancer. Nature. 2013;500:415–421. doi: 10.1038/nature12477. [DOI] [PMC free article] [PubMed] [Google Scholar]
- The Cancer Genome Atlas Network. Comprehensive molecular characterization of human colon and rectal cancer. Nature. 2012;487:330–337. doi: 10.1038/nature11252. [DOI] [PMC free article] [PubMed] [Google Scholar]
- Cerami E, Gao J, Dogrusoz U, Gross BE, Sumer SO, Aksoy BA, Jacobsen A, Byrne CJ, Heuer ML, Larsson E, et al. The cBio cancer genomics portal: an open platform for exploring multidimensional cancer genomics data. Cancer Discovery. 2012;2:401–404. doi: 10.1158/2159-8290.CD-12-0095. [DOI] [PMC free article] [PubMed] [Google Scholar]
- Chakravarty D, Gao J, Phillips SM, Kundra R, Zhang H, Wang J, Rudolph JE, Yaeger R, Soumerai T, Nissan MH, et al. OncoKB: A Precision Oncology Knowledge Base. JCO Precision Oncology 2017. 2017 doi: 10.1200/PO.17.00011. [DOI] [PMC free article] [PubMed] [Google Scholar]
- Chang MT, Asthana S, Gao SP, Lee BH, Chapman JS, Kandoth C, Gao J, Socci ND, Solit DB, Olshen AB, et al. Identifying recurrent mutations in cancer reveals widespread lineage diversity and mutational specificity. Nat Biotechnol. 2016;34:155–163. doi: 10.1038/nbt.3391. [DOI] [PMC free article] [PubMed] [Google Scholar]
- Cheng DT, Mitchell TN, Zehir A, Shah RH, Benayed R, Syed A, Chandramohan R, Liu ZY, Won HH, Scott SN, et al. Memorial Sloan Kettering-Integrated Mutation Profiling of Actionable Cancer Targets (MSK-IMPACT): A Hybridization Capture-Based Next-Generation Sequencing Clinical Assay for Solid Tumor Molecular Oncology. The Journal of Molecular Diagnostics: JMD. 2015;17:251–264. doi: 10.1016/j.jmoldx.2014.12.006. [DOI] [PMC free article] [PubMed] [Google Scholar]
- Church DN, Briggs SEW, Palles C, Domingo E, Kearsey SJ, Grimes JM, Gorman M, Martin L, Howarth KM, Hodgson SV, et al. DNA polymerase ε and δ exonuclease domain mutations in endometrial cancer. Human Molecular Genetics. 2013;22:2820–2828. doi: 10.1093/hmg/ddt131. [DOI] [PMC free article] [PubMed] [Google Scholar]
- Dees ND, Zhang Q, Kandoth C, Wendl MC, Schierding W, Koboldt DC, Mooney TB, Callaway MB, Dooling D, Mardis ER, et al. MuSiC: identifying mutational significance in cancer genomes. Genome Research. 2012;22:1589–1598. doi: 10.1101/gr.134635.111. [DOI] [PMC free article] [PubMed] [Google Scholar]
- Domingo E, Freeman-Mills L, Rayner E, Glaire M, Briggs S, Vermeulen L, Fessler E, Medema JP, Boot A, Morreau H, et al. Somatic POLE proofreading domain mutation, immune response, and prognosis in colorectal cancer: a retrospective, pooled biomarker study. The Lancet Gastroenterology & Hepatology. 2016;1:207–216. doi: 10.1016/S2468-1253(16)30014-0. [DOI] [PubMed] [Google Scholar]
- Donehower LA, Creighton CJ, Schultz N, Shinbrot E, Chang K, Gunaratne PH, Muzny D, Sander C, Hamilton SR, Gibbs RA, et al. MLH1-silenced and non-silenced subgroups of hypermutated colorectal carcinomas have distinct mutational landscapes. The Journal of Pathology. 2013;229:99–110. doi: 10.1002/path.4087. [DOI] [PMC free article] [PubMed] [Google Scholar]
- Fearon ER, Vogelstein B. A genetic model for colorectal tumorigenesis. Cell. 1990;61:759–767. doi: 10.1016/0092-8674(90)90186-i. [DOI] [PubMed] [Google Scholar]
- Flemer B, Lynch DB, Brown JMR, Jeffery IB, Ryan FJ, Claesson MJ, O’Riordain M, Shanahan F, O’Toole PW. Tumour-associated and non-tumour-associated microbiota in colorectal cancer. Gut. 2017;66:633–643. doi: 10.1136/gutjnl-2015-309595. [DOI] [PMC free article] [PubMed] [Google Scholar]
- Franko J, Shi Q, Goldman CD, Pockaj BA, Nelson GD, Goldberg RM, Pitot HC, Grothey A, Alberts SR, Sargent DJ. Treatment of colorectal peritoneal carcinomatosis with systemic chemotherapy: a pooled analysis of north central cancer treatment group phase III trials N9741 and N9841. Journal of Clinical Oncology: Official Journal of the American Society of Clinical Oncology. 2012;30:263–267. doi: 10.1200/JCO.2011.37.1039. [DOI] [PMC free article] [PubMed] [Google Scholar]
- Giannakis M, Mu XJ, Shukla SA, Qian ZR, Cohen O, Nishihara R, Bahl S, Cao Y, Amin-Mansour A, Yamauchi M, et al. Genomic Correlates of Immune-Cell Infiltrates in Colorectal Carcinoma. Cell Reports. 2016 doi: 10.1016/j.celrep.2016.03.075. [DOI] [PMC free article] [PubMed] [Google Scholar]
- Haan JC, Labots M, Rausch C, Koopman M, Tol J, Mekenkamp LJM, van de Wiel MA, Israeli D, van Essen HF, van Grieken NCT, et al. Genomic landscape of metastatic colorectal cancer. Nature Communications. 2014;5:5457. doi: 10.1038/ncomms6457. [DOI] [PMC free article] [PubMed] [Google Scholar]
- Hechtman JF, Middha S, Stadler ZK, Zehir A, Berger MF, Vakiani E, Weiser MR, Ladanyi M, Saltz LB, Klimstra DS, et al. Universal screening for microsatellite instability in colorectal cancer in the clinical genomics era: new recommendations, methods, and considerations. Familial Cancer. 2017 doi: 10.1007/s10689-017-9993-x. [DOI] [PubMed] [Google Scholar]
- Holch JW, Ricard I, Stintzing S, Modest DP, Heinemann V. The relevance of primary tumour location in patients with metastatic colorectal cancer: A meta-analysis of first-line clinical trials. European Journal of Cancer (Oxford, England: 1990) 2017;70:87–98. doi: 10.1016/j.ejca.2016.10.007. [DOI] [PubMed] [Google Scholar]
- Hugen N, Nagtegaal ID. Distinct metastatic patterns in colorectal cancer patients based on primary tumour location. European Journal of Cancer (Oxford, England: 1990) 2017;75:3–4. doi: 10.1016/j.ejca.2017.01.003. [DOI] [PubMed] [Google Scholar]
- Lawrence MS, Stojanov P, Polak P, Kryukov GV, Cibulskis K, Sivachenko A, Carter SL, Stewart C, Mermel CH, Roberts SA, et al. Mutational heterogeneity in cancer and the search for new cancer-associated genes. Nature. 2013;499:214–218. doi: 10.1038/nature12213. [DOI] [PMC free article] [PubMed] [Google Scholar]
- Lee MS, McGuffey EJ, Morris JS, Manyam G, Baladandayuthapani V, Wei W, Morris VK, Overman MJ, Maru DM, Jiang ZQ, et al. Association of CpG island methylator phenotype and EREG/AREG methylation and expression in colorectal cancer. British Journal of Cancer. 2016;114:1352–1361. doi: 10.1038/bjc.2016.87. [DOI] [PMC free article] [PubMed] [Google Scholar]
- Lee MS, Menter DG, Kopetz S. Right Versus Left Colon Cancer Biology: Integrating the Consensus Molecular Subtypes. Journal of the National Comprehensive Cancer Network: JNCCN. 2017;15:411–419. doi: 10.6004/jnccn.2017.0038. [DOI] [PubMed] [Google Scholar]
- Middha S, Zhang L, Nafa K, Jayakumaran G, Wong D, Kim HR, Sadowska J, Berger MF, Delair DF, Shia J, et al. Reliable Pan-Cancer Microsatellite Instability Assessment by Using Targeted Next-Generation Sequencing Data. JCO Precision Oncology. 2017 doi: 10.1200/PO.17.00084. [DOI] [PMC free article] [PubMed] [Google Scholar]
- Missiaglia E, Jacobs B, D’Ario G, Di Narzo AF, Soneson C, Budinska E, Popovici V, Vecchione L, Gerster S, Yan P, et al. Distal and proximal colon cancers differ in terms of molecular, pathological, and clinical features. Annals of Oncology: Official Journal of the European Society for Medical Oncology. 2014;25:1995–2001. doi: 10.1093/annonc/mdu275. [DOI] [PubMed] [Google Scholar]
- Montagut C, Dalmases A, Bellosillo B, Crespo M, Pairet S, Iglesias M, Salido M, Gallen M, Marsters S, Tsai SP, et al. Identification of a mutation in the extracellular domain of the Epidermal Growth Factor Receptor conferring cetuximab resistance in colorectal cancer. Nature Medicine. 2012;18:221–223. doi: 10.1038/nm.2609. [DOI] [PubMed] [Google Scholar]
- Niu B, Ye K, Zhang Q, Lu C, Xie M, McLellan MD, Wendl MC, Ding L. MSIsensor: microsatellite instability detection using paired tumor-normal sequence data. Bioinformatics (Oxford, England) 2014;30:1015–1016. doi: 10.1093/bioinformatics/btt755. [DOI] [PMC free article] [PubMed] [Google Scholar]
- Orford K, Crockett C, Jensen JP, Weissman AM, Byers SW. Serine phosphorylation-regulated ubiquitination and degradation of beta-catenin. The Journal of Biological Chemistry. 1997;272:24735–24738. doi: 10.1074/jbc.272.40.24735. [DOI] [PubMed] [Google Scholar]
- Schell MJ, Yang M, Teer JK, Lo FY, Madan A, Coppola D, Monteiro ANA, Nebozhyn MV, Yue B, Loboda A, et al. A multigene mutation classification of 468 colorectal cancers reveals a prognostic role for APC. Nature Communications. 2016;7:11743. doi: 10.1038/ncomms11743. [DOI] [PMC free article] [PubMed] [Google Scholar]
- Shia J, Schultz N, Kuk D, Vakiani E, Middha S, Segal NH, Hechtman JF, Berger MF, Stadler ZK, Weiser MR, et al. Morphological characterization of colorectal cancers in The Cancer Genome Atlas reveals distinct morphology-molecular associations: clinical and biological implications. Modern Pathology: An Official Journal of the United States and Canadian Academy of Pathology, Inc. 2017;30:599–609. doi: 10.1038/modpathol.2016.198. [DOI] [PMC free article] [PubMed] [Google Scholar]
- Siegel RL, Miller KD, Jemal A. Cancer Statistics, 2017. CA: A Cancer Journal for Clinicians. 2017a;67:7–30. doi: 10.3322/caac.21387. [DOI] [PubMed] [Google Scholar]
- Siegel RL, Fedewa SA, Anderson WF, Miller KD, Ma J, Rosenberg PS, Jemal A. Colorectal Cancer Incidence Patterns in the United States, 1974–2013. Journal of the National Cancer Institute 109. 2017b doi: 10.1093/jnci/djw322. [DOI] [PMC free article] [PubMed] [Google Scholar]
- Venook AP. Right-sided vs left-sided colorectal cancer. Clinical Advances in Hematology & Oncology: H&O. 2017;15:22–24. [PubMed] [Google Scholar]
- Yaeger R, Cercek A, Chou JF, Sylvester BE, Kemeny NE, Hechtman JF, Ladanyi M, Rosen N, Weiser MR, Capanu M, et al. BRAF mutation predicts for poor outcomes after metastasectomy in patients with metastatic colorectal cancer. Cancer. 2014;120:2316–2324. doi: 10.1002/cncr.28729. [DOI] [PMC free article] [PubMed] [Google Scholar]
- Yao Z, Torres NM, Tao A, Gao Y, Luo L, Li Q, de Stanchina E, Abdel-Wahab O, Solit DB, Poulikakos PI, et al. BRAF Mutants Evade ERK-Dependent Feedback by Different Mechanisms that Determine Their Sensitivity to Pharmacologic Inhibition. Cancer Cell. 2015;28:370–383. doi: 10.1016/j.ccell.2015.08.001. [DOI] [PMC free article] [PubMed] [Google Scholar]
- Yao Z, Yaeger R, Rodrik-Outmezguine VS, Tao A, Torres NM, Chang MT, Drosten M, Zhao H, Cecchi F, Hembrough T, et al. Tumours with class 3 BRAF mutants are sensitive to the inhibition of activated RAS. Nature. 2017;548:234–238. doi: 10.1038/nature23291. [DOI] [PMC free article] [PubMed] [Google Scholar]
- Zehir A, Benayed R, Shah RH, Syed A, Middha S, Kim HR, Srinivasan P, Gao J, Chakravarty D, Devlin SM, et al. Mutational landscape of metastatic cancer revealed from prospective clinical sequencing of 10,000 patients. Nature Medicine. 2017;23:703–713. doi: 10.1038/nm.4333. [DOI] [PMC free article] [PubMed] [Google Scholar]
Associated Data
This section collects any data citations, data availability statements, or supplementary materials included in this article.
Supplementary Materials
Table S1, related to Table 1. Full clinical dataset.
Table S2, related to Figure 1. Genes included on MSK-IMPACT platform.
Table S3, related to Figure 1. List of all somatic mutations.
Table S4, related to Figure 5. Genes included in the molecular pathway subgroups.