Abstract
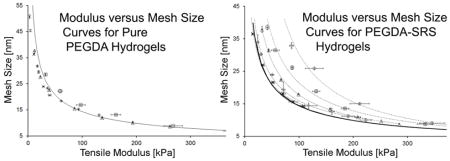
Poly(ethylene glycol) diacrylate (PEGDA) hydrogels are widely used in biotechnology due to their in situ crosslinking capacity and tunable physical properties. However, as with all single component hydrogels, the modulus of PEGDA networks cannot be tailored independently of mesh size. This interdependence places significant limitations on their use for defined, 3D cell-microenvironment studies and for certain controlled release applications. The incorporation of secondary reactive species (SRS) into PEGDA hydrogels has previously been shown to allow the identification of up to 6 PEGDA hydrogel formulations for which distinct moduli can be obtained at consistent average mesh size (or vice versa). However, the modulus and mesh size ranges which can be probed by these formulations are quite restricted. This work presents an in-depth study of SRS incorporation into PEGDA hydrogels, with the goal of expanding the space for which “decoupled” examination of modulus and mesh size effects is achievable. Towards this end, over 100 PEGDA hydrogels containing either N-vinyl pyrrolidone or star PEG-tetraacrylate as SRS were characterized. To our knowledge, this is the first study to demonstrate that SRS incorporation allows for the identification of a number of modulus ranges that can be probed at consistent average mesh size (or vice versa).
Keywords: poly(ethylene glycol) hydrogels, PEGDA, mesh size, modulus, decoupling
Graphical Abstract
1. INTRODUCTION
Hydrogels prepared from linear poly(ethylene glycol) diacrylate (PEGDA) are widely used in biotechnology due to their ability to be formed in situ as well as several of their unique physical properties.1–5 For instance, PEGDA hydrogels function as biological “blank slates” in that they intrinsically resist bioactive protein adsorption.6–8 This property of PEGDA hydrogels is significant, as most synthetic and natural biomaterial scaffolds adsorb a wide range of serum proteins both in vitro and in vivo. Such adsorbed proteins are often major determinants of cell behavior, in addition to bioactive moieties deliberately conjugated to the material.9–10 In contrast, the relatively inert nature of PEGDA hydrogels permits the controlled and defined investigation of biochemical cues on cell behavior. For controlled release applications, this “anti-fouling” property of PEGDA endows PEGDA hydrogel carriers with “stealth” properties.11 Similarly, PEGDA hydrogels are attractive materials for studying cell response to mechanical cues because their moduli can be tailored by varying PEGDA molecular weight (Mn) and precursor solution concentration.7, 12–13 Moreover, PEGDA hydrogels are frequently used in controlled release applications due in part to the ability to modify their nanoscale mesh structure by simple formulation strategies.14
Despite these advantages, a major limitation of pure PEGDA hydrogels, and indeed all single-component hydrogel networks, is that their modulus and average mesh size cannot be varied independently.15 For example, hydrogel modulus can be decreased by reducing the concentration of PEGDA in the hydrogel precursor solution.16–17 However, this decrease is associated with a simultaneous increase in average mesh size due to an overall decrease in the number of crosslinks between polymer chains. Similarly, modulus can be increased by decreasing PEGDA Mn, but this approach results in a concurrent decrease in the mesh size of the resulting hydrogels.12–13 Thus, if the moduli of hydrogels of varying PEGDA Mn and PEGDA concentration were plotted against their corresponding average mesh sizes, the achievable properties would be constrained to a single curve within the modulus-mesh size plane.14 This modulus-mesh size interdependence significantly limits the utility of in situ crosslinked polymer networks in the investigation of the specific effects of modulus on cell behavior within 3D environments.18 This is because the decrease in mesh size that accompanies an increase in hydrogel modulus also impacts the behavior of encapsulated cells via the modification of nutrient and waste exchange within the hydrogel.13, 19–21 In terms of controlled release, the ability to tune PEGDA hydrogel mesh structure without disrupting the modulus or strength of the carrier would similarly be desirable.
Several research groups have incorporated secondary reactive species (SRS) into PEGDA hydrogel networks in an effort to partially “decouple” the dependence between PEGDA hydrogel modulus and average mesh size.18, 21–24, 27–28 To be effective in our applications of interest, it is critical that the incorporated SRS preserve the biological “blank slate” character of pure PEGDA hydrogels. Thus, we will focus on SRS that are known to preserve this “anti-fouling” property of PEGDA hydrogels.25–29 For instance, N-vinyl pyrrolidone (NVP) has recently been recognized not only as an accelerating agent,27–28 but also as an SRS that contributes to the physical properties of PEGDA crosslinked systems while maintaining their “blank slate” character.21, 30 However, only two PEGDA-NVP hydrogel formulations have thus far been identified which allow the examination of distinct moduli (namely 100 kPa and 200 kPa) at consistent average mesh size (or vice versa).21 Furthermore, Browning et al. recently reported that the introduction of star PEG-tetraacrylate (PEGTA) as an SRS into linear PEGDA systems resulted in the identification of 6 hydrogel formulations possessing significantly different moduli but similar average mesh size (and vice versa).23 As with the NVP studies, this work demonstrated only a relatively restricted modulus range (~130–250 kPa) over which “constant” average mesh size could be achieved. This modulus range is generally considered to be outside the range of interest for investigating many biologically significant phenomena, such as modulus-driven lineage commitment of mesenchymal stem cells (~10–50 kPa)31 and soft tissue cancer cell metastasis (10–100 kPa).32–34 Expanding the modulus range over which consistent average mesh size can be achieved would significantly advance the study of mechanobiology in 3D.22 Similarly, expanding the mesh size range over which consistent mechanical properties can be achieved would advance the ability to design release vehicles for applications where specific hydrogel modulus or strength is required.
This work presents an in-depth study of NVP and PEGTA incorporation as SRS into linear PEGDA hydrogels with the goal of significantly expanding the range over which “decoupled” examination of modulus and mesh size effects is achievable. These two SRS were selected over other potential SRS (such as PEGMA24 or internal allyloxycarbonyl groups18) based on the target modulus range (10–100 kPa) and/or simplicity of preparation. In the current study, PEGDA-SRS hydrogel “libraries” were fabricated and characterized for each of 4 distinct PEGDA Mn. For each library, solutions of PEGDA of a particular Mn were prepared at 4–8 different concentrations and were cured in the presence of either PEGTA or NVP (shown schematically in Figure 1). Following equilibrium swelling, the average mesh sizes of the prepared hydrogel formulations were determined by the diffusion of fluorescent dextran, while elastic moduli were assessed using tensile testing. The resulting modulus and mesh size data for each PEGDA-SRS library were plotted and compared against that of pure PEGDA hydrogel formulations to identify potential effects of SRS incorporation on the relationship between modulus and mesh size. Several of the resulting hydrogel libraries demonstrated shifts in their modulus-mesh size relationships compared to pure PEGDA systems, with the degree of shift depending on the SRS dose and PEGDA Mn. To our knowledge, this is the first study to demonstrate that SRS incorporation allows for the identification of a number of modulus ranges that can be probed at consistent average mesh size (or vice versa).
Figure 1.
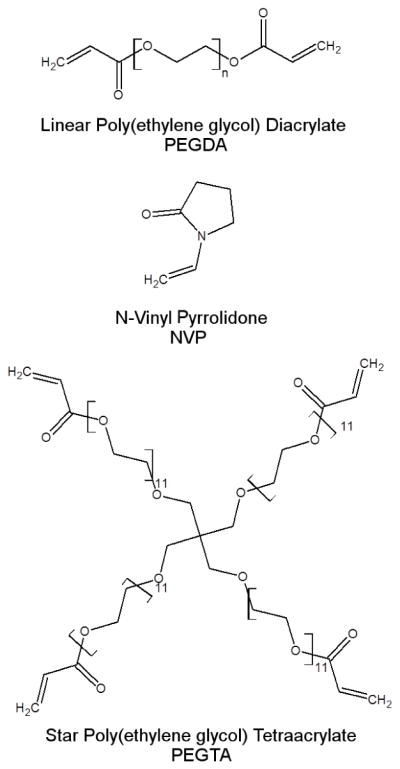
Chemical structure of poly(ethylene glycol) diacrylate (PEGDA) and the secondary reactive species (SRS) used in this study namely, namely N-vinyl pyrrolidone (NVP) and star poly(ethylene glycol) tetraacrylate (PEGTA).
2. MATERIALS AND METHODS
2.1. Materials
All laboratory supplies were purchased from VWR International unless otherwise specified. Linear PEG, triethylamine, acryloyl chloride, 2,2-dimethyl-2-phenyl-acetophenone (Irgacure 651), fluorescein isothiocyanate-labeled dextrans (FITC-dextrans), 2-hydroxy-4′-(2-hydroxyethoxy)-2-methylpropiophenone (Irgacure 2959) and NVP were purchased from Sigma Aldrich. Four-arm PEG was obtained from Jenkem Technology.
2.2. Synthesis of PEGDA and PEGTA
PEGDA was prepared according to a previously established protocol.35 Briefly, linear PEG (Mn = 3.4 kDa, 6.0 kDa, 10.0 kDa, 20.0 kDa) was dissolved in dry dichloromethane at a concentration of 0.05 mM and purged with argon. Thereafter, triethylamine was added slowly to the solution at a molar ratio of 2:1, followed by the drop-wise addition of acryloyl chloride at molar ratios of 4:1, 4:1, 8:1, or 12:1 for PEG Mn of 3.4 kDa, 6.0 kDa, 10.0 kDa, 20.0 kDa, respectively. After 24 h of stirring at 4 °C, residual hydrochloric acid was removed by washing twice with 2 M K2CO3 and separating the mixture into aqueous and organic phases. The organic phase was subsequently dried using anhydrous MgSO4. PEGDA was precipitated in diethyl ether in an ice bath, filtered and dried under vacuum at room temperature. The extent of acrylation was determined by 1H NMR to be greater than 92% for each PEGDA batch. PEGTA was prepared from four-arm PEG (Mw = 2.0 kDa) using a similar protocol as described for PEGDA, with acryloyl chloride being added at a molar ratio of 8:1. The extent of PEGTA acrylation was determined to be greater than 95% by 1H NMR.
2.3. Preparation of PEGDA-SRS Hydrogels and PEGDA Control Hydrogels
2.3.1. Preparation of PEGDA-NVP Hydrogels
PEGDA precursor solutions were prepared in phosphate buffered saline (PBS) at 6 to 8 different concentrations of PEGDA for each of the four Mn listed previously. In general, 5%, 10%, 15%, 20%, 25% and 30% w/v PEGDA solutions were prepared, although 6%, 8%, and 12.5% w/v solutions were also occasionally made, particularly for the lower Mn formulations. Photoinitiator consisting of a 300 mg/mL solution of Irgacure 651 (I651) dissolved in NVP was added to each PEGDA precursor solution at 10 μL/mL. Here, the NVP contributed an equivalent of ~0.1 mmol of reactive vinyl groups per mL of precursor solution. The mixtures were subsequently vortexed and filtered using 0.22 μm filters. Thereafter, 1.5 mL of the filtered solutions were pipetted into 0.75–1.10 mm thick transparent rectangular glass molds and polymerized by a 2 min exposure to long-wave ultraviolet light (~6 mW/cm2, 365 nm; Spectronics Corporation). The resulting hydrogels were referred to as “PEGDA-NVP/I651” formulations.
To confirm that the observed effects associated with NVP inclusion were not dependent on the chemistry of the photoinitiator (i.e. I651), another group of NVP-containing hydrogel formulations was prepared using Irgacure 2959 (I2959) as the photoinitiator. Briefly, 3.4 kDa PEGDA and 10 kDa PEGDA precursor solutions were prepared over a range of 5–30% w/v PEGDA. Photoinitiator consisting of a 262 mg/mL solution of I2959 dissolved in NVP was added to each PEGDA precursor solution at 10 μL/mL (for an equivalent of ~0.1 mmol/mL of reactive vinyl groups being contributed by the NVP). The mixtures were vortexed and filtered using 0.22 μm filters. Hydrogels were prepared within glass molds as described previously and were designated “PEGDA-NVP/I2959”.
To assess the effects of increased NVP dose on PEGDA-NVP hydrogel properties, a separate group of hydrogels was prepared with 5–30% w/v 3.4 kDa PEGDA and cured in the presence of I651 and either 1 μL/mL NVP (for an equivalent of ~0.01 mmol/mL of reactive vinyl groups being contributed by the NVP) or 20 μL/mL NVP (for an equivalent of ~0.2 mmol/mL of reactive vinyl groups being contributed by the NVP). The resulting hydrogels were referred to as “PEGDA-0.1×NVP/I651” and “PEGDA-2×NVP/I651” formulations, respectively.
2.3.2. Preparation of PEGDA-PEGTA Hydrogels
To examine the impact of SRS chemistry on hydrogel properties, PEGTA (2.0 kDa) was added as an SRS to six different 3.4 kDa PEGDA precursor solutions at either 10 mg/mL (for an equivalent of 0.02 mmol/mL of reactive acrylate groups being contributed by PEGTA) or 50 mg/mL (for an equivalent of 0.1 mmol/mL of reactive acrylate groups being contributed by PEGTA). Photoinitiator consisting of a 262 mg/mL solution of I2959 dissolved in 70% ethanol was then added to each PEGDA precursor solution at 10 μL/mL, and the mixtures were vortexed and filtered using 0.22 μm filters. Hydrogels were prepared within glass molds as described previously and were designated “PEGDA-PEGTA” formulations.
2.3.3. Preparation of PEGDA Control Hydrogels
To confirm the quality of our hydrogel characterization techniques, a PEGDA hydrogel series was fabricated in the absence of an SRS. Briefly, PEGDA precursor solutions were prepared in PBS at 6 different concentrations of 3.4 kDa, 6.0 kDa, 10.0 kDa or 20.0 kDa PEGDA. Photoinitiator consisting of 262 mg/mL I2959 in 70% ethanol was then added to each PEGDA precursor solution at 10 μL/mL, and the mixtures were vortexed, filtered using 0.22 μm filters and cured as described previously. The resulting hydrogels – designated “PEGDA Control” formulations – served as a baseline for statistically assessing the effects of SRS incorporation.
2.4. Characterization of PEGDA-SRS Hydrogels and PEGDA Control Hydrogels
Following fabrication, all PEGDA-SRS and PEGDA control hydrogel formulations were immersed in PBS for 24 h to allow for equilibrium swelling to be attained. The average mesh size and modulus of each formulation as well as the extent of swelling were subsequently characterized as follows.
2.4.1. Evaluation of hydrogel swelling in the relaxed state and at equilibrium swelling
Immediately following photopolymerization, the initial weights (Wi) of a subset of discs from each PEGDA hydrogel formulation were recorded. These discs were subsequently transferred to PBS for 24 h to allow for equilibrium swelling, after which they were transferred to fresh PBS for an additional 4 h at room temperature. The swollen weight (Ws) of each sample was then recorded, and the discs were then lyophilized for 24 h. Following recording of the dry weight (Wd) of each specimen, the volumetric swelling ratio in the relaxed state (Q*) was calculated for each hydrogel as: , where ρs is the density of the solvent and ρp is the density of PEGDA. The volumetric swelling ratio at equilibrium (Q) was also calculated for each hydrogel as:
2.4.2. Evaluation of hydrogel mesh size
Due to limitations associated with more standard mesh size assessment methods, we chose to characterize hydrogel mesh size via a series of dextran diffusion experiments based on an adaptation of the methodology of Watkins et al.36 For instance, PEGDA hydrogel mesh size cannot be visualized using conventional scanning electron microscopy (SEM) due to the collapse of the hydrogel mesh structure during sample drying.37 Although cryo-SEM can overcome this limitation,21 the technique is prohibitively expensive to run on expanded hydrogel libraries such as those analyzed herein. Mathematical correlations38–40 that estimate average hydrogel mesh size (ξ) based on the degree of hydrogel swelling (Q) in aqueous solutions lose sensitivity when applied to high concentration PEGDA networks.16 In contrast, the dextran diffusion method allows for low-cost assessment of average hydrogel mesh size over large libraries without extensive sample preparation and is sensitive over the range of PEGDA concentrations and molecular weights tested in this study.20–21, 23
Briefly, swollen hydrogel discs (8 mm diameter, 1.1 mm swollen thickness) were immersed at room temperature in PBS containing 0.05 mg/mL of FITC-dextran (Mw = 4 kDa, 10 kDa, or 20 kDa). FITC-dextran of each molecular weight was allowed to diffuse into the hydrogel discs for 24 h, following which each disc was gently blotted and transferred to fresh PBS. After 24 h, the fluorescence of the FITC-dextran that had diffused out of the hydrogels was measured using a fluorescence plate reader (BioTek Instruments Inc.) at excitation and emission wavelengths of 480 and 520 nm respectively. The fluorescence measurements were converted to micrograms of FITC-dextran using a standard curve.
For each hydrogel, the measured concentrations of each FITC-dextran were plotted against the hydrodynamic radius of the corresponding FITC-dextran (1.4 nm, 2.3 nm, and 3.3 nm for dextran Mw of 4 kDa, 10 kDa, and 20 kDa, respectively). The area under the resulting curve served as a quantitative indicator of hydrogel permissivity over the range of hydrodynamic radii assayed. The relative mesh size, μ, of a particular hydrogel was determined as the ratio of the area under the curve for that hydrogel to the area under the curve for a 30% 10.0 kDa PEGDA-NVP/I651 reference formulation.20 Based on an absolute average mesh size value of 9.5 nm for the 30% 10 kDa hydrogel PEGDA-NVP/I651,20 the absolute average mesh size of a particular hydrogel formulation, x, was estimated as:
2.4.3. Measurement of elastic modulus
The tensile moduli of the hydrogels were assessed by a previously validated ring method.41 Briefly, hydrogel rings measuring 8 mm outer diameter, 6 mm inner diameter and 1.1 mm post-swelling thickness were mounted using custom brackets onto an Instron 3342 equipped with a 10 N load cell. The rings were exposed to a uniaxial strain of 6 mm/min and tested until failure. Applied stress was calculated from the measured force by approximating the area of force application as two rectangles, each with sides equal to the width and wall thickness of the ring. The gauge length was determined to be the distance between the midpoints on diametrically opposite loops of the ring, i.e. 7 mm. Strain was calculated as the ratio of the displacement to the gauge length. Finally, the modulus of each hydrogel was determined from the slope of the linear portion of the stress-strain curve.
2.4.4. Validation of the mesh size and modulus characterization methods
To evaluate the quality of our assessment tools, we confirmed that our modulus and mesh size results for the PEGDA control formulations were consistent with the exponential relationship between modulus and mesh size predicted from Flory-Rehner theory and the Canal-Peppas equation under the conditions of high degrees of swelling, where chain ends can be considered negligible.40, 42 Specifically, Flory and Rehner developed a correlation linking the measurable quantity of equilibrium hydrogel swelling, Q, to the network structural parameter, M̄c (i.e. the average molecular weight between crosslinks), by applying thermodynamic arguments to crosslinked polymer networks.38 This equation was subsequently modified as follows by Peppas and Merrill to improve its accuracy for networks crosslinked in the presence of a solvent:39, 42
| (1) |
where, Mn is the number average molecular weight of the polymer chains in the absence of any crosslinking, ν̄ is the specific volume of the polymer, V1 is the molar volume of the solvent, ν2,s is the post-swelling equilibrium polymer volume fraction (1/Q), ν2,r is the polymer volume fraction in the relaxed state before swelling (1/Q*), and χ12 is the solvent-polymer interaction parameter. Similarly, Anseth et al. utilized rubber elasticity theory to develop a relationship between the mechanical properties of crosslinked hydrogel networks and their molecular structure.43 Here, the relationship between M̄c and tensile modulus E (as opposed to compressive modulus)44 is given by:
| (2) |
where ν is Poisson’s ratio for the hydrogel, R is the ideal gas constant, ρp is the density of the dry polymer, and T is the temperature in Kelvin.
For high degrees of swelling (Q > 10), where chain ends are negligible, equation 1 and equation 2, respectively, can be approximated as:
| (3) |
| (4) |
In addition, the mesh size of hydrogel networks can theoretically be estimated as described by Canal and Peppas:40
| (5) |
where is the root-mean-squared end-to-end distance of the polymer chains. Since is proportional to M̄c, a scaling relationship between the network mesh size ξ and tensile elastic modulus E under conditions of high swelling can be obtained by combining equations (3), (4) and (5):
| (6) |
The above relationship was overlaid onto the E-ξ data obtained from characterization of the PEGDA control hydrogels which met the underlying assumptions for these approximations (i.e. Q > 10).
2.5. Statistical Analyses
The average mesh sizes (ξ) of the individual formulations within each hydrogel library (i.e. hydrogels prepared with a particular PEGDA Mn and SRS but varying PEGDA concentration) were plotted against their corresponding elastic moduli (E). Results are reported as mean ± standard deviation for n = 4 – 8 hydrogel samples for each formulation per characterization method. The absolute deviation of the modulus-mesh curve for each PEGDA-SRS library relative to the E-ξ trendline for the PEGDA controls was statistically evaluated using ANOVA followed by a Tukey’s post-hoc test (SPSS version 22.0, IBM), with a p-value < 0.05 considered significant.
3. RESULTS
3.1. Baseline Measures: Relationship between Mesh Size and Tensile Modulus for PEGDA Control Hydrogels
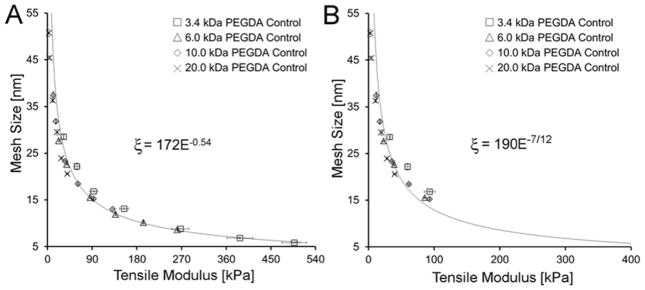
To serve as a baseline against which we could compare the modulus-mesh size relationships of the PEGDA-SRS hydrogels, PEGDA control hydrogels – without an SRS – were fabricated and characterized. The average mesh size of the resulting hydrogels was then plotted against the corresponding tensile modulus (Figure 2A). As expected, average mesh size decreased and modulus concurrently increased with an increase in precursor solution concentration for each of the Mn tested (Table 1). Moreover, the curves for the different Mn followed a common exponential trendline such that the E-ξ curve arising from any particular PEGDA Mn was statistically indistinguishable from that of the remaining PEGDA Mn. This overlay of the modulus-mesh size curves of the PEGDA control hydrogels irrespective of PEGDA Mn is predicted by Flory-Rehner theory and thus served as an important validation of our characterization methods.45
Figure 2.
(A) Plot of mesh size versus modulus of PEGDA control hydrogels. (B) Plot of mesh size versus modulus for a subset of PEGDA control hydrogel formulations with Q > 10. The trendline ξ α E−7/12 predicted by Flory-Rehner Theory and Canal and Peppas is overlaid onto the Q > 10 data. Data values are reported as average ± standard deviation for n = 4 independent samples per formulation.
Table 1.
Tensile modulus, mesh size and swelling properties of PEGDA control) hydrogels fabricated using Irgacure 2959 dissolved in 70% ethanol
| Concentration [% w/w] | Tensile Modulus (E) [kPa] | Mesh Size (ξ) [nm] 34 | Q | Q* | Crosslink Density (ρx) [mol/L] | |
|---|---|---|---|---|---|---|
| 3.4 kDa PEGDA | 8 | 32.4 ± 0.5 | 28.5 ± 0.4 | 15.13 ± 0.17 | 13.25 ± 0.14 | 1.281 ± 0.009 |
| 10 | 59.2 ± 4.0 | 22.2 ± 0.6 | 12.10 ± 0.09 | 10.65 ± 0.02 | 1.491 ± 0.017 | |
| 15 | 158.2 ± 8.9 | 13.1 ± 0.2 | 8.33 ± 0.02 | 7.09 ± 0.04 | 1.979 ± 0.014 | |
| 20 | 268.1 ± 17.2 | 8.8 ± 0.04 | 6.76 ± 0.04 | 5.33 ± 0.04 | 2.284 ± 0.012 | |
| 25 | 387.8 ± 26.0 | 6.8 ± 0.1 | 5.97 ± 0.02 | 4.30 ± 0.03 | 2.431 ± 0.013 | |
| 30 | 497.3 ± 25.0 | 5.9 ± 0.2 | 5.48 ± 0.03 | 3.60 ± 0.09 | 2.484 ± 0.021 | |
|
| ||||||
| 6.0 kDa PEGDA | 8 | 22.9 ± 1.7 | 27.7 ± 0.2 | 18.42 ± 0.44 | 13.46 ± 0.33 | 0.770 ± 0.012 |
| 10 | 39.1 ± 1.7 | 22.6 ± 0.2 | 16.16 ± 0.63 | 11.37 ± 0.40 | 0.819 ± 0.024 | |
| 15 | 85.8 ± 1.4 | 15.5 ± 0.1 | 11.99 ± 0.07 | 7.58 ± 0.03 | 0.953 ± 0.007 | |
| 20 | 137.0 ± 9.8 | 12.0 ± 0.3 | 9.72 ± 0.08 | 5.60 ± 0.02 | 1.066 ± 0.013 | |
| 25 | 193.2 ± 4.8 | 10.2 ± 0.4 | 8.44 ± 0.07 | 4.34 ± 0.04 | 1.126 ± 0.020 | |
| 30 | 262.0 ± 18.9 | 8.6 ± 0.3 | 7.56 ± 0.02 | 3.68 ± 0.02 | 1.205 ± 0.005 | |
|
| ||||||
| 10.0 kDa PEGDA | 8 | 12.0 ± 0.9 | 37.4 ± 0.8 | 25.1 ± 0.8 | 13.6 ± 0.2 | 0.425 ± 0.011 |
| 10 | 17.2 ± 0.5 | 31.8 ± 0.4 | 21.2 ± 0.6 | 11.0 ± 0.1 | 0.458 ± 0.015 | |
| 15 | 35.8 ± 1.3 | 23.3 ± 0.1 | 15.5 ± 0.3 | 7.2 ± 0.1 | 0.530 ± 0.012 | |
| 20 | 61.4 ± 1.3 | 18.4 ± 0.2 | 12.7 ± 0.2 | 5.4 ± 0.1 | 0.587 ± 0.013 | |
| 25 | 93.1 ± 0.4 | 15.2 ± 0.2 | 11.2 ± 0.1 | 4.3 ± 0.1 | 0.618 ± 0.010 | |
| 30 | 131.2 ± 5.5 | 13.0 ± 0.1 | 9.8 ± 0.1 | 3.5 ± 0.1 | 0.670 ± 0.011 | |
|
| ||||||
| 20.0 kDa PEGDA | 8 | 2.82 ± 0.5 | 50.7 ± 0.8 | 44.0 ± 1.1 | 14.6 ± 0.4 | 0.180 ± 0.002 |
| 10 | 4.1 ± 0.1 | 45.4 ± 0.4 | 36.6 ± 1.2 | 11.6 ± 0.1 | 0.192 ± 0.004 | |
| 15 | 10.8 ± 0.6 | 36.2 ± 0.3 | 25.4 ± 0.7 | 7.5 ± 0.1 | 0.225 ± 0.006 | |
| 20 | 19.4 ± 1.4 | 29.5 ± 0.6 | 20.2 ± 0.4 | 5.5 ± 0.1 | 0.251 ± 0.006 | |
| 25 | 28.2 ± 1.4 | 23.9 ± 0.2 | 17.1 ± 0.31 | 4.4 ± 0.1 | 0.273 ± 0.006 | |
| 30 | 39.9 ± 2.6 | 20.6 ± 0.2 | 14.8 ± 0.2 | 3.6 ± 0.1 | 0.296 ± 0.003 | |
Q is the volumetric swelling ratio at equilibrium, Q* is the volumetric swelling ratio in the relaxed state before equilibrium and ρx is the crosslink density estimated using the swelling data as follows: , where Mc and ν̄ are the average molecular weight between crosslinks and v̄ is the specific volume of the polymer respectively.
To further evaluate the quality of our assessment tools, we confirmed that our data were consistent with the exponential relationship between modulus and mesh size predicted by Flory-Rehner theory and the Peppas-Merrill equation under the conditions of high degrees of swelling (Q > 10), where chain ends can be considered negligible40, 42: ξ ∝ (E)−7/12. (Derivation of this relationship can be found in the Materials and Methods section.) A plot containing only the PEGDA control formulations which meet the assumptions underlying the above correlation (Q > 10) is shown in Figure 2B. A trendline ξ ∝ (E)−7/12 overlaid onto the reduced data set shows a high degree of agreement between our data and this existing scaling relationship. Importantly, these control data also demonstrate the inability to independently examine hydrogel modulus or mesh size effects using pure PEGDA hydrogels. Further physical data for the PEGDA control series are presented in Table 1.
3.2. Effects of NVP as an SRS: Relationship between Mesh Size and Tensile Modulus for PEGDA-NVP Hydrogels
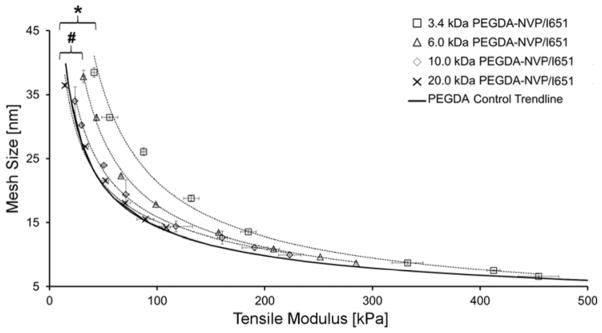
Next, we extended these characterization tools to hydrogels prepared from 3.4 kDa, 6 kDa, 10 kDa or 20 kDa PEGDA and cured in the presence of ~0.1 mmol/mL of NVP using the photoinitiator I651. For these hydrogels, the moduli values ranged between 15 and 454 kPa, while the corresponding mesh size values ranged from 6.6 to 37.8 nm over the array of concentrations and Mn of PEGDA tested (Figure 3). These modulus and mesh size ranges are similar to those observed for the PEGDA control hydrogels fabricated in the absence of an SRS (Figure 2A). However, unlike the PEGDA control hydrogels, the E-ξ curves for PEGDA-NVP/I651 hydrogels of varying Mn did not overlay onto a single trendline. Table 2 lists the mean lateral distances between the PEGDA control trendline and the corresponding PEGDA-NVP/I651 hydrogel series trendline as a function of PEGDA Mn. Notably, as PEGDA Mn decreased, the deviation of the PEGDA-NVP/I651 modulus-mesh curves from the PEGDA control trendline became more pronounced (Figure 3). Specifically, the 3.4 kDa and 6.0 kDa PEGDA-NVP/I651 hydrogels showed statistically significant deviations (p < 0.001) from the PEGDA control trendline, although the 10.0 kDa and 20.0 kDa PEGDA-NVP/I651 curves were statistically indistinguishable from the PEGDA control trendline. Further data on the physical properties of PEGDA-NVP/I651 hydrogel formulations are presented in Table 3.
Figure 3.
Influence of NVP on the E-ξ curves for PEGDA-NVP hydrogels of varying PEGDA Mn and concentration. Data values are reported as average ± standard deviation for n = 4–8 independent samples per formulation. An asterisk indicates significant differences between the 3.4 kDa PEGDA-NVP/I651 and the PEGDA control trend line (p < 0.001), while a pound symbol indicates significant differences between 6.0 kDa PEGDA-NVP/I651 and the PEGDA control trendline (p < 0.001).
Table 2.
Mean lateral distance between the PEGDA control trendline and the corresponding PEGDA-NVP/I651 hydrogels series trendline as a function of molecular weight
| Hydrogels Series | Mean Distance [kPa] |
|---|---|
| PEGDA Control | 9.2 ± 7.6 |
| 20.0 kDa PEGDA-NVP/I651 | 4.5 ± 1.8 |
| 10.0 kDa PEGDA-NVP/I651 | 18.4 ± 11.8 |
| 6.0 kDa PEGDA-NVP/I651 | 32.2 ± 11.7a,b |
| 3.4 kDa PEGDA-NVP/I651 | 57.4 ± 22.6 a,b,c,d |
significantly different from PEGDA control series, p < 0.001;
significantly different from 20.0 kDa PEGDA-NVP/I651, p < 0.001;
significantly different from 10.0 kDa PEGDA-NVP/I651, p < 0.05;
significantly different from 6.0 kDa PEGDA-NVP/I651, p < 0.05.
Table 3.
Tensile modulus, mesh size and swelling properties of PEGDA-NVP/I651 hydrogels
| Concentration [% w/w] | Tensile Modulus € [kPa] | Mesh Size (ξ) [nm] 34 | Q | Q* | Crosslink Density (ρx) [mol/L] | |
|---|---|---|---|---|---|---|
| 3.4 kDa PEGDA | 5 | 41.5 ± 2.7 | 38.5 ± 0.7 | 18.37 ± 0.39 | 18.0 ± 0.38 | 1.227 ± 0.015 |
| 10 | 131.5 ± 7.2 | 17.2 ± 0.3 | 9.91 ± 0.07 | 9.39 ± 0.09 | 1.847 ± 0.009 | |
| 15 | 221.6 ± 6.2 | 10.1 ± 0.7 | 7.93 ± 0.06 | 7.18 ± 0.06 | 2.183 ± 0.016 | |
| 20 | 332.6 ± 19.0 | 8.3 ± 0.5 | 6.68 ± 0.06 | 5.14 ± 0.06 | 2.274 ± 0.017 | |
| 25 | 412.5 ± 7.6 | 7.2 ± 0.4 | 6.21 ± 0.06 | 4.27 ± 0.03 | 2.240 ± 0.038 | |
| 30 | 454.4 ± 38.2 | 6.4 ± 0.4 | 5.74 ± 0.09 | 3.51 ± 0.09 | 2.236 ± 0.023 | |
|
| ||||||
| 6.0 kDa PEGDA | 5 | 31.7 ± 0.7 | 37.8 ± 1.0 | 19.39 ± 0.46 | 18.56 ± 0.43 | 0.889 ± 0.016 |
| 10 | 98.8 ± 4.3 | 17.8 ± 0.2 | 10.96 ± 0.10 | 9.67 ± 0.14 | 1.324 ± 0.008 | |
| 15 | 157.2 ± 5.2 | 12.2 ± 0.1 | 8.94 ± 0.07 | 6.37 ± 0.53 | 1.347 ± 0.090 | |
| 20 | 208.3 ± 8.4 | 9.9 ± 0.2 | 7.92 ± 0.08 | 5.05 ± 0.05 | 1.395 ± 0.017 | |
| 25 | 251.7 ± 7.9 | 8.8 ± 0.1 | 7.38 ± 0.10 | 4.13 ± 0.04 | 1.361 ± 0.026 | |
| 30 | 285.1 ± 12.9 | 7.9 ± 0.1 | 6.81 ± 0.19 | 3.39 ± 0.09 | 1.367 ± 0.041 | |
|
| ||||||
| 10.0 kDa PEGDA | 5 | 23.8 ± 1.4 | 35.4 ± 0.6 | 20.72 ± 0.42 | 18.00 ± 0.42 | 0.646 ± 0.009 |
| 10 | 68.9 ± 3.4 | 20.7 ± 0.7 | 13.77 ± 0.05 | 10.16 ± 0.34 | 0.794 ± 0.005 | |
| 15 | 117.5 ± 15.5 | 15.1 ± 0.2 | 11.60 ± 0.03 | 7.04 ± 0.05 | 0.801 ± 0.004 | |
| 20 | 160.6 ± 4.73 | 13.3 ± 0.1 | 10.27 ± 0.02 | 5.30 ± 0.01 | 0.806 ± 0.008 | |
| 25 | 190.7 ± 11.9 | 11.4 ± 0.1 | 9.31 ± 0.04 | 4.22 ± 0.02 | 0.806 ± 0.008 | |
| 30 | 223.2 ± 10.6 | 10.2 ± 0.1 | 8.61 ± 0.02 | 3.52 ± 0.01 | 0.811 ± 0.001 | |
|
| ||||||
| 20.0 kDa PEGDA | 5 | 14.4 ± 0.4 | 36.5 ± 0.3 | 29.77 ± 0.21 | 20.64 ± 0.06 | 0.326 ± 0.004 |
| 10 | 33.2 ± 3.3 | 26.9 ± 0.2 | 20.43 ± 0.24 | 10.75 ± 0.10 | 0.365 ± 0.005 | |
| 15 | 51.9 ± 3.1 | 21.6 ± 0.3 | 16.50 ± 0.05 | 7.30 ± 0.03 | 0.381 ± 0.001 | |
| 20 | 70.2 ± 5.0 | 18.0 ± 0.2 | 14.86 ± 0.17 | 5.47 ± 0.02 | 0.382 ± 0.007 | |
| 25 | 89.2 ± 8.0 | 15.5 ± 0.2 | 12.94 ± 0.21 | 4.33 ± 0.02 | 0.390 ± 0.008 | |
| 30 | 108.2 ± 4.1 | 14.2 ± 0.1 | 11.97 ± 0.18 | 3.54 ± 0.02 | 0.402 ± 0.009 | |
Q is the volumetric swelling ratio at equilibrium, Q* is the volumetric swelling ratio in the relaxed state before equilibrium and ρx is the crosslink density estimated using the swelling data as follows: , where Mc and ν̄ are the average molecular weight between crosslinks and ν̄ is the specific volume of the polymer respectively.
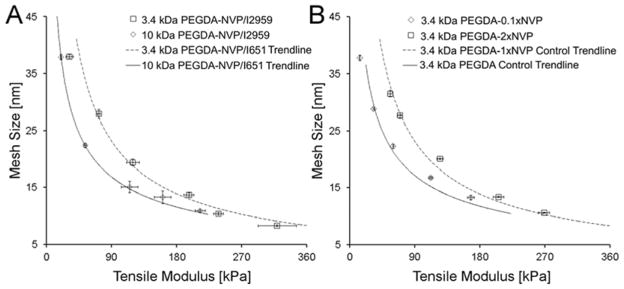
To ensure that the observed shifts in the E-ξ curves were a result of the NVP rather than the selected photoinitiator (i.e. I651), 3.4 kDa PEGDA-NVP hydrogels (shift anticipated) and 10.0 kDa PEGDA-NVP hydrogels (no significant shift anticipated) were prepared using a different photoinitiator (I2959). As with the PEGDA-NVP/I651 hydrogels, the E-ξ curve for the 3.4 kDa PEGDA-NVP/I2959 hydrogels displayed a significant deviation from the PEGDA control trendline (p < 0.001), but the 10.0 kDa PEGDA-NVP/I2959 hydrogels did not (Figure 4A). In addition, the magnitude of the shift in the E-ξ curves (relative to the PEGDA control trendline) was the same for the PEGDA-NVP/I2959 hydrogels as for the corresponding PEGDA-NVP/I651 hydrogels (Figure 4A). These data indicate that the NVP was responsible for the deviations in E-ξ curves observed with the PEGDA-NVP/I651 hydrogels. To examine the dose dependence of the effect of NVP on PEGDA-NVP hydrogel properties, 3.4 kDa PEGDA-NVP hydrogels were prepared with ~0.01 mmol/mL of NVP (0.1×NVP) as well as 2 mmol/mL NVP (2×NVP). In contrast to 1×NVP, 0.1×NVP was insufficient to result in a statistically significant shift in the modulus-mesh curves relative to the control trendline (Figure 4B). However, 2×NVP did not yield further shifts in the E-ξ curve relative to the 3.4 kDa PEGDA-1×NVP hydrogels (Figure 4B), indicating that increases in NVP dose beyond a certain level do not substantially impact average network structure. This latter result may be due to kinetic limitations on the incorporation of NVP within PEGDA networks.30
Figure 4.
(A) Effect of photoinitiator chemistry on the E-ξ curves for the 3.4 kDa and 10.0 kDa PEGDA-NVP series. Note that the 3.4 kDa and 10 kDa PEGDA-NVP/I2959 data points are overlaid onto the line-fits for the corresponding E-ξ curves for PEGDA-NVP/I651 data. (B) Effect of 0.1×NVP and 2×NVP on the E-ξ curve for the 3.4 kDa PEGDA–NVP series. The 3.4 kDa PEGDA-2×NVP/I651 data points are overlaid onto the line-fit for the E-ξ curve for PEGDA-1×NVP/I651 data and the 3.4 kDa PEGDA-0.1×NVP data are overlaid onto the line-fit for the E-ξ curve for 3.4 kDa PEGDA control data. Data values are reported as average ± standard deviation for n = 4 independent samples per formulation
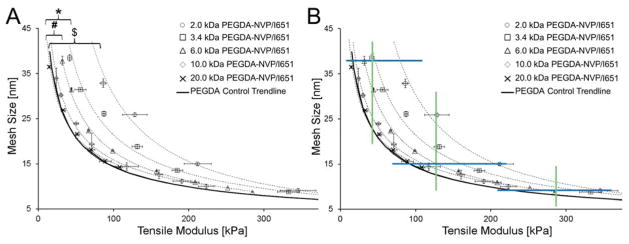
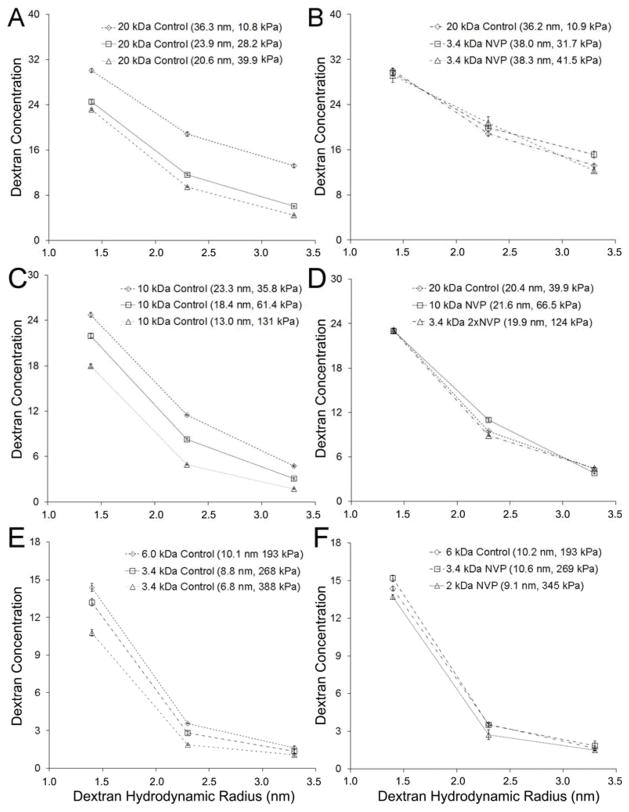
To further examine the impact of PEGDA Mn on the degree of shift in the PEGDA-NVP modulus-mesh curves relative to PEGDA controls, a PEGDA-NVP hydrogel series was prepared with 2.0 kDa PEGDA and 1×NVP. The resulting data confirm and extend upon the previous observations with 3.4 kDa and 6.0 kDa PEGDA-NVP hydrogels and demonstrate that the degree of shift in PEGDA-NVP modulus-mesh curves relative to PEGDA controls increases with decreasing PEGDA Mn (Figure 5B). Cumulatively, the PEGDA-NVP and PEGDA control hydrogel data indicate that numerous modulus ranges can be probed without significant changes in average mesh size, including ~200–340 kPa all the way down to ~10–75 kPa (Figure 5B). Importantly, these lower modulus ranges are of significant interest in soft tissue mechanobiology.18, 31,32–34 Similarly, mesh size ranges which can be investigated without substantially impacting elastic modulus include 7.5–11.0 nm all the way to 23.0–40.0 nm. That said, PEGDA hydrogels are heterogeneous systems – i.e. two PEGDA hydrogels with similar average mesh sizes may not share a similar mesh size distribution. Thus, we further examined the dextran diffusion curves for a subset of the hydrogels for which similar average mesh size, but distinct moduli, were identified (Figure 6). Recall that the mesh structure of each hydrogel network was characterized by the diffusion of three dextrans of distinct hydrodynamic radii (1.4 nm, 2.3 nm, and 3.3 nm) and that the diffusion of each of these dextrans into the network structure was used to calculate an average mesh size. In Figure 6(A, C, E), the dextran diffusion curves for PEGDA control hydrogel formulations which span the upper, intermediate, and lower modulus ranges identified in Figure 5B are shown. In Figure 6(B, D, F), dextran diffusion curves for PEGDA and PEGDA-NVP hydrogel formulations which span the same modulus range are shown. For each modulus range, the inclusion of NVP allowed not only greater agreement in average mesh size among hydrogel formulations, but also increased agreement in mesh size distribution relative to the PEGDA control hydrogel formulations.
Figure 5.
(A) PEGDA-NVP/651 modulus-mesh size curves, including a 2.0 kDa PEGDA curve, which shows increased divergence from the PEGDA control trendline. “$” indicates significant differences between the 2.0 kDa PEGDA-NVP/I651 and the PEGDA control trend line (p < 0.001). (B) Constant average mesh size ranges and constant modulus ranges achievable with the analyzed PEGDA-NVP/I651 hydrogels. Upper, intermediate, and lower boundaries of modulus ranges which can be investigated while maintaining consistent average mesh size are shown in blue. Upper, intermediate, and lower boundaries for mesh size ranges which can be probed at constant elastic modulus are shown in green.
Figure 6.
Dextran diffusion curves for various hydrogel formulations demonstrating the capacity of NVP incorporation to enable specific modulus ranges to be examined with increased homogeneity in mesh size relative to pure PEGDA hydrogels alone. (A, B) Modulus Range 1: 10–40 kPa; Dextran diffusions curves for (A) PEGDA control hydrogel formulations and (B) PEGDA and PEGDA-NVP hydrogel formulations spanning a modulus range of 10–40 kPa. (C, D) Modulus Range 2: 40–130 kPa; Dextran diffusions curves for (C) PEGDA control hydrogel formulations and (D) PEGDA and PEGDA-NVP hydrogel formulations spanning a modulus range of 40–130 kPa. (E, F) Modulus Range 3: 190–380 kPa; Dextran diffusions curves for (A) PEGDA control hydrogel formulations and (B) PEGDA and PEGDA-NVP hydrogel formulations spanning a modulus range of 190–380 kPa.
3.3. Effects of PEGTA as an SRS: Relationship between Mesh Size and Tensile Modulus for PEGDA-PEGTA Hydrogels
To further examine the impact of SRS chemistry and dose on hydrogel properties, PEGTA was added as an SRS at a concentration of either 10 mg/mL or 50 mg/mL to six different PEGDA precursor solutions. The PEGDA-1×NVP E-ξ curves for 3.4 kDa PEGDA yielded intermediate levels of shift from the PEGDA control trendline. Therefore, 3.4 kDa PEGDA was used to test the effect of PEGTA incorporation in this set of experiments. The 50 mg/mL of PEGTA was calculated to yield an equimolar concentration of reactive groups as the 1×NVP (namely, 0.1 mmol/mL of reactive groups), while the 10 mg/mL concentration of PEGTA (0.02 mmol/mL of reactive groups) was employed to determine the degree to which lower SRS doses impacted the PEGDA-PEGTA E-ξ curves.
As expected, the E-ξ curve of the 3.4 kDa PEGDA-PEGTA hydrogels cured in the presence of 50 mg/mL of PEGTA demonstrated a significant deviation from the trendline for the PEGDA control hydrogels (Figure 7). Importantly, the E-ξ curve of the 3.4 kDa PEGDA-PEGTA hydrogels containing 50 mg/mL of PEGTA (0.1 mmol/mL of reactive acrylate PEGTA groups) was statistically indistinguishable from the E-ξ curve of the 3.4 kDa PEGDA-1×NVP/I651 hydrogels (~0.1 mmol/mL of reactive vinyl NVP groups). These data suggest that NVP and PEGTA may function in a similar manner in modifying the PEGDA network structure. In contrast, the E-ξ curve for the 3.4 kDa PEGDA-PEGTA hydrogels containing 10 mg/mL of PEGTA (0.02 mmol/mL of reactive acrylate PEGTA groups) was not significantly shifted from the PEGDA control trendline (Figure 7). This result indicates that there is a minimum dose of SRS needed to observe a substantial shift in the modulus-mesh curve of PEGDA-PEGTA hydrogels, in agreement with the PEGDA-NVP data.
Figure 7.
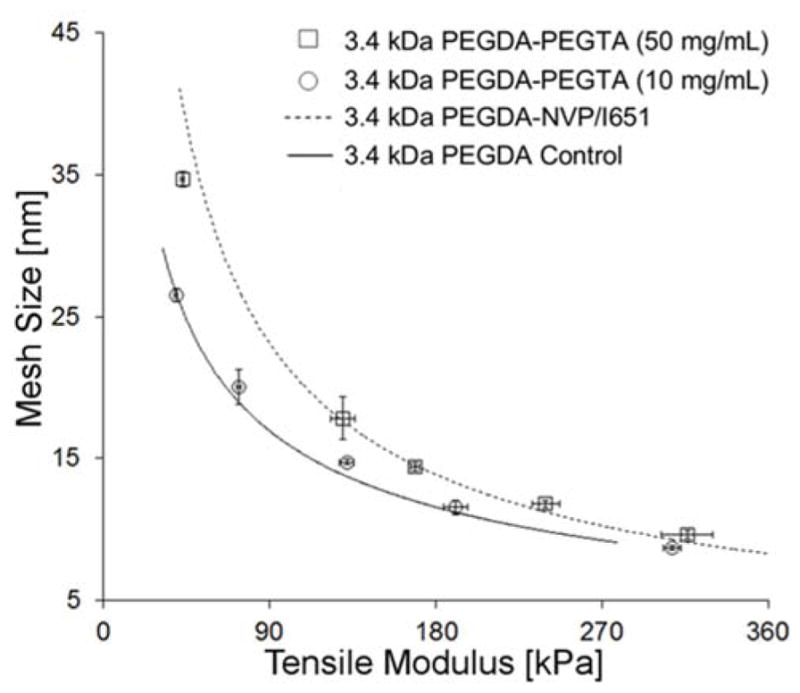
Effect of the incorporation of PEGTA on the E-ξ curve for the 3.4 kDa PEGDA hydrogel series. Note that the 3.4 kDa PEGDA-PEGTA (50 mg/ml) data points overlay onto the line-fit for the E-ξ curve for PEGDA-1×NVP/I651 data, whereas the 3.4 kDa PEGDA-PEGTA (10 mg/ml) data points overlay onto the line-fit for the E-ξ curve for the 3.4 kDa PEGDA control hydrogels. Data values are reported as average ± standard deviation for n = 4 independent samples per formulation.
4. DISCUSSION
The ability to examine the impact of microenvironmental stiffness in 3D contexts, decoupled from changes in mesh size over a range of stiffness values, would represent a significant advance for mechanobiology. Similarly, the ability to tune hydrogel mesh size while minimally impacting hydrogel mechanical properties would be useful in the design of controlled release vehicles. Therefore, the overarching goal of this study was to expand the E-ξ space available with PEGDA hydrogels towards permitting a greater degree of “decoupling” between modulus and average mesh size than is currently achievable. Towards this end, PEGDA hydrogels of varying concentrations and molecular weights were prepared in the presence NVP and PEGTA, two SRS that maintain the “blank slate” character of pure PEGDA hydrogels.25–29 The modulus and average mesh size of the resulting hydrogels were then characterized.
The incorporation of sufficient NVP or PEGTA into PEGDA hydrogels resulted in significant deviations of their E-ξ curves from the PEGDA control trendline at lower PEGDA Mn (Figures 3, 5, 7). These shifts allowed for the identification of a number of modulus ranges which could be probed at consistent average mesh size (or vice versa, Figure 5B). As noted in the Introduction, previous work has identified limited “decoupling” following the incorporation of NVP – 2 hydrogel formulations, one with modulus of 100 kPa and the other at 200 kPa with similar average mesh sizes.21 In addition, Browning et al. reported that the addition of PEGTA to PEGDA hydrogels resulted in the emergence of a modulus range (130–250 kPa) over which minimal changes in mesh size were observed and a mesh size range (50–100 nm) over which approximately constant modulus could be maintained.23 In contrast to the restricted ranges identified in these previous reports,21,23 the present results identify a number of modulus ranges (between ~200–350 kPa down to ~10–75 kPa) that can be probed at consistent average mesh size. Similarly, mesh size ranges which can be investigated without substantially impacting elastic modulus include 7.5–11.0 nm all the way to 23.0–40.0 nm.
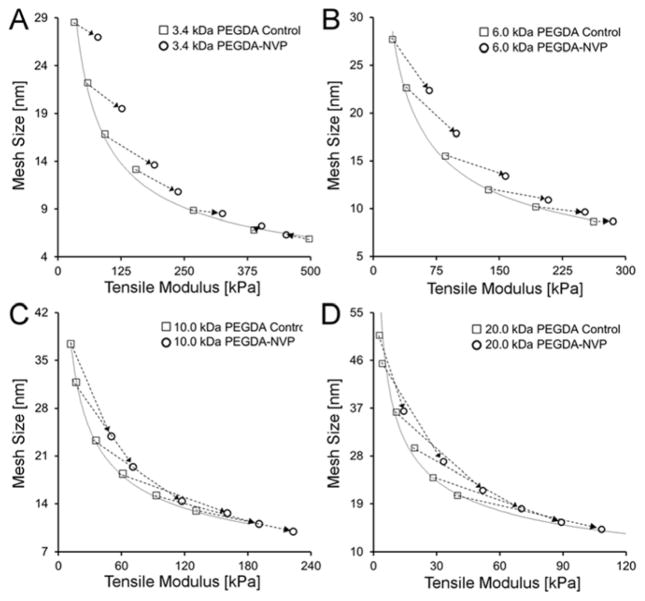
To gain insight into potential mechanisms by which these SRSs influence hydrogel structure, the modulus and mesh data points for the 3.4 kDa PEGDA control hydrogels were plotted relative to the corresponding data points for the 3.4 kDa PEGDA-NVP/I651 formulations (Figure 8A). Dashed arrows “link” PEGDA control formulations to PEGDA-NVP formulations containing the same concentration of PEGDA. The magnitude and angle of these connecting arrows give an indication of the degree of change in modulus and mesh size following NVP addition. Similar plots were prepared for the 6.0 kDa, 10.0 kDa, and 20.0 kDa hydrogel series (Figure 8B–D). For 10 kDa and 20 kDa PEGDA, the addition of NVP to low concentration (< 10% w/v) solutions of PEGDA resulted in shifts in average mesh size that were more pronounced than the corresponding shifts in modulus. In contrast, the addition of NVP to 3.4 kDa and 6 kDa PEGDA hydrogels resulted in shifts in modulus that were similar to or greater than the corresponding shifts in mesh size throughout the PEGDA concentration range probed. We showed earlier that the shifts in the E-ξ curve relative to the PEGDA control trendline were statistically significant for the 3.4 kDa and 6.0 kDa PEGDA-NVP hydrogel series, but not for the 10 kDa and 20 kDa PEGDA-NVP hydrogels (Figure 3). Thus, the data in Figures 3 and 8 indicate that the most significant deviations in the E-ξ curves of PEGDA-NVP hydrogels from the PEGDA control trendline were observed when the modulus effects of NVP balanced or exceeded its mesh size effects in the lower concentration PEGDA hydrogels.
Figure 8.
Deviations in mesh size and modulus upon the introduction of NVP within (A) 3.4 kDa PEGDA hydrogels, (B) 6.0 kDa PEGDA hydrogels, (C) 10.0 kDa PEGDA hydrogels and (D) 20.0 kDa PEGDA hydrogels. In each panel, dashed arrows “link” PEGDA control formulations to PEGDA-NVP formulations containing the same concentration of PEGDA.
The changes noted above in the manner in which NVP impacts network structure as PEGDA concentration and Mn are altered can perhaps best be understood by further examining the correlations in equations (4) and (6) in the Materials and Methods section. These equations link modulus and average mesh size to the molecular weight between crosslinks M̄c, which is inversely proportional to the more easily conceptualized parameter, crosslink density ρx. For hydrogel formulations with Q > 10, average mesh size ξ decreases exponentially with an increase in ρx of the polymer network according to ξ ∝ (ρx)−7/12. In contrast, modulus E increases exponentially with an increase in ρx : E ∝ (ρx)6/5. Accordingly, the rate of change of mesh size with increasing crosslink density is: , whereas the rate of change of modulus with increasing crosslink density is: . Thus, , and the change in mesh size associated with an incremental increase in ρx due to incorporation of an SRS will be greater than the corresponding change in modulus for ρx values less than 1 mol/L. However, as ρx increases due to increasing PEGDA concentration or decreasing PEGDA Mn, further incremental shifts in ρx will begin to have a greater impact on modulus than on average mesh size. In support of this theory, we observe that the 3.4 kDa and 6.0 kDa PEGDA-NVP/I651 formulations, which displayed significant shifts in their E-ξ curves, have estimated ρx values near to or exceeding 1 (Tables 1, 3).
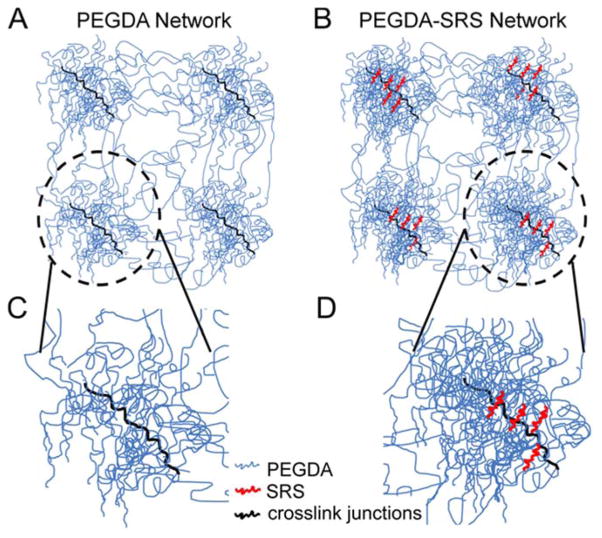
The introduction of NVP and PEGTA appear to have similar net effects on the observed degree of “decoupling” (i.e., the magnitude of the shifts in the 3.4 kDa PEGDA-NVP and 3.4 kDa PEGDA-PEGTA curves relative to the PEGDA control trendline were statistically indistinguishable), suggesting that the two SRS interact with the PEGDA hydrogel structure in a similar fashion. Recent small-angle X-ray scattering data of PEGDA hydrogels cured by free radical polymerization have revealed that these hydrogels form as nanostructures composed of PEG macromer chains spaced between high functionality crosslinked domains, as shown schematically in Figure 9A.46 In light of the present data, we hypothesize that the SRS (i.e. NVP, PEGTA) participate in the crosslink junctions in the dense PEGDA regions and perhaps contribute to increased PEGDA densification in these nanostructures (Figure 9B). Such incorporation would result in a denser network in the PEGDA nanostructures, thus enhancing the elastic modulus of the hydrogels and reducing the bulk average mesh size. When the SRS impacts modulus to a greater, or at least similar degree, as mesh size, significant shifts in the E-ξ curve from that of pure PEGDA controls may be observed.
Figure 9.
Schematic representation which indicates the hypothetical manner in which secondary reactive species (SRS) may interact with the PEGDA hydrogel network structure at the nanoscale. (A) A schematic representation of a pure PEGDA hydrogel network, with nanoscale regions of PEGDA densification which include crosslink junctions (adapted from Waters et al., 2010); (B) We hypothesize that the SRS participate in the crosslink junctions in the dense PEGDA regions and perhaps contribute to increased PEGDA densification. In pure PEGDA hydrogels, the acrylate groups (hydrophobic regions of the PEGDA molecules) bend the PEGDA chains, creating micelles. The grouped acrylate moieties then participate in the formation of crosslink junctions. Given the fact that the acrylate groups will have higher affinity for NVP or the dense, tetraacrylated molecule PEGTA than for water molecules, the presence of these SRS molecules can serve as a nucleation points, bringing additional PEGDA chains in close proximity and increasing the density of the polymer within the nanoscale aggregates. The inset in (C) shows a magnified schematic of a nanoscale PEGDA aggregate in a PEGDA control hydrogel and the inset in (D) shows a nanoscale aggregate in which the SRS (red) has increased the density of the PEGDA chains (blue) at the crosslink junctions.
In summary, the results from this study open the possibility of identifying a range of PEGDA hydrogels with similar mesh size but distinct moduli (or vice versa), even at intermediate modulus and mesh size conditions. These results should enable controlled mechanobiology studies investigating specific effects of modulus on cells cultured within 3D environments. In addition, the current results should advance the design of drug delivery hydrogels in cases where specific mechanical properties must be maintained. Future studies will focus on confirming the mechanism by which NVP and PEGTA interact with the PEGDA hydrogel structure to result in the observed shifts in the PEGDA-SRS hydrogel modulus-mesh curves.
5. CONCLUSIONS
This study demonstrated that inclusion of NVP or PEGTA at sufficient levels can result in the emergence of a number of PEGDA hydrogel modulus ranges over which consistent mesh size is achieved (and vice versa). In contrast to previous studies that have investigated only a limited set of SRS-incorporated hydrogel formulations, the extensive libraries examined in the current work (encompassing over 100 distinct hydrogel formulations) indicate that a number of modulus ranges between ~200–350 kPa all the way ~10–75 kPa can be probed without significant changes in the average mesh size. Similarly, mesh size ranges which could be investigated without substantially impacting elastic modulus include 23.0–40.0 nm all the way down to 7.5–11.0 nm. Finally, both NVP and PEGTA resulted in this broadening of the PEGDA hydrogel properties while maintaining the biological “blank slate” character of pure PEGDA hydrogels and, in the case of PEGTA, with minimal alteration in hydrogel chemistry relative to pure PEGDA hydrogels.
HIGHLIGHTS.
We examined the effects of the incorporation of NVP and PEGTA as secondary reactive species (SRS) within PEGDA hydrogel networks
NVP and PEGTA both caused in substantive shifts in the modulus-mesh size curves of PEGDA hydrogels, resulting in apparent decoupling between modulus and mesh size over a number of physical property ranges
The effects of both NVP and PEGTA on apparent decoupling were dose dependent
Acknowledgments
We would like to acknowledge the NSF DMR CAREER Award 1346807, NIH R01 EB013297, and the NIH R03 EB0152167 for funding.
Footnotes
Publisher's Disclaimer: This is a PDF file of an unedited manuscript that has been accepted for publication. As a service to our customers we are providing this early version of the manuscript. The manuscript will undergo copyediting, typesetting, and review of the resulting proof before it is published in its final citable form. Please note that during the production process errors may be discovered which could affect the content, and all legal disclaimers that apply to the journal pertain.
References
- 1.Buxton AN, Zhu J, Marchant R, West JL, Yoo JU, Johnstone B. Design and characterization of poly(ethylene glycol) photopolymerizable semi-interpenetrating networks for chondrogenesis of human mesenchymal stem cells. Tissue Eng. 2007;13(10):2549–2560. doi: 10.1089/ten.2007.0075. [DOI] [PubMed] [Google Scholar]
- 2.Ingavle GC, Gehrke SH, Detamore MS. The bioactivity of agarose–PEGDA interpenetrating network hydrogels with covalently immobilized RGD peptides and physically entrapped aggrecan. Biomaterials. 2014;35(11):3558–3570. doi: 10.1016/j.biomaterials.2014.01.002. [DOI] [PMC free article] [PubMed] [Google Scholar]
- 3.Nemir S, Hayenga HN, West JL. PEGDA hydrogels with patterned elasticity: Novel tools for the study of cell response to substrate rigidity. Biotechnol Bioeng. 2010;105(3):636–644. doi: 10.1002/bit.22574. [DOI] [PubMed] [Google Scholar]
- 4.Nguyen QT, Hwang Y, Chen AC, Varghese S, Sah RL. Cartilage-like mechanical properties of poly (ethylene glycol)-diacrylate hydrogels. Biomaterials. 2012;33(28):6682–6690. doi: 10.1016/j.biomaterials.2012.06.005. [DOI] [PMC free article] [PubMed] [Google Scholar]
- 5.Hubbell JA. Bioactive biomaterials. Curr Opin in Biotechnol. 1999;10(2):123–129. doi: 10.1016/s0958-1669(99)80021-4. [DOI] [PubMed] [Google Scholar]
- 6.Gombotz WR, Guanghui W, Horbett TA, Hoffman AS. Protein adsorption to poly(ethylene oxide) surfaces. J Biomed Mater Res. 1991;25(12):1547–1562. doi: 10.1002/jbm.820251211. [DOI] [PubMed] [Google Scholar]
- 7.Williams CG, Kim TK, Taboas A, Malik A, Manson P, Elisseeff J. In vitro chondrogenesis of bone marrow-derived mesenchymal stem cells in a photopolymerizing hydrogel. Tissue Eng. 2003;9(4):679–688. doi: 10.1089/107632703768247377. [DOI] [PubMed] [Google Scholar]
- 8.Nuttelman CR, Tripodi MC, Anseth KS. Synthetic hydrogel niches that promote hMSC viability. Matrix Biol. 2005;24(3):208–218. doi: 10.1016/j.matbio.2005.03.004. [DOI] [PubMed] [Google Scholar]
- 9.Benoit DSW, Schwartz MP, Durney AR, Anseth KS. Small functional groups for controlled differentiation of hydrogel-encapsulated human mesenchymal stem cells. Nat Mater. 2008;7(10):816–823. doi: 10.1038/nmat2269. [DOI] [PMC free article] [PubMed] [Google Scholar]
- 10.Becerra-Bayona S, Guiza-Arguello V, Qu X, Munoz-Pinto DJ, Hahn MS. Influence of select extracellular matrix proteins on mesenchymal stem cell osteogenic commitment in three-dimensional contexts. Acta Biomater. 2012;8(12):4397–4404. doi: 10.1016/j.actbio.2012.07.048. [DOI] [PMC free article] [PubMed] [Google Scholar]
- 11.Knop K, Hoogenboom R, Fischer D, Schubert US. Poly(ethylene glycol) in drug delivery: pros and cons as well as potential alternatives. Angew Chem Int Ed Engl. 2010;49(36):6288–308. doi: 10.1002/anie.200902672. [DOI] [PubMed] [Google Scholar]
- 12.Bryant SJ, Anseth KS. Hydrogel properties influence ECM production by chondrocytes photoencapsulated in poly(ethylene glycol) hydrogels. Journal of Biomedical Materials Research. 2002;59(1):63–72. doi: 10.1002/jbm.1217. [DOI] [PubMed] [Google Scholar]
- 13.Lin S, Sangaj N, Razafiarison T, Zhang C, Varghese S. Influence of Physical Properties of Biomaterials on Cellular Behavior. Pharm Res. 2011;28(6):1422–1430. doi: 10.1007/s11095-011-0378-9. [DOI] [PMC free article] [PubMed] [Google Scholar]
- 14.Anseth KS, Metters AT, Bryant SJ, Martens PJ, Elisseeff JH, Bowman CN. In situ forming degradable networks and their application in tissue engineering and drug delivery. J Control Release. 2002;78(1–3):199–209. doi: 10.1016/s0168-3659(01)00500-4. [DOI] [PubMed] [Google Scholar]
- 15.Elliott JE, Anseth JW, Bowman CN. Kinetic modeling of the effect of solvent concentration on primary cyclization during polymerization of multifunctional monomers. Chem Eng Sci. 2001;56(10):3173–3184. [Google Scholar]
- 16.Cruise GM, Scharp DS, Hubbell JA. Characterization of permeability and network structure of interfacially photopolymerized poly(ethylene glycol) diacrylate hydrogels. Biomaterials. 1998;19(14):1287–1294. doi: 10.1016/s0142-9612(98)00025-8. [DOI] [PubMed] [Google Scholar]
- 17.Hagel V, Haraszti T, Boehm H. Diffusion and interaction in PEG-DA hydrogels. Biointerphases. 2013;8(1):36. doi: 10.1186/1559-4106-8-36. [DOI] [PubMed] [Google Scholar]
- 18.Schweller RM, West JL. Encoding Hydrogel Mechanics via Network Cross-Linking Structure. ACS Biomater Sci & Eng. 2015 doi: 10.1021/acsbiomaterials.5b00064. [DOI] [PMC free article] [PubMed] [Google Scholar]
- 19.Bryant S, Chowdhury T, Lee D, Bader D, Anseth K. Crosslinking Density Influences Chondrocyte Metabolism in Dynamically Loaded Photocrosslinked Poly(ethylene glycol) Hydrogels. Ann of Biomed Eng. 2004;32(3):407–417. doi: 10.1023/b:abme.0000017535.00602.ca. [DOI] [PubMed] [Google Scholar]
- 20.Liao H, Munoz-Pinto D, Qu X, Hou Y, Grunlan MA, Hahn MS. Influence of hydrogel mechanical properties and mesh size on vocal fold fibroblast extracellular matrix production and phenotype. Acta Biomater. 2008;4(5):1161–1171. doi: 10.1016/j.actbio.2008.04.013. [DOI] [PMC free article] [PubMed] [Google Scholar]
- 21.Munoz-Pinto DJ, Bulick AS, Hahn MS. Uncoupled investigation of scaffold modulus and mesh size on smooth muscle cell behavior. J Biomed Mater Res A. 2009;90(1):303–316. doi: 10.1002/jbm.a.32492. [DOI] [PubMed] [Google Scholar]
- 22.Wang X, Boire TC, Bronikowski C, Zachman AL, Crowder SW, Sung HJ. Decoupling polymer properties to elucidate mechanisms governing cell behavior. Tissue Eng Part B Rev. 2012;18(5):396–404. doi: 10.1089/ten.teb.2012.0011. [DOI] [PMC free article] [PubMed] [Google Scholar]
- 23.Browning MB, Wilems T, Hahn M, Cosgriff-Hernandez E. Compositional control of poly(ethylene glycol) hydrogel modulus independent of mesh size. J Biomed Mater Res A. 2011;98A(2):268–273. doi: 10.1002/jbm.a.33109. [DOI] [PubMed] [Google Scholar]
- 24.Cha C, Jeong JH, Shim J, Kong H. Tuning the dependency between stiffness and permeability of a cell encapsulating hydrogel with hydrophilic pendant chains. Acta Biomater. 2011;7(10):3719–3728. doi: 10.1016/j.actbio.2011.06.017. [DOI] [PubMed] [Google Scholar]
- 25.Hahn MS, Taite LJ, Moon JJ, Rowland MC, Ruffino KA, West JL. Photolithographic patterning of polyethylene glycol hydrogels. Biomaterials. 2006;27(12):2519–2524. doi: 10.1016/j.biomaterials.2005.11.045. [DOI] [PubMed] [Google Scholar]
- 26.Hou Y, Schoener CA, Regan KR, Munoz-Pinto D, Hahn MS, Grunlan MA. Photo-crosslinked PDMS(star)-PEG Hydrogels: Synthesis, Characterization, and Potential Application for Tissue Engineering Scaffolds. Biomacromolecules. 2010;11(3):648–656. doi: 10.1021/bm9012293. [DOI] [PMC free article] [PubMed] [Google Scholar]
- 27.Mann BK, West JL. Cell adhesion peptides alter smooth muscle cell adhesion, proliferation, migration, and matrix protein synthesis on modified surfaces and in polymer scaffolds. J Biomed Mater Res. 2002;60(1):86–93. doi: 10.1002/jbm.10042. [DOI] [PubMed] [Google Scholar]
- 28.Dumanian GA, Dascombe W, Hong C, Labadie K, Garrett K, Sawhney AS, Pathak CP, Hubbell JA, Johnson PC. A New Photopolymerizable Blood Vessel Glue that Seals Human Vessel Anastomoses Without Augmenting Thrombogenicity. Plast Reconst Surg. 1995;95(5):901–907. [PubMed] [Google Scholar]
- 29.Zhu J. Bioactive modification of poly(ethylene glycol) hydrogels for tissue engineering. Biomaterials. 2010;31(17):4639–4656. doi: 10.1016/j.biomaterials.2010.02.044. [DOI] [PMC free article] [PubMed] [Google Scholar]
- 30.Dai X, Chen X, Yang L, Foster S, Coury AJ, Jozefiak TH. Free radical polymerization of poly(ethylene glycol) diacrylate macromers: Impact of macromer hydrophobicity and initiator chemistry on polymerization efficiency. Acta Biomater. 2011;7(5):1965–1972. doi: 10.1016/j.actbio.2011.01.005. [DOI] [PubMed] [Google Scholar]
- 31.Engler AJ, Sen S, Sweeney HL, Discher DE. Matrix Elasticity Directs Stem Cell Lineage Specification. Cell. 2006;126(4):677–689. doi: 10.1016/j.cell.2006.06.044. [DOI] [PubMed] [Google Scholar]
- 32.Gill BJ, Gibbons DL, Roudsari LC, Saik JE, Rizvi ZH, Roybal JD, Kurie JM, West JL. A synthetic matrix with independently tunable biochemistry and mechanical properties to study epithelial morphogenesis and EMT in a lung adenocarcinoma model. Cancer research. 2012;72(22):6013–6023. doi: 10.1158/0008-5472.CAN-12-0895. [DOI] [PMC free article] [PubMed] [Google Scholar]
- 33.Ananthanarayanan B, Kim Y, Kumar S. Elucidating the mechanobiology of malignant brain tumors using a brain matrix-mimetic hyaluronic acid hydrogel platform. Biomaterials. 2011;32(31):7913–7923. doi: 10.1016/j.biomaterials.2011.07.005. [DOI] [PMC free article] [PubMed] [Google Scholar]
- 34.Guelcher SA, Sterling JA. Contribution of bone tissue modulus to breast cancer metastasis to bone. Cancer Microenviron. 2011;4(3):247–259. doi: 10.1007/s12307-011-0078-3. [DOI] [PMC free article] [PubMed] [Google Scholar]
- 35.Munoz-Pinto DJ, McMahon RE, Kanzelberger MA, Jimenez-Vergara AC, Grunlan MA, Hahn MS. Inorganic–organic hybrid scaffolds for osteochondral regeneration. J Biomed Mater Res A. 2010;94A(1):112–121. doi: 10.1002/jbm.a.32695. [DOI] [PubMed] [Google Scholar]
- 36.Watkins AW, Anseth KS. Investigation of molecular transport and distributions in poly(ethylene glycol) hydrogels with confocal laser scanning microscopy. Macromolecules. 2005;38(4):1326–1334. [Google Scholar]
- 37.Ford MC, Bertram JP, Hynes SR, Michaud M, Li Q, Young M, Segal SS, Madri JA, Lavik EB. A macroporous hydrogel for the coculture of neural progenitor and endothelial cells to form functional vascular networks in vivo. Proc Natl Acad Sci U S A. 2006;103(8):2512–2517. doi: 10.1073/pnas.0506020102. [DOI] [PMC free article] [PubMed] [Google Scholar]
- 38.Flory PJ. Principles of polymer chemistry. Cornell University Press; 1953. [Google Scholar]
- 39.Bray JC, Merrill EW. Poly (vinyl alcohol) hydrogels for synthetic articular cartilage material. J Biomed Mater Res. 1973;7(5):431–443. doi: 10.1002/jbm.820070506. [DOI] [PubMed] [Google Scholar]
- 40.Canal T, Peppas NA. Correlation between mesh size and equilibrium degree of swelling of polymeric networks. J Biomed Mater Res. 1989;23(10):1183–1193. doi: 10.1002/jbm.820231007. [DOI] [PubMed] [Google Scholar]
- 41.Munoz-Pinto DJ, Jimenez-Vergara AC, Gharat TP, Hahn MS. Characterization of sequential collagen-poly(ethylene glycol) diacrylate interpenetrating networks and initial assessment of their potential for vascular tissue engineering. Biomaterials. 2015;40(0):32–42. doi: 10.1016/j.biomaterials.2014.10.051. [DOI] [PMC free article] [PubMed] [Google Scholar]
- 42.Peppas NA, Merrill EW. Crosslinked poly(vinyl alcohol) hydrogels as swollen elastic networks. J Appl Polym Sci. 1977;21(7):1763–1770. [Google Scholar]
- 43.Anseth KS, Bowman CN, Brannon-Peppas L. Mechanical properties of hydrogels and their experimental determination. Biomaterials. 1996;17(17):1647–1657. doi: 10.1016/0142-9612(96)87644-7. [DOI] [PubMed] [Google Scholar]
- 44.Kang F, Zhong-Ci S. Mathematical theory of elastic structures. Springer; 1996. [Google Scholar]
- 45.Bryant SJ, Anseth KS. Photopolymerization of hydrogel scaffolds. Marcel Dekker, Inc; 2006. pp. 1–21. [Google Scholar]
- 46.Waters DJ, Engberg K, Parke-Houben R, Hartmann L, Ta CN, Toney MF, Frank CW. Morphology of Photopolymerized End-Linked Poly(ethylene glycol) Hydrogels by Small-Angle X-ray Scattering. Macromolecules. 2010;43(16):6861–6870. doi: 10.1021/ma101070s. [DOI] [PMC free article] [PubMed] [Google Scholar]


