

SUMMARY
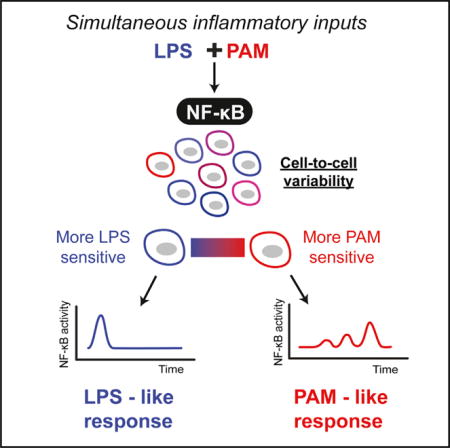
Cells receive a multitude of signals from the environment, but how they process simultaneous signaling inputs is not well understood. Response to infection, for example, involves parallel activation of multiple Toll-like receptors (TLRs) that converge on the nuclear factor κB (NF-κB) pathway. Although we increasingly understand inflammatory responses for isolated signals, it is not clear how cells process multiple signals that co-occur in physiological settings. We therefore examined a bacterial infection scenario involving co-stimulation of TLR4 and TLR2. Independent stimulation of these receptors induced distinct NF-κB dynamic profiles, although surprisingly, under co-stimulation, single cells continued to show ligand-specific dynamic responses characteristic of TLR2 or TLR4 signaling rather than a mixed response, comprising a cellular decision that we term “non-integrative” processing. Iterating modeling and microfluidic experiments revealed that non-integrative processing occurred through interaction of switch-like NF-κB activation, receptor-specific processing timescales, cell-to-cell variability, and TLR cross-tolerance mediated by multilayer negative feedback.
Graphical abstract
INTRODUCTION
Cells process signals through shared signaling networks that relay information from outside the cell to make decisions. Although cells can handle a remarkable number of parallel signals, it is not well understood how cells process distinct simultaneous inputs through the same pathway. Signaling pathways mediate gene regulation through dynamic activation of transcription factors, and transcription factor dynamics transmit stimulus information through specific gene expression responses to distinct pathway inputs (Behar et al., 2013; Cheong et al., 2011; Selimkhanov et al., 2014). For example, in the nuclear factor κB (NF-κB) system, distinct responses to lipopolysaccharide (LPS) and tumor necrosis factor (TNF) occur due to altered dynamic profiles of IκB kinase (IKK) and NF-κB activation (Werner et al., 2005). Therefore, signaling dynamics mediate ligand-specific responses through the NF-κB pathway.
Cells increase decision robustness in the presence of noise through switch-like responses (Ferrell and Machleder, 1998; Liu et al., 2014; Malleshaiah et al., 2010; Shah and Sarkar, 2011). The NF-κB system exhibits switch-like activation at the single cell level in B and T cells in addition to non-immune cells (Kingeter et al., 2010; Shinohara et al., 2014; Tay et al., 2010). We recently showed that integration of signal intensity and duration determines the probability of NF-κB switch activation (Kellogg et al., 2015). During infection, multiple pathogen-associated molecules activate NF-κB through Toll-like receptor signaling (Akira and Takeda, 2004; Takeda and Akira, 2005). For example, Toll-like receptor (TLR)4 and TLR2 recognize different cell wall components during bacterial infection and may be activated simultaneously, sharing the same downstream NF-κB signal processing apparatus (Kopp and Medzhitov, 2003; Takeuchi et al., 1999). While NF-κB exhibits switch-like response to single ligands in isolation, it is not clear how switch-like activation occurs in the physiological situation of multiple simultaneous pathogen-associated input signals to the NF-κB pathway.
To study information processing through the NF-κB pathway under multiple concurrent input signals, we used an automated microfluidic cell culture platform to generate combinatorial TLR2 and TLR4 pathway stimulation and monitored NF-κB dynamics by live imaging (Kellogg et al., 2014). Lipoglycans and bacterial lipoproteins make up the cell wall of bacteria and simultaneous delivery of these two inputs to mammalian cells simulates an infection scenario (Philpott and Girardin, 2004). We found that when TLR4 and TLR2 were stimulated independently by specific agonists ultrapure-LPS for TLR4 and Pam3CSK4 (PAM) a synthetic triacylated lipopeptide for TLR2 activation, distinct (“LPS-like” or “PAM-like”) dynamic NF-κB profiles appeared in single cells. Surprisingly, under TLR2-TLR4 co-stimulation, we discovered that most single cells exhibited an NF-κB response characteristic of either TLR4 activation or TLR2 activation, rather than a response combining dynamic features of both pathways. These results suggest that switch-like activation enables cells to respond with a dynamic signature corresponding to a specific ligand although multiple are present.
RESULTS
Independent TLR Stimulation Induces Distinct NF-κB Dynamic Signatures in Single Cells
We first asked whether different bacteria-associated molecules induce distinct NF-κB dynamics (Ozinsky et al., 2000; Takeda and Akira, 2005). Both TLR2 and TLR4 activate the NF-κB pathway via adaptor proteins including TRAF6 to induce IKK activation, which causes degradation of inhibitor of κB (IκB) and NF-κB translocation from the cytoplasm to the nucleus. NF-κB induces expression of hundreds of genes including its inhibitor IκB, creating negative feedback and oscillations in cytoplasm-nucleus NF-κB translocation (Hoffmann et al., 2002). Because dynamics of transcription factor activation were previously shown to encode stimulus-specific information (Behar et al., 2013; Caldwell et al., 2014; Selimkhanov et al., 2014; Werner et al., 2005), we hypothesized that different TLR ligands would induce distinct NF-κB dynamic profiles.
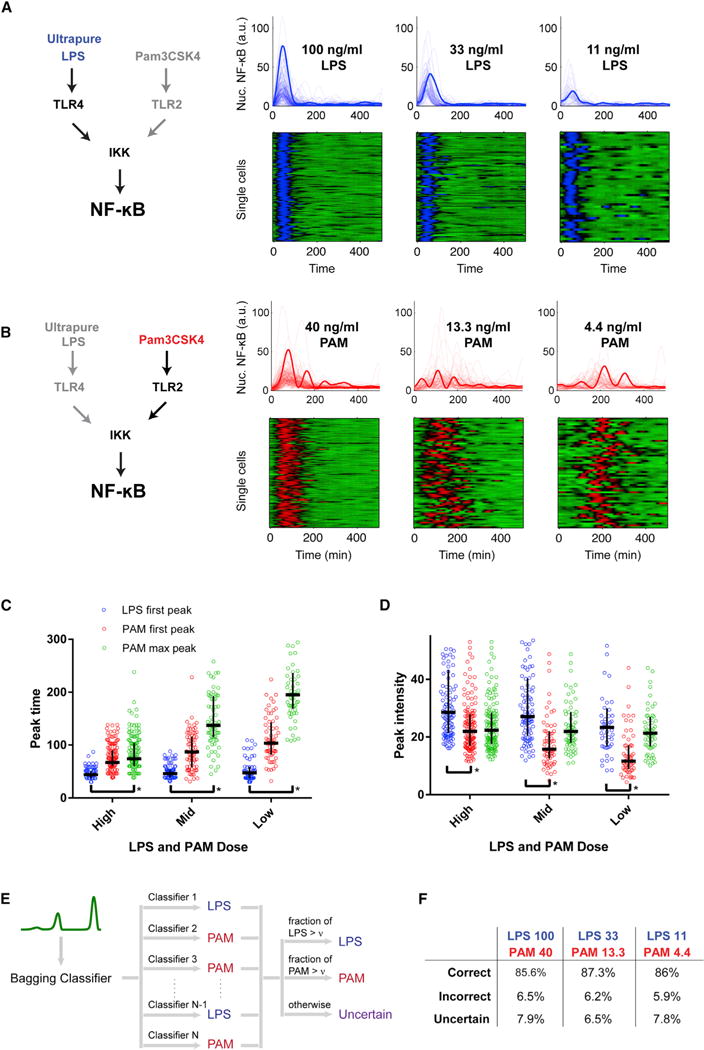
We independently activated TLR4 or TLR2 using ultrapure LPS (LPS) or PAM, respectively, at three dose levels for each ligand (Figures 1A and 1B) spanning the physiological response range (Simmons et al., 2010; Tay et al., 2010). We applied these six conditions using microfluidic cell culture (Gómez-Sjöberg et al., 2007; Kellogg et al., 2014; Kellogg and Tay, 2015) and observed NF-κB cytoplasm-nucleus translocation dynamics by live imaging in single mouse fibroblast cells expressing NFκB(p65)-DsRed fusion protein at near-endogenous levels (Tay et al., 2010). LPS stimulation activating only TLR4 led to a single-peak response with decreasing amplitude and cell-to-cell timing variability with lower dose (Figures 1A, 1C, and 1D). In contrast, PAM stimulation causing TLR2 activation led to markedly variable dynamics between cells, with a pronounced delay with decreased dose. While PAM activated all cells, LPS activated a fraction of the population in the concentrations tested (Table S6). Moreover, the low-dose PAM response exhibited oscillations with increasing amplitude over time, followed by a rapid shut-off in the NF-κB response 300–400 min post-stimulus (Figures 1B–1D).
Figure 1. Distinct NF-κB Pathway Dynamics Induced by TLR4 and TLR2 Engagement.
Ultrapure LPS (LPS) and PAM that activate TLR4 and TLR2, respectively, were applied in three concentrations to fibroblasts using automated microfluidic cell culture, and NF-κB dynamic activation was measured in single cells by live-cell microscopy.
(A) Single-cell NF-κB dynamic profiles of cells stimulated with LPS in microfluidic chambers, shown in line plots (upper row) and heatplots (lower row). Each row of the heatplot corresponds to one cell, with color indicating nuclear NF-κB (green, low; blue, high). As ultrapure dose decreases, there is a corresponding decrease in response amplitude (bolded line, example cell in each dose condition). Only nuclear NF-κB time courses of active cells are plotted in the heatplot.
(B) Single-cell NF-κB dynamic profiles of cells stimulated with PAM in microfluidic chambers, shown in line plots (upper row) and heatplots (lower row). Each row of the heatplot corresponds to one cell, with color indicating nuclear NF-κB (green, low; red, high). PAM input leads to markedly different NF-κB dynamics, with strong delay and increasing peak amplitude with decreasing dose (bolded line, example cell in each dose condition).
(C and D) Quantification of dynamic features of the LPS and PAM response. The horizontal and vertical bars represent median and interquartile range, respectively. (C) Comparison of response timing between LPS and PAM input. With decreasing dose, PAM first peak and maximum amplitude peak occur with greater delay compared to LPS response. In the case of LPS, the first peak is also the maximum peak in all cells. First peak amplitude and max peak time distinguish LPS and PAM responses. *Statistical significance with p < 0.001 by Mann-Whitney test. (D) Difference between NF-κB peak first and maximum peak amplitude becomes more pronounced at lower PAM/LPS dose. LPS first peak response amplitude decreases significantly while PAM first peak amplitude decreases as well. LPS fraction of active cells decreased while PAM caused activation in essentially all cells in this dose range. At low/medium dose the LPS and PAM dynamics appear distinguished by the delay and rising nature of amplitude in the PAM response.
(E) To test the separability of the two responses, we applied a classification approach. A bagging classifier is an ensemble of decision tree models, where each decision-tree model determines whether a test trajectory is more similar to LPS-like or PAM-like. The bagging classifier classifies as LPS-like (PAM-like) response if most decision trees agree (with more than ν fraction). Otherwise the bagging classifier outputs “Uncertain.”
(F) The two responses types are highly distinguishable based on classification, with >80% correctly assigned and the remainder uncertain.
We sought to test whether LPS- and PAM-specific responses are distinguishable based on single-cell NF-κB dynamics. We trained a classifier using the experimental trajectories for LPS and PAM responses at each dose level and asked whether test trajectories could be correctly separated into “LPS-like” or “PAM-like” classes (Dietterich, 2000) (Figure 1E; Supplemental Experimental Procedures). In the classification approach (called a bagging classifier), an ensemble of decision trees determines whether a test trajectory is more similar to LPS-like, PAM-like, or uncertain (interpreted as mixed response) (Figure S1). We used artificial “mixed” trajectories to check for classifier bias (Figures S1D and S1E). This analysis found that NF-κB trajectories could be reliably separated into LPS-like or PAM-like classes, with ~85% of the single-cell traces correctly discriminated and less than 10% having uncertain or mixed classification (Figure 1F). These results indicate that distinct NF-κB dynamics encode TLR2 (PAM) and TLR4 (LPS) pathway stimulation.
Distinct TLR-NF-κB Profiles Arise through Receptor-Specific Processing and Feedback Dynamics
To understand how TLR-specific NF-κB dynamics arise, we expanded our previous model of LPS/TLR4-mediated NF-κB signaling to additionally incorporate the PAM/TLR2 pathway branch (Kellogg et al., 2015). At the receptor level, TLR4 and TLR2 have similar structure: both receptor groups signal through MyD88 and TRAF6 to cause IKK and NF-κB activation (Figure 2E). While LPS initiates MyD88 signaling from the cell membrane, PAM signaling initiates MyD88 signaling from endosomes following receptor-ligand internalization (Brandt et al., 2013; Dietrich et al., 2010; Stack et al., 2014). Model with slowed accumulation of TRAF6 in TLR2 signaling due to endosomal processing reproduced the increasing-amplitude NF-κB oscillations observed experimentally (Figure 2A).
Figure 2. Receptor-Level Activation and Negative Feedback Dynamics Distinguish LPS versus PAM NF-κB Response.
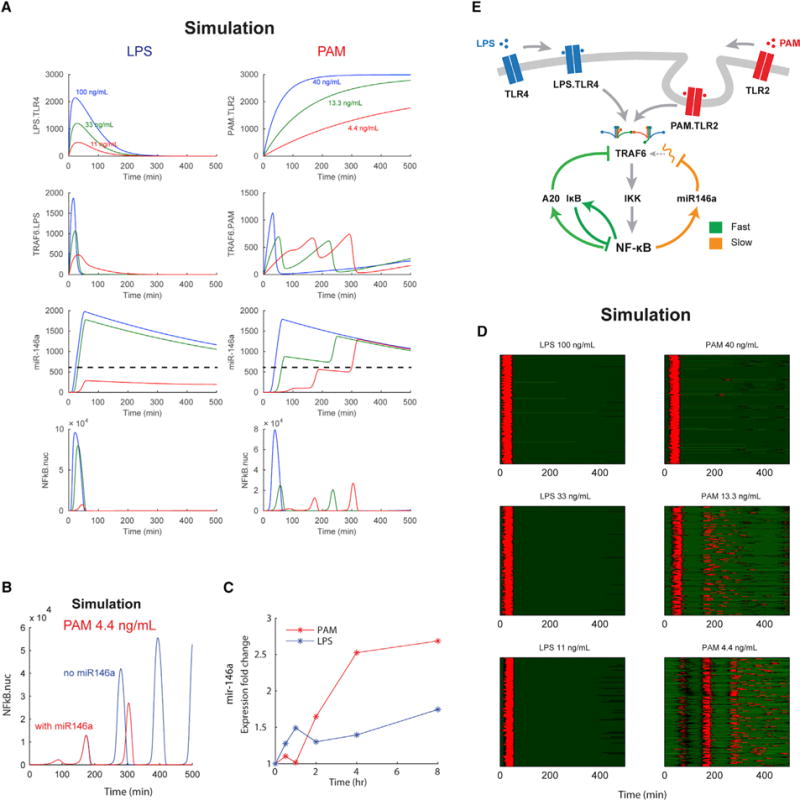
(A) NF-κB system dynamics for LPS and PAM at the experimentally tested doses. LPS bound to receptor (LPS.TLR4) complexes on the cell membrane under LPS activation lead to rapid TRAF6 induction and NF-κB activation. Under PAM stimulation, upstream endosomal signaling leads to rising accumulation of TRAF6 over time and increasing amplitude in the NF-κB response over time for low-dose PAM. Dashed line indicates the threshold level of mir-146a required to cause pathway inhibition.
(B) Simulations showed that low-dose PAM (4.4 ng/mL) caused an increasing amplitude response with rapid response shut-off at 300–400 min. We hypothesized that an unaccounted for negative feedback in the pathway could mediate this effect.
(C) Expression of mir-146a following 10 ng/mL LPS and 10 ng/mL PAM stimulation using a miR-146a TaqMan real-time PCR assay. Mir-146a is induced by both LPS and PAM stimulation, although with differing temporal profiles for the respective inputs. In contrast to rapid IκB/A20 feedback, mir-146a induction occurs on a slower timescale and maintains high expression.
(D) Heatplots of simulation cell populations for LPS and PAM inputs, showing good agreement with experimental data (Figures 1A and 1B). Only active cells are plotted in the heatplots.
(E) NF-κB model schematic. TLR2 and TLR4 signal along the MyD88 pathway to activate TRAF6 and IKK. Clustering of TRAF6 and adaptor proteins leads to cooperative IKK induction. IKK activates NF-κB and negative feedback through IκBα, A20, and miR-146a. The TLR2 pathway requires endosomal processing for signal transduction, while TLR4 initiates signaling from the cell surface (Brandt et al., 2013; Stack et al., 2014). While IκB is the principal “fast” feedback, mir-146a mediates “slow” and ultrasensitive negative feedback that prevents continued growth of NF-κB oscillations under low-dose PAM input. PAM dose determines accumulation rate of PAM.TLR2 complexes.
Our initial model did not reproduce the abrupt shut off in TLR2-induced NF-κB dynamics at ~300–400 min post-stimulus and instead showed continuing oscillations with growing peak height (Figure 2B). We hypothesized that the response shut off could be due to an unaccounted for negative feedback regulator. One possible candidate is miR-146a, which mediates a recently characterized additional negative feedback in the NF-κB pathway acting to inhibit TRAF6 as a result of NF-κB induction (Nahid et al., 2011, 2009; Quinn et al., 2013; Taganov et al., 2006). miR-146-mediated cleavage of TRAF6 mRNA leads to a rapid loss of TRAF6 protein and attenuated NF-κB response (Nahid et al., 2009). To understand whether miR-146 is active in our cells and contributing to the rapid shut off in NF-κB activity, we measured dynamic induction of this miRNA. We found that both PAM (10 ng/mL) and LPS (10 ng/mL) cause sustained upregulation of miR-146a (Figure 2C). Under LPS, miR-146a was induced starting from 1 hr and under PAM, at ~2 hr post-stimulus. Notably, rather than returning to baseline like IκB and A20 negative feedback regulators, miR-146a maintained a high expression level for several hours (Figure 2C) (Gantier et al., 2011). The timescale of microRNA (miRNA) abundance corresponded with the timing in shutoff of the PAM response (Figure 1B, 2B–C). Incorporating miR-146a in the model as a slow-activating negative feedback, we recapitulated the NF-κB response shutoff observed in experiments (Figures 2A and 2D). Modeling extrinsic noise in receptor levels reproduced experimental cell-to-cell variability in NF-κB dynamics (Eldar and Elowitz, 2010; Elowitz et al., 2002) (Figures 1C,1D, 2D, and S2).
TLR2- and TLR4-Polarized Responses under Co-stimulation in Single-Cell Simulations
Experiments showed that independent TLR4 and TLR2 stimulation induced distinct NF-κB dynamics in single cells, and therefore we used NF-κB dynamics as a lens for exploring how cells process simultaneous TLR inputs. Under TLR2 and TLR4 co-stimulation, the dynamic output could reflect features of both inputs (“integrative” processing), or alternatively the response could correspond to only one of the two inputs (“non-integrative” processing) (Figure 3A).
Figure 3. Relative TLR4-TLR2 Pathway Sensitivity Polarizes Single-Cell Response under Competing Ligands.
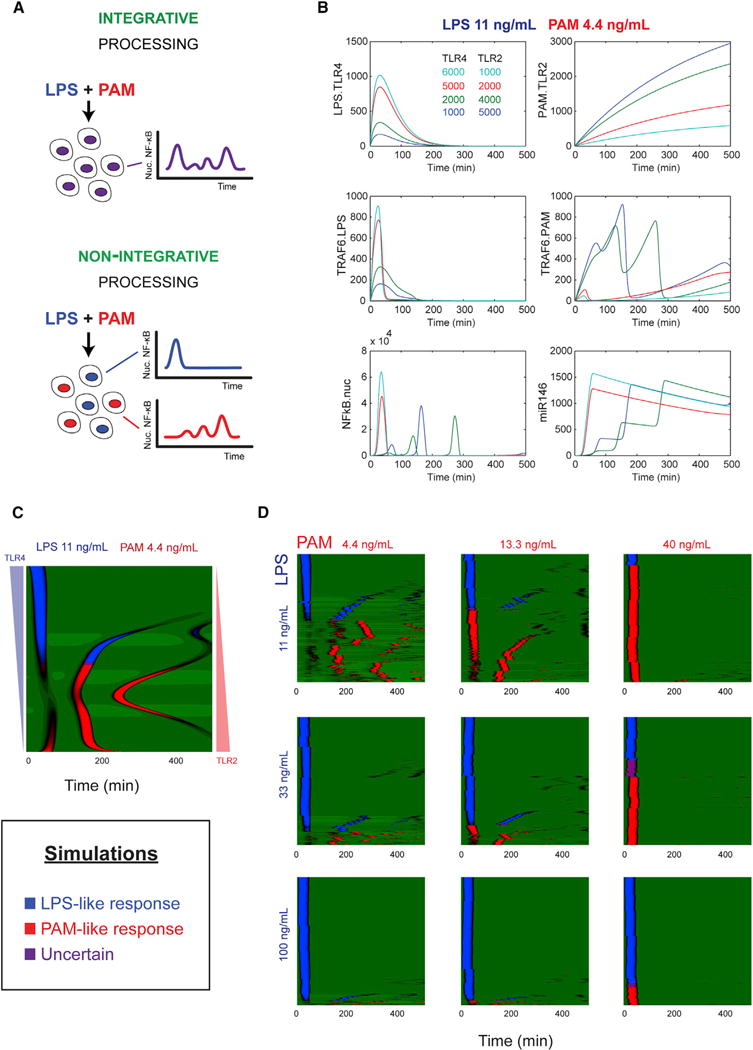
(A) Two possibilities for processing competing input signals. In integrative processing, cells exhibit dynamics that reflect the additive contribution of the two pathways (top). In non-integrative processing, cell response dynamics correspond to only one of the input signals.
(B) Simulations of NF-κB system response under simultaneous LPS/PAM input. As cells become relatively more sensitive for TLR4 or TLR2, the NF-κB response displays a response characteristic of LPS or PAM, respectively.
(C) In simulations of cell populations with cell variability, applying the classifier trained on each input individually shows that the population partitions into those cells responding in an LPS-like fashion and PAM-like fashion, with few cells in the uncertain classification. In the panel, from top to bottom, the number of TLR4 is decreasing and the number of TLR2 is increasing.
(D) Under simulated co-stimulation with LPS and PAM, most cells respond in either LPS-like or PAM-like fashion, in correlation with the relative level of the two inputs.
We reasoned that for multiple competing inputs to a digital pathway, the cell’s response could be influenced by sensitivity of the cell to each of the respective input signals. Intuitively, LPS attempts to active cells first due to delay by endosomal signaling of PAM/TLR2. In cells with high sensitivity to TLR4 ligands, LPS causes a rapid IKK/NF-κB activation and an induction of transient (IκB-mediated) and sustained (miRNA-mediated) negative feedback (Nahid et al., 2011, 2009; Taganov et al., 2006), preventing PAM signaling and allowing cells to only respond to the LPS signal. Meanwhile, in cells where TLR4 activation does not occur (high sensitivity to TLR2 ligands), PAM signaling can proceed and cells exhibit a PAM-like response.
To examine our reasoning, we used our model (Figure 2) to study simultaneous LPS-PAM input (Figure 3A). Simulation with low-dose LPS and low-dose PAM showed that cells with more sensitivity to TLR4 exhibit a single peak non-oscillatory response (characteristic of LPS input), and cells with more sensitivity to TLR2 exhibit a rising-amplitude, oscillatory response (characteristic of PAM input) (Figure 3B). We further simulated 500 cells with sensitivity shifting from TLR4 to TLR2 and applied our classifier to define these trajectories as LPS-like (blue), PAM-like (red), or mixed/uncertain (purple) responses (Figure 3C). This analysis revealed a highly sensitive transition from LPS-like to PAM-like response, indicating that cell response can be polarized to either LPS-like or PAM-like due to extrinsic noise.
Finally, to characterize how signal processing depends on relative dose of two input signals, we simulated NF-κB responses for low, medium, and high LPS-PAM dose combinations. The proportion of cells exhibiting LPS-like (PAM-like) response increased with the relative dose of LPS (PAM) (Figure 3D), and cells exhibiting mixed responses remained in the minority for all dose combinations. Overall, these simulations suggested that cells employ a non-integrative processing mechanism for LPS-PAM co-stimulation.
Non-integrative Processing of Competing Inputs Leads to a Signaling Decision
To experimentally test competing TLR stimulation, we delivered nine LPS-PAM dose combinations in microfluidic cell culture and monitored single-cell NF-κB dynamics using live cell imaging (Figure 4A). We applied bagging classification to classify these traces into LPS-like, PAM-like, and mixed/uncertain classes (Figure 4B), and the fractions for each LPS-PAM dose combination were shown in Figure 4C. Consistent with model simulation, cells tended to show either an LPS-like or a PAM-like response. When both LPS and PAM were delivered at low dose (Figure 4B, upper left panel), LPS-like and PAM-like dynamic responses occurred most notably, and only 15% of cell responses were classified as “mixed/uncertain.” We also observed the dependency of response type on the input dose (Figure 4C) as found in the model (Figure 3D). For example, as LPS concentration decreased from high to low while maintaining low PAM dose, the fraction of cells showing LPS-like dynamics decreases from ~90% to ~40% of cells in the population (Figures 4B and 4C). These results provide experimental evidence of non-integrative processing of multiple simultaneous input signals.
Figure 4. Experimentally Observed Non-integrative Processing of Simultaneous TLR Signals.
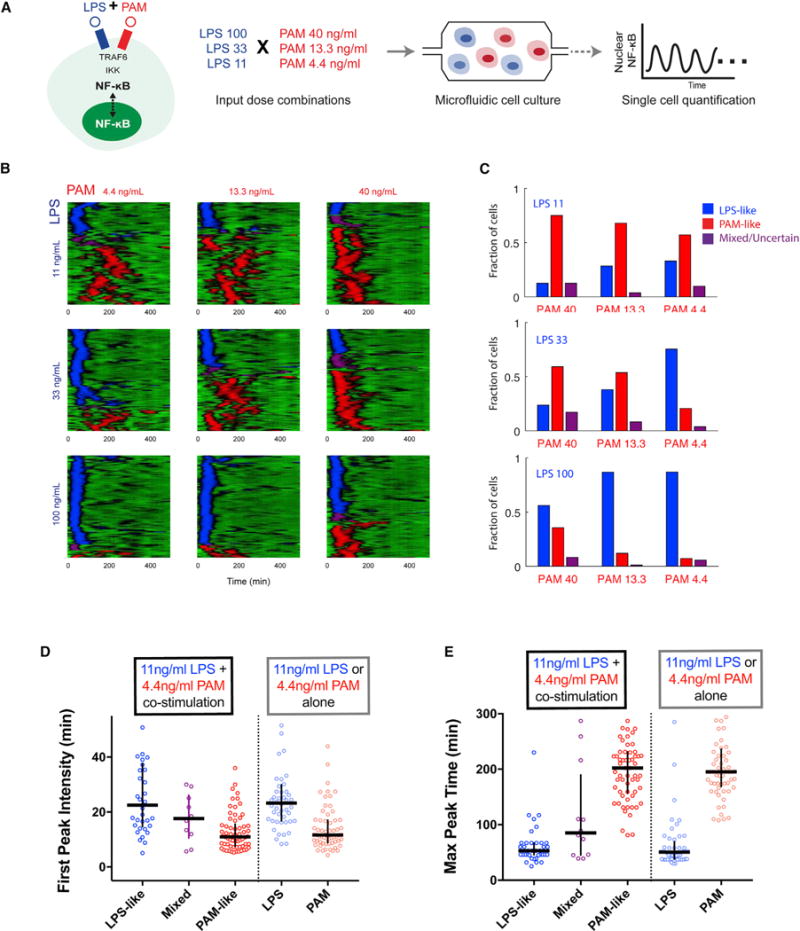
(A) Experimental scheme for testing competing LPS and PAM input signals. Using microfluidic cell culture, we deliver nine combinations of mixed LPS-PAM concentrations and record dynamic NF-κB activation by live imaging.
(B) Single-cell traces under combined inputs displayed in heatplot form with single-cell temporal trajectories displayed in horizontal lines. The class of each response is colored blue for LPS-like, red for PAM-like, and purple for mixed/uncertain. We observe a low occurrence of mixed responses and single-cell responses tend to belong to either LPS or PAM classes.
(C) Comparison of the proportion of cells showing LPS-like, PAM-like, and uncertain responses for each LPS-PAM input. The proportion of cells showing LPS-like response increases with relatively greater LPS concentration while more cells respond in PAM-like with relatively greater PAM concentration.
(D and E) Comparison of LPS-like (PAM-like) classes under co-stimulation to LPS (PAM) stimulation alone. LPS-like and PAM-like classes differ significantly in both first peak intensity (D) and max peak time (E) (p < 0.0001 by Mann-Whitney test). Furthermore, no significant difference exists between LPS-like (PAM-like) class under co-stimulation versus PAM (LPS) stimulation alone (Table S9). Horizontal line, median; vertical line, interquartile range.
We compared NF-κB response characteristics for LPS-like and PAM-like classes and to NF-κB dynamics induced by LPS and PAM stimulation alone. LPS and PAM show statistically distinct first peak intensity and maximum peak response time, and there is no significant difference in first peak intensity or maximum peak time between LPS-like (PAM-like) response classes compared to LPS (PAM) stimulation alone (Figures 4D, 4E, and S4; Tables S8 and S9). This analysis provides further support of distinct LPS- and PAM-like responses under co-stimulation.
Due to sustained negative feedback by candidate regulators such as mir-146a, we expected that cells activated by one input could show tolerance to another signal delivered several hours later. We tested this idea with a repeated stimulation strategy (Figure 5A): first an LPS stimulus, followed by a PAM stimulus 2 hr later to the same cells. Simulation indicated that a low-dose (11 ng/mL) LPS stimulus would activate approximately half of the cells in the population and the remaining cells would respond to a medium-dose PAM stimulus (13.3 ng/mL) 2 hr later (Figure 5B). Indeed, experiments found that 53% of cells responded to the first LPS stimulus and an additional 30% responded to the second PAM stimulus. Only 17% of cells responded to both stimuli, indicating that rapid negative feedback induced by the LPS signal is sufficient to inhibit a subsequent PAM response. Moreover, negative feedback induced by an initial medium-dose PAM signal was enough to fully block response to a high-dose LPS signal 4 hr later (Figures 5A, 5B, and 5D). Overall, these experiments show that variable sensitivity in the population combined with negative feedback mediates non-integrative processing and distinct LPS- and PAM-like responses under simultaneous LPS-PAM input (Figure 5E).
Figure 5. Cell Variability Underlies Non-integrative Processing.
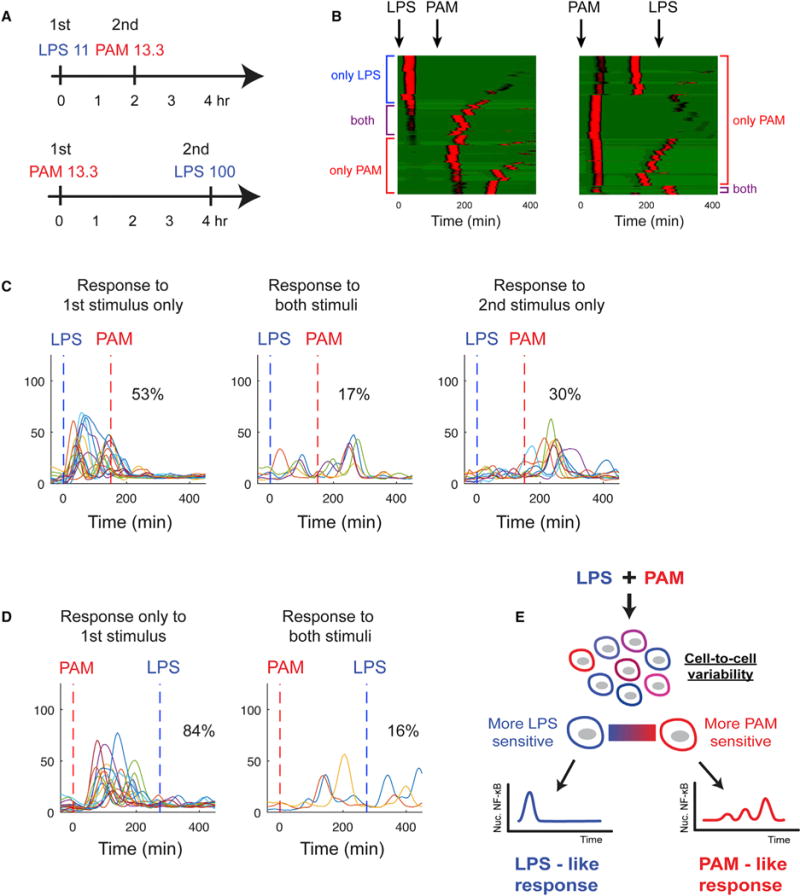
(A) Experimental scheme for sequential LPS/PAM stimulation. In the first experiment, LPS is provided first followed by PAM stimulus 2 hr later. In the second experiment, PAM is provided first followed by LPS 4 hr later.
(B) Model simulation of providing a LPS stimulus followed by a PAM stimulus, showing that those cells not responding to the first LPS signal subsequently do respond to the PAM signal (left). Conversely applying a moderate PAM stimulus first is sufficient to fully block LPS responses (right). Because the data are for sequential stimulations, responses are not classified as LPS- or PAM-like and shown in uniform color.
(C) Experimental data for LPS-first stimulation: 53% of cells respond only to the LPS input, 17% respond to both the first and second stimulus, and 30% respond to only the second stimulus.
(D) Experiment where PAM stimulus is provided first, followed by LPS 4 hr later. PAM 13.3 input activated all cells, and only 16% of cells were able to respond to a strong LPS signal at 4 hr.
(E) Overall findings: simultaneous LPS and PAM input leads to non-integrative processing at the population level. In responding to a mixed LPS-PAM input, cells respond in either an LPS-like or PAM-like dynamic fashion. Cells in the population have variable sensitivity for LPS and PAM inputs. Cells that are relatively more sensitive to PAM respond in a PAM-like fashion to competing LPS-PAM input. The converse is true for cells relatively more sensitive to LPS.
DISCUSSION
Cells interact in complex environments containing a multitude of signals. During infection, different pathogen-associated signals simultaneously transduce information through Toll-like receptors to the NF-κB pathway. It has been unclear how a single signaling pathway handles multiple simultaneous inputs. NF-κB activation is switch-like or digital in that a threshold input level must be exceeded to trigger pathway activation, and here we explored digital NF-κB signaling downstream of simultaneous TLR2-TLR4 stimulation. When stimulated by LPS and PAM alone, TLR4 and TLR2 induce distinct NF-κB dynamic profiles, consistent with previous findings that pathway dynamics encode ligand specificity (Behar et al., 2013; Caldwell et al., 2014; Werner et al., 2005). LPS and PAM both induce an inflammatory gene program, however, LPS additionally induces antiviral genes including ifnb1 mediated by polo-like kinases such as plk1 (Amit et al., 2009; Chevrier et al., 2011). Distinct regulation of antiviral responses occurs through mathematical modeling and experiments showed that simultaneous engagement of TLR4 and TLR2 caused polarized responses in the population with single cells responding in “LPS-like” or “PAM-like” fashion rather than a combined or mixed fashion. This separation is clearest under low-dose stimulation where TLR2 and TLR4 NF-κB dynamics are most distinct. We termed this type of response “non-integrative processing,” in contrast to “integrative processing” where single-cell dynamic response combines features of multiple inputs (Figure 3A). Because TLR4 and TLR2 pathways share downstream signaling components, non-integrative processing represents a “first to fire” modality for cells to achieve ligand-specific responses despite pathway crosstalk.
Switch-like activation in cell signaling is typically associated with decision robustness under noisy inputs (Dueber et al., 2007; Kellogg et al., 2015). Here, we illuminate an additional consequence of switch-like activation for simultaneous input signals called non-integrative processing. Understanding how cells manage multiple inputs and integrate signals is a core problem essential for understanding cell behavior in real signaling contexts. Cell-to-cell variability, an inevitable attribute of cell populations, determines whether a cell responds to LPS or to PAM (Figure 5). TLR2 and TLR4 have specific roles in processing gram-positive and gram-negative bacteria, respectively, with distinct gene expression and cytokine profiles (Hirata et al., 2008; Takeuchi et al., 1999). Subsets of the cell population responding to specific signals may underlie cell-cell cooperation in combating infection (Trinchieri and Sher, 2007). Simultaneous engagement of TLR4 and TLR2 was shown to synergistically activate production of cytokines including TNF and IL-12, through paracrine interactions including IFN signaling (Beutler et al., 2001; Sato et al., 2000). Moreover, inhibitory cell-cell interactions were observed including inhibition of TLR4-induced Th1 cytokines by IL-10 produced through TLR2 (Re and Strominger, 2004). Therefore, heterogeneous and polarized responses at the single-cell level may mediate inter-cellular communication in the innate immune tissue response.
EXPERIMENTAL PROCEDURES
Cell Lines
Mouse (3T3) fibroblasts expressing near-endogenous p65 levels were described previously (Tay et al., 2010). Briefly, p65−/− mouse 3T3 fibroblasts were engineered to express p65-DsRed under control of 1.5 kb p65 promoter sequence (Lee et al., 2009; Tay et al., 2010). The cell line was clonally derived to express the p65 subunit of NF-κB fused to a fluorescent protein (p65-DsRed) at lowest detectable level to preserve near endogenous expression (Lee et al., 2009). Addition of ubiquitin-promoter-driven H2B-GFP expression provided a nuclear label to facilitate automated tracking and image processing.
Automated Microfluidic Cell Culture System
Automated microfluidic cell culture was performed as previously described (Tay et al., 2010). Briefly, microfluidic chambers were fibronectin-treated and seeded with cells at ~200 cells/chamber. Standard culture conditions of 5% CO2 and 37°C were maintained using an incubation chamber. Cells were allowed to grow for 1 day with periodic media replenishment until 80% confluence. Because some LPS preparations can activate both TLR4 and TLR2, we used a purified LPS preparation known to exclusively activate TLR4 signaling (Fujihara et al., 2003; Lee et al., 2009). Ultrapure LPS (Invivogen) and PAM (Invivogen) were diluted in DMEM media in vials pressured with 5% CO2 and kept on ice. To stimulate cells, media equilibrated to 5% CO2 and containing the desired LPS or PAM amount was delivered to chambers, leading to a step increase in LPS concentration. All LPS and PAM doses were tested in parallel in a single chip. Stimulations were applied in duplicate chambers on the chip. Following stimulation, chambers were sealed and imaged at 5- to 6-min intervals.
Image Acquisition and Data Analysis
DsRed and GFP channels were acquired using a Leica DMI6000B wide field microscope at 203 magnification with a Retiga-SRV CCD camera (QImaging) using Leica L5 and Y3 filters to acquire GFP and DsRED signals, respectively, and a Leica EL6000 mercury metal halide light source. CellProfiler software (http://cellprofiler.org/) and custom MATLAB software was used to automatically track cells and quantify NF-κB translocation, and automated results were manually compared with images to ensure accuracy prior to further analysis. NF-κB activation was quantified as mean nuclear fluorescence intensity normalized by mean cytoplasm intensity. For peak analysis, data were smoothed (MATLAB function smooth) followed by peak detection (MATLAB function mspeaks) to extract NF-κB peak properties (intensity, area, delay) with manual verification using a custom interface in MATLAB. Statistical analysis of NF-κB peak amplitude and timing data was performed by Mann-Whitney test (Graphpad Prism). Heatplots of single cell traces are sorted by Pearson correlation coefficient similarity.
miRNA Gene Expression Analysis
For miRNA expression time course following challenge, total RNA was isolated with the mirVana miRNA isolation kit (Ambion). cDNA was generated using the TaqMan microRNA reverse transcription kit (Applied Biosystems). Relative expression of miRNA was determined using TaqMan miRNA-specific assay hsa-miR-146a specific for both human and murine miR-146a, and expression was normalized using snoRNA234 small nuclear RNA (snRNA) endogenous control probes (Applied Biosystems).
Bagging Classifier
For LPS dose x and PAM dose y, we trained a bagging classifier with NF-κB time courses stimulated by either LPS (dose x, denoted as LPS-like) or PAM (dose y, denoted as PAM-like). The bagging classifier is an ensemble of N decision tree models, where the training data for each decision tree was generated by bootstrapping. Given one NF-κB time course induced by two stimuli, we obtain the prediction of every decision tree model. If most predictions (more than ν, ν > 0.5) classify the time course as LPS-like (PAM-like), the bagging classifier outputs LPS-like (PAM-like). Otherwise, the bagging classifier outputs uncertain. The classifier was implemented using MATLAB function fitensemble with arguments “Bag,” “Tree,” and “Classification.” Details of the construction of the classifiers and selection of parameter values can be found in the Supplemental Experimental Procedures.
Supplementary Material
In Brief.
Kellogg et al. study NF-κB responses under TLR co-stimulation and observe that single cells respond with a dynamic NF-κB profile characteristic of either TLR2 or TLR4 activation, rather than a mixed response. Modeling and microfluidic experiments revealed that switch-like NF-κB activation and TLR cross-tolerance mediate this phenomenon, termed non-integrative processing.
Highlights.
Bacterial infection involves co-stimulation of TLR4 and TLR2 receptors
TLR4 and TLR2 induced distinct dynamic NF-κB profiles when stimulated separately
Under co-stimulation, single cells responded to either one ligand or the other
Switch-like NF-κB response and TLR cross-tolerance mediate non-integrative processing
Acknowledgments
We acknowledge Namiko Mitarai for fruitful discussion. This work was supported by an ERC Starting Grant (SingleCellDynamics) and an NIH grant (R01 GM117134-01) to S.T. and by Danish National Research Foundation (Center for Models of Life) to C.T.
Footnotes
SUPPLEMENTAL INFORMATION
Supplemental Information includes Supplemental Experimental Procedures, four figures, and nine tables and can be found with this article online at http://dx.doi.org/10.1016/j.celrep.2017.03.027.
AUTHOR CONTRIBUTIONS
R.A.K., S.T., and M.E. performed experiments. R.A.K., C.T., and M.E. analyzed experiments. C.T. constructed the mathematical model. R.A.K. drafted the manuscript. All authors revised and edited the manuscript. S.T. supervised the project.
References
- Akira S, Takeda K. Toll-like receptor signalling. Nat Rev Immunol. 2004;4:499–511. doi: 10.1038/nri1391. [DOI] [PubMed] [Google Scholar]
- Amit I, Garber M, Chevrier N, Leite AP, Donner Y, Eisenhaure T, Guttman M, Grenier JK, Li W, Zuk O, et al. Unbiased reconstruction of a mammalian transcriptional network mediating pathogen responses. Science. 2009;326:257–263. doi: 10.1126/science.1179050. [DOI] [PMC free article] [PubMed] [Google Scholar]
- Behar M, Barken D, Werner SL, Hoffmann A. The dynamics of signaling as a pharmacological target. Cell. 2013;155:448–461. doi: 10.1016/j.cell.2013.09.018. [DOI] [PMC free article] [PubMed] [Google Scholar]
- Beutler E, Gelbart T, West C. Synergy between TLR2 and TLR4: a safety mechanism. Blood Cells Mol Dis. 2001;27:728–730. doi: 10.1006/bcmd.2001.0441. [DOI] [PubMed] [Google Scholar]
- Brandt KJ, Fickentscher C, Kruithof EKO, de Moerloose P. TLR2 ligands induce NF-κB activation from endosomal compartments of human monocytes. PLoS ONE. 2013;8:e80743. doi: 10.1371/journal.pone.0080743. [DOI] [PMC free article] [PubMed] [Google Scholar]
- Caldwell AB, Cheng Z, Vargas JD, Birnbaum HA, Hoffmann A. Network dynamics determine the autocrine and paracrine signaling functions of TNF. Genes Dev. 2014;28:2120–2133. doi: 10.1101/gad.244749.114. [DOI] [PMC free article] [PubMed] [Google Scholar]
- Cheong R, Rhee A, Wang CJ, Nemenman I, Levchenko A. Information transduction capacity of noisy biochemical signaling networks. Science. 2011;334:354–358. doi: 10.1126/science.1204553. [DOI] [PMC free article] [PubMed] [Google Scholar]
- Chevrier N, Mertins P, Artyomov MN, Shalek AK, Iannacone M, Ciaccio MF, Gat-Viks I, Tonti E, DeGrace MM, Clauser KR, et al. Systematic discovery of TLR signaling components delineates viral-sensing circuits. Cell. 2011;147:853–867. doi: 10.1016/j.cell.2011.10.022. [DOI] [PMC free article] [PubMed] [Google Scholar]
- Dietrich N, Lienenklaus S, Weiss S, Gekara NO. Murine toll-like receptor 2 activation induces type I interferon responses from endolysosomal compartments. PLoS ONE. 2010;5:e10250. doi: 10.1371/journal.pone.0010250. [DOI] [PMC free article] [PubMed] [Google Scholar]
- Dietterich TG. An experimental comparison of three methods for constructing ensembles of decision trees. Mach Learn. 2000;40:139–157. [Google Scholar]
- Dueber JE, Mirsky EA, Lim WA. Engineering synthetic signaling proteins with ultrasensitive input/output control. Nat Biotechnol. 2007;25:660–662. doi: 10.1038/nbt1308. [DOI] [PubMed] [Google Scholar]
- Eldar A, Elowitz MB. Functional roles for noise in genetic circuits. Nature. 2010;467:167–173. doi: 10.1038/nature09326. [DOI] [PMC free article] [PubMed] [Google Scholar]
- Elowitz MB, Levine AJ, Siggia ED, Swain PS. Stochastic gene expression in a single cell. Science. 2002;297:1183–1186. doi: 10.1126/science.1070919. [DOI] [PubMed] [Google Scholar]
- Ferrell JE, Machleder EM. The biochemical basis of an all-or-none cell fate switch in Xenopus oocytes. Science. 1998;280:895–899. doi: 10.1126/science.280.5365.895. [DOI] [PubMed] [Google Scholar]
- Fujihara M, Muroi M, Tanamoto K, Suzuki T, Azuma H, Ikeda H. Molecular mechanisms of macrophage activation and deactivation by lipopolysaccharide: roles of the receptor complex. Pharmacol Ther. 2003;100:171–194. doi: 10.1016/j.pharmthera.2003.08.003. [DOI] [PubMed] [Google Scholar]
- Gantier MP, McCoy CE, Rusinova I, Saulep D, Wang D, Xu D, Irving AT, Behlke MA, Hertzog PJ, Mackay F, Williams BRG. Analysis of microRNA turnover in mammalian cells following Dicer1 ablation. Nucleic Acids Res. 2011;39:5692–5703. doi: 10.1093/nar/gkr148. [DOI] [PMC free article] [PubMed] [Google Scholar]
- Gómez-Sjöberg R, Leyrat AA, Pirone DM, Chen CS, Quake SR. Versatile, fully automated, microfluidic cell culture system. Anal Chem. 2007;79:8557–8563. doi: 10.1021/ac071311w. [DOI] [PubMed] [Google Scholar]
- Hirata N, Yanagawa Y, Ebihara T, Seya T, Uematsu S, Akira S, Hayashi F, Iwabuchi K, Onoé K. Selective synergy in anti-inflammatory cytokine production upon cooperated signaling via TLR4 and TLR2 in murine conventional dendritic cells. Mol Immunol. 2008;45:2734–2742. doi: 10.1016/j.molimm.2008.02.010. [DOI] [PubMed] [Google Scholar]
- Hoffmann A, Levchenko A, Scott ML, Baltimore D. The IkappaB-NF-kappaB signaling module: temporal control and selective gene activation. Science. 2002;298:1241–1245. doi: 10.1126/science.1071914. [DOI] [PubMed] [Google Scholar]
- Kellogg RA, Tay S. Noise facilitates transcriptional control under dynamic inputs. Cell. 2015;160:381–392. doi: 10.1016/j.cell.2015.01.013. [DOI] [PubMed] [Google Scholar]
- Kellogg RA, Gómez-Sjöberg R, Leyrat AA, Tay S. High-throughput microfluidic single-cell analysis pipeline for studies of signaling dynamics. Nat Protoc. 2014;9:1713–1726. doi: 10.1038/nprot.2014.120. [DOI] [PubMed] [Google Scholar]
- Kellogg RA, Tian C, Lipniacki T, Quake SR, Tay S. Digital signaling decouples activation probability and population heterogeneity. eLife. 2015;4:e08931. doi: 10.7554/eLife.08931. [DOI] [PMC free article] [PubMed] [Google Scholar]
- Kingeter LM, Paul S, Maynard SK, Cartwright NG, Schaefer BC. Cutting edge: TCR ligation triggers digital activation of NF-kappaB. J Immunol. 2010;185:4520–4524. doi: 10.4049/jimmunol.1001051. [DOI] [PMC free article] [PubMed] [Google Scholar]
- Kopp E, Medzhitov R. Recognition of microbial infection by Toll-like receptors. Curr Opin Immunol. 2003;15:396–401. doi: 10.1016/s0952-7915(03)00080-3. [DOI] [PubMed] [Google Scholar]
- Lee TK, Denny EM, Sanghvi JC, Gaston JE, Maynard ND, Hughey JJ, Covert MW. A noisy paracrine signal determines the cellular NF-kappaB response to lipopolysaccharide. Sci Signal. 2009;2:ra65. doi: 10.1126/scisignal.2000599. [DOI] [PMC free article] [PubMed] [Google Scholar]
- Liu T, Yamaguchi Y, Shirasaki Y, Shikada K, Yamagishi M, Hoshino K, Kaisho T, Takemoto K, Suzuki T, Kuranaga E, et al. Single-cell imaging of caspase-1 dynamics reveals an all-or-none inflammasome signaling response. Cell Rep. 2014;8:974–982. doi: 10.1016/j.celrep.2014.07.012. [DOI] [PubMed] [Google Scholar]
- Malleshaiah MK, Shahrezaei V, Swain PS, Michnick SW. The scaffold protein Ste5 directly controls a switch-like mating decision in yeast. Nature. 2010;465:101–105. doi: 10.1038/nature08946. [DOI] [PubMed] [Google Scholar]
- Nahid MA, Pauley KM, Satoh M, Chan EKL. miR-146a is critical for endotoxin-induced tolerance: implication in innate immunity. J Biol Chem. 2009;284:34590–34599. doi: 10.1074/jbc.M109.056317. [DOI] [PMC free article] [PubMed] [Google Scholar]
- Nahid MA, Satoh M, Chan EK. MicroRNA in TLR signaling and endotoxin tolerance. Cell Mol Immunol. 2011;8:388–403. doi: 10.1038/cmi.2011.26. [DOI] [PMC free article] [PubMed] [Google Scholar]
- Ozinsky A, Underhill DM, Fontenot JD, Hajjar AM, Smith KD, Wilson CB, Schroeder L, Aderem A. The repertoire for pattern recognition of pathogens by the innate immune system is defined by cooperation between toll-like receptors. Proc Natl Acad Sci USA. 2000;97:13766–13771. doi: 10.1073/pnas.250476497. [DOI] [PMC free article] [PubMed] [Google Scholar]
- Philpott DJ, Girardin SE. The role of Toll-like receptors and Nod proteins in bacterial infection. Mol Immunol. 2004;41:1099–1108. doi: 10.1016/j.molimm.2004.06.012. [DOI] [PubMed] [Google Scholar]
- Quinn EM, Wang JH, O’Callaghan G, Redmond HP. MicroRNA-146a is upregulated by and negatively regulates TLR2 signaling. PLoS ONE. 2013;8:e62232. doi: 10.1371/journal.pone.0062232. [DOI] [PMC free article] [PubMed] [Google Scholar]
- Re F, Strominger JL. IL-10 released by concomitant TLR2 stimulation blocks the induction of a subset of Th1 cytokines that are specifically induced by TLR4 or TLR3 in human dendritic cells. J Immunol. 2004;173:7548–7555. doi: 10.4049/jimmunol.173.12.7548. [DOI] [PubMed] [Google Scholar]
- Sato S, Nomura F, Kawai T, Takeuchi O, Mühlradt PF, Takeda K, Akira S. Synergy and cross-tolerance between toll-like receptor (TLR) 2- and TLR4-mediated signaling pathways. J Immunol. 2000;165:7096–7101. doi: 10.4049/jimmunol.165.12.7096. [DOI] [PubMed] [Google Scholar]
- Selimkhanov J, Taylor B, Yao J, Pilko A, Albeck J, Hoffmann A, Tsimring L, Wollman R. Accurate information transmission through dynamic biochemical signaling networks. Science. 2014;346:1370–1373. doi: 10.1126/science.1254933. [DOI] [PMC free article] [PubMed] [Google Scholar]
- Shah NA, Sarkar CA. Robust network topologies for generating switch-like cellular responses. PLoS Comput Biol. 2011;7:e1002085. doi: 10.1371/journal.pcbi.1002085. [DOI] [PMC free article] [PubMed] [Google Scholar]
- Shinohara H, Behar M, Inoue K, Hiroshima M, Yasuda T, Nagashima T, Kimura S, Sanjo H, Maeda S, Yumoto N, et al. Positive feedback within a kinase signaling complex functions as a switch mechanism for NF-κB activation. Science. 2014;344:760–764. doi: 10.1126/science.1250020. [DOI] [PubMed] [Google Scholar]
- Simmons DP, Canaday DH, Liu Y, Li Q, Huang A, Boom WH, Harding CV. Mycobacterium tuberculosis and TLR2 agonists inhibit induction of type I IFN and class I MHC antigen cross processing by TLR9. J Immunol. 2010;185:2405–2415. doi: 10.4049/jimmunol.0904005. [DOI] [PMC free article] [PubMed] [Google Scholar]
- Stack J, Doyle SL, Connolly DJ, Reinert LS, O’Keeffe KM, McLoughlin RM, Paludan SR, Bowie AG. TRAM is required for TLR2 endosomal signaling to type I IFN induction. J Immunol. 2014;193:6090–6102. doi: 10.4049/jimmunol.1401605. [DOI] [PMC free article] [PubMed] [Google Scholar]
- Taganov KD, Boldin MP, Chang KJ, Baltimore D. NF-kappaB-dependent induction of microRNA miR-146, an inhibitor targeted to signaling proteins of innate immune responses. Proc Natl Acad Sci USA. 2006;103:12481–12486. doi: 10.1073/pnas.0605298103. [DOI] [PMC free article] [PubMed] [Google Scholar]
- Takeda K, Akira S. Toll-like receptors in innate immunity. Int Immunol. 2005;17:1–14. doi: 10.1093/intimm/dxh186. [DOI] [PubMed] [Google Scholar]
- Takeuchi O, Hoshino K, Kawai T, Sanjo H, Takada H, Ogawa T, Takeda K, Akira S. Differential roles of TLR2 and TLR4 in recognition of gram-negative and gram-positive bacterial cell wall components. Immunity. 1999;11:443–451. doi: 10.1016/s1074-7613(00)80119-3. [DOI] [PubMed] [Google Scholar]
- Tay S, Hughey JJ, Lee TK, Lipniacki T, Quake SR, Covert MW. Single-cell NF-kappaB dynamics reveal digital activation and analogue information processing. Nature. 2010;466:267–271. doi: 10.1038/nature09145. [DOI] [PMC free article] [PubMed] [Google Scholar]
- Trinchieri G, Sher A. Cooperation of Toll-like receptor signals in innate immune defence. Nat Rev Immunol. 2007;7:179–190. doi: 10.1038/nri2038. [DOI] [PubMed] [Google Scholar]
- Werner SL, Barken D, Hoffmann A. Stimulus specificity of gene expression programs determined by temporal control of IKK activity. Science. 2005;309:1857–1861. doi: 10.1126/science.1113319. [DOI] [PubMed] [Google Scholar]
Associated Data
This section collects any data citations, data availability statements, or supplementary materials included in this article.