

Abstract
It is unclear whether cancer and its treatments increase the risk of adverse pregnancy outcomes. Our aim was to examine whether cancer survivors have higher risks of poor outcomes in pregnancies conceived after diagnosis than women without cancer, and whether these risks differ by cancer type and race. Diagnoses from cancer registries were linked to pregnancy outcomes from birth certificates in three U.S. states. Analyses were limited to the first, live singleton birth conceived after diagnosis. Births to women without a previous cancer diagnosis in the registry were matched to cancer survivors on age at delivery, parity, race/ethnicity, and education. Log-binomial regression was used to estimate risk ratios. Cervical cancer survivors had higher risks of preterm birth (Risk ratio=2.8, 95% Confidence interval: 2.1, 3.7), as did survivors of invasive breast cancer (RR=1.3, 95% CI: 1.1, 1.7) and leukemia (RR=2.1, 95% CI: 1.3, 3.5). We observed a higher risk of small for gestational age (SGA) infants (<10% of weight for age based on a national distribution) in survivors of brain cancer (RR=1.7, 95% CI: 1.1, 2.8) and extranodal non-Hodgkin lymphoma (RR=2.3, 95% CI: 1.5, 3.6). We did not see an increased risk of infants born preterm, low birth weight, or SGA in pregnancies conceived after ductal carcinoma in situ, thyroid cancer, melanoma, or Hodgkin lymphoma. While our results are reassuring for survivors of many cancers, some will need closer monitoring during pregnancy.
Keywords: cancer survivor, pregnancy, birth outcome
Introduction
Advances in cancer treatment and screening have led to a dramatic increase in the number of cancer survivors.1 At the same time, maternal age at first birth has steadily increased, meaning that a growing number of women have not achieved their desired family size at the time of cancer diagnosis.2 Women diagnosed with cancer during their reproductive years say that, after survival, pregnancy is their most important concern, with an estimated 57–70% of all patients aged 40 or younger wanting children after cancer.3–5 Although there is growing evidence from fertility studies that some cancer treatments can damage the female reproductive system, less is known about pregnancy outcomes in the many women who are able to conceive after cancer.
Preterm birth is a leading cause of neonatal death worldwide, and infants born early are at higher risk of lifelong effects including cerebral palsy, developmental disabilities, and cognitive impairment.6 In the United States, 10% of live births are preterm (<37 weeks gestation) and 8% are low birth weight (<2,500g). The risks are higher among African-American women, who have a 13% risk of preterm delivery and of low birth weight.7
Several population-based studies in Europe have found a higher risk of preterm birth in pregnancies conceived after cancer.8–10 However, few of these studies were powered to stratify by cancer type. Grouping different cancers may obscure risks specific to each diagnosis. Only one population-based study, limited to reproductive cancers, has been able to calculate risks specific to African-American women.11
The aim of this study was to determine whether risks of adverse pregnancy outcomes are higher in cancer survivors than women who have not had cancer, and whether the risk differences comparing cancer survivors with comparison women without cancer vary by race.
Material and Methods
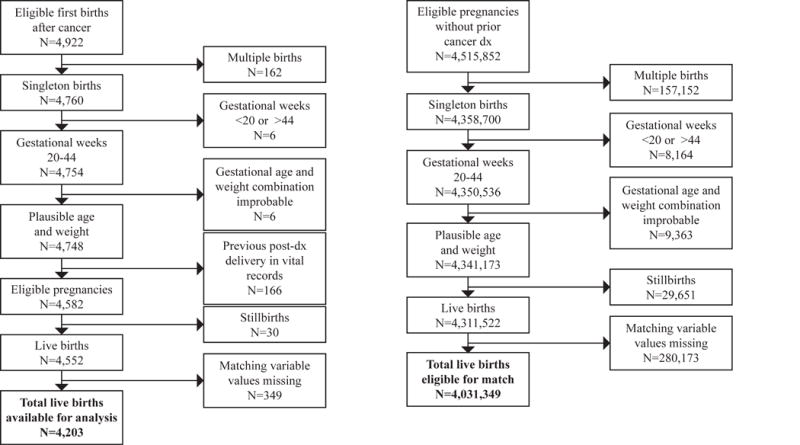
To identify births to women with a previous cancer history, cancer registry staff in three U.S. states linked cancer diagnosis data to vital records. Cancer registries in the states of Georgia, North Carolina, and Tennessee all used the same linking protocol, which was developed by the Georgia Cancer Registry and incorporated both deterministic and probabilistic methods (see Supplement). Women diagnosed with any reportable invasive cancer12 or ductal carcinoma in situ (DCIS) between the ages of 20 and 45 were eligible. The study included cancers diagnosed August 23, 1993 to August 22, 2012 linked to births from 1994 to 2012 in Georgia (cancer diagnoses before 1999 were from metropolitan Atlanta only), cancers diagnosed August 23, 1999 to August 22, 2013 linked to births from 2000–2013 in North Carolina, and cancers diagnosed Jan. 1, 2004 to August 22, 2013 linked to births from May 20, 2004–2013 in Tennessee.
We identified the first pregnancy reaching 20 weeks that was conceived after a cancer diagnosis in each state. Although stillbirths were included to determine the first pregnancy after cancer, these deliveries were excluded from multivariate analysis because a high proportion of stillbirths had missing values for matching variables. Women diagnosed during pregnancy were excluded.
Live births from the same period were eligible for the comparison group if there was no record of cancer diagnosis in the state’s registry during the years covered by the study. Comparison women were matched to cancer survivors within the same state on four primary confounders recorded on the birth certificate: mother’s exact age at delivery (single-year categories), race and ethnicity (7 categories: Hispanic ethnicity of any race, non-Hispanic white, African American, Asian, Pacific Islander, Native American, and multiracial women of any ethnicity), parity (0, 1, 2, and ≥3), maternal education (college graduate yes or no). For the three most common cancers (invasive breast, melanoma, and thyroid) a random sample of comparison births were matched 5:1 to cancer survivor births. For cancer diagnoses with smaller sample sizes (brain, cervical, DCIS, Hodgkin lymphoma, leukemia and both nodal and extranodal non-Hodgkin lymphoma), comparison women were matched 25:1 to decrease random error. For both cancer survivors and comparison women, we limited our analyses to singleton births between 20 and 44 weeks completed gestation, to mothers who were between the ages of 20 and 45 at the time of delivery.
Cancer Type
Cancer type was classified by primary site and histology, using site recode values from the Surveillance, Epidemiology, and End Results (SEER) program of the National Cancer Institute.
Outcomes
The primary analyses assessed whether cancer survivors were at higher risk of adverse outcomes recorded in vital records: preterm birth (<37 weeks gestation), very preterm birth (<32 weeks gestation), low birth weight (<2,500g), very low birth weight (<1,500g), low birth weight at term (<2,500g at ≥37 weeks gestation), and small for gestational age (SGA), defined as below the 10th percentile of birth weight for gestational age and sex based on a national distribution.13 A small number of infants with implausible combinations of birth weight and gestational age, based on the values used by Alexander et al.,14 were excluded. Secondary outcomes included whether the mother delivered by Cesarean section, and whether the infant had an Apgar score <7 at 5 minutes or was admitted to the neonatal intensive care unit (NICU).
Covariates
To identify potential confounders of the association between cancer diagnosis and adverse pregnancy outcomes, we used both the literature and bivariate associations in our data to inform a causal diagram. Based on the diagram, the variables available in vital records that we considered as potential confounders, in addition to the matching factors, included the mother’s self-reported smoking during pregnancy and marital status. These variables were not included in the final models because after we matched on maternal age, race/ethnicity, parity, and education, adding these covariates to the model did not change the estimates of effect. Two measures of household income — women’s eligibility for public health insurance through Medicaid and for food assistance from the Women, Infants, and Children (WIC) program — were available for all years in Tennessee, 2008–2012 in Georgia, and 2011–12 in North Carolina. We conducted a sensitivity analysis to assess whether adding either of these measures of household income to the model changed the results. We also conducted a sensitivity analysis adding pre-pregnancy BMI to the model for breast cancer and preterm birth for cancer survivors in Tennessee.
Statistical methods
The study population was described using frequencies, proportions, and risks. Log-binomial models were used to estimate risk ratios. Separate models were fit for each cancer diagnosis and outcome, so that the risk ratio compares women with a specific cancer to women without a previous cancer diagnosis.
In stratified analyses, risk ratios and risk differences for breast, reproductive cancers, and thyroid cancers were calculated separately for white women and African-American women. Reproductive cancers were grouped in stratified analyses because there was insufficient sample size to estimate measures of effect for individual reproductive cancers. To assess whether the effects of cancer diagnosis differ by race, we estimated the interaction contrast (IC) using linear binomial regression. Interaction contrasts represent the risk difference for the estimated effect of cancer diagnosis among white women, subtracted from the risk difference among African-American women.
Risk ratios are reported for associations with sample sizes of at least 10 adverse pregnancy outcomes in survivors of each cancer type. Analyses were conducted using SAS 9.4 (SAS Institute, Inc., Cary, NC).
Results
Among the 4,203 eligible women with a live birth conceived after cancer, the most common cancer types were melanoma (23%), thyroid cancer (23%), breast cancer (18%), Hodgkin lymphoma (7%), and cervical cancer (3%) (Appendix Table A1). Women who gave birth after a cancer diagnosis were older, more educated, more likely to be married, and more likely to be having their first child than women without cancer whose births were eligible to be sampled for the matched comparison group (Table 1).
Table 1.
Characteristics of the first eligible live singleton birth to women ages 20–45 conceived after cancer diagnosis (N = 4,203), for the most common cancer types and all cancers, compared with all eligible live, singleton births to women ages 20–45 without a previous diagnosis, using birth certificate data linked to cancer registries in Georgia, North Carolina, and Tennessee. Births missing data for the four matching variables (maternal age, race/ethnicity, education, and parity) have been removed.
| Breast
|
Cervix uteri
|
Hodgkin lymphoma
|
Melanoma
|
Thyroid
|
All Cancers
|
Comparison births
|
||||||||
|---|---|---|---|---|---|---|---|---|---|---|---|---|---|---|
| N | % | N | % | N | % | N | % | N | % | N | % | N | % | |
| Preterm birth | ||||||||||||||
|
| ||||||||||||||
| ≥37 weeks gestation | 644 | 85% | 94 | 72% | 264 | 90% | 896 | 91% | 869 | 90% | 3,712 | 88% | 3,642,000 | 90% |
|
| ||||||||||||||
| <37 weeks gestation | 110 | 15% | 37 | 28% | 29 | 9.9% | 85 | 8.7% | 101 | 10% | 491 | 12% | 389,349 | 9.7% |
|
| ||||||||||||||
| Birth weight | ||||||||||||||
|
| ||||||||||||||
| ≥2,500g | 658 | 87% | 103 | 79% | 274 | 94% | 931 | 95% | 906 | 93% | 3,831 | 91% | 3,752,452 | 93% |
|
| ||||||||||||||
| 1,500–<2,500g | 72 | 9.5% | 18 | 14% | 17 | 5.8% | 41 | 4.2% | 48 | 5.0% | 284 | 6.8% | 227,305 | 5.6% |
|
| ||||||||||||||
| <1,500g | 24 | 3.2% | 10 | 7.6% | 2 | 0.7% | 9 | 0.9% | 16 | 1.6% | 88 | 2.1% | 51,592 | 1.3% |
|
| ||||||||||||||
| Small for gestational age | ||||||||||||||
|
| ||||||||||||||
| No | 665 | 88% | 121 | 92% | 266 | 91% | 920 | 94% | 888 | 92% | 3,783 | 90% | 3,596,951 | 89% |
|
| ||||||||||||||
| Yes | 89 | 12% | 10 | 7.6% | 27 | 9.2% | 61 | 6.2% | 82 | 8.5% | 420 | 10% | 434,378 | 11% |
|
| ||||||||||||||
| Maternal age at birth | ||||||||||||||
|
| ||||||||||||||
| 20–24 | 8 | 1.1% | 5 | 3.8% | 25 | 8.5% | 48 | 4.9% | 67 | 6.9% | 250 | 5.9% | 1,271,379 | 32% |
|
| ||||||||||||||
| 25–29 | 89 | 12% | 40 | 31% | 118 | 40% | 260 | 27% | 265 | 27% | 1,084 | 26% | 1,256,448 | 31% |
|
| ||||||||||||||
| 30–34 | 206 | 27% | 52 | 40% | 98 | 33% | 396 | 40% | 358 | 37% | 1,479 | 35% | 978,443 | 24% |
|
| ||||||||||||||
| 35–39 | 321 | 43% | 31 | 24% | 47 | 16% | 226 | 23% | 227 | 23% | 1,091 | 26% | 438,243 | 11% |
|
| ||||||||||||||
| 40–45 | 130 | 17% | 3 | 2.3% | 5 | 1.7% | 51 | 5.2% | 53 | 5.5% | 299 | 7.1% | 86,836 | 2.2% |
|
| ||||||||||||||
| Maternal race and ethnicity | ||||||||||||||
|
| ||||||||||||||
| White, non-Hispanic | 419 | 56% | 92 | 70% | 201 | 69% | 959 | 98% | 729 | 75% | 3,074 | 73% | 2,333,454 | 58% |
|
| ||||||||||||||
| African American, non-Hispanic | 266 | 35% | 33 | 25% | 73 | 25% | 4 | 0.4% | 132 | 14% | 810 | 19% | 1,039,528 | 26% |
|
| ||||||||||||||
| Asian, non-Hispanic | 22 | 3% | 2 | 1.5% | 3 | 1.0% | 2 | 0.2% | 43 | 4.4% | 101 | 2.4% | 119,298 | 3.0% |
|
| ||||||||||||||
| Native American, non-Hispanic | 4 | 0.5% | 0 | 0.0% | 1 | 0.3% | 1 | 0.1% | 5 | 0.5% | 18 | 0.4% | 20,681 | 0.5% |
|
| ||||||||||||||
| Pacific Islander, non-Hispanic | 0 | 0.0% | 0 | 0.0% | 0 | 0.0% | 2 | 0.2% | 1 | 0.1% | 3 | 0.1% | 1,729 | 0.0% |
|
| ||||||||||||||
| Multiracial, any ethnicity | 17 | 2.3% | 1 | 0.8% | 5 | 1.7% | 6 | 0.6% | 18 | 1.9% | 69 | 1.6% | 127,706 | 3.2% |
|
| ||||||||||||||
| Hispanic, any race | 26 | 3.4% | 3 | 2.3% | 10 | 3.4% | 7 | 0.7% | 42 | 4.3% | 128 | 3.0% | 388,953 | 9.6% |
|
| ||||||||||||||
| Maternal education | ||||||||||||||
|
| ||||||||||||||
| Less than high school | 44 | 5.8% | 17 | 13% | 23 | 7.8% | 18 | 1.8% | 47 | 4.8% | 259 | 6.2% | 681,696 | 17% |
|
| ||||||||||||||
| High school or GED | 169 | 22% | 16 | 12% | 67 | 23% | 138 | 14% | 174 | 18% | 801 | 19% | 1,194,965 | 30% |
|
| ||||||||||||||
| Some college or associate degree | 193 | 26% | 39 | 30% | 95 | 32% | 270 | 28% | 325 | 34% | 1,278 | 30% | 1,100,788 | 27% |
|
| ||||||||||||||
| At least 4 years of college | 348 | 46% | 59 | 45% | 108 | 37% | 555 | 57% | 424 | 44% | 1,865 | 44% | 1,053,900 | 26% |
|
| ||||||||||||||
| Parity | ||||||||||||||
|
| ||||||||||||||
| 0 | 283 | 38% | 61 | 47% | 127 | 43% | 497 | 51% | 380 | 39% | 1,825 | 43% | 1,459,220 | 36% |
|
| ||||||||||||||
| 1 | 248 | 33% | 43 | 33% | 95 | 32% | 305 | 31% | 319 | 33% | 1,313 | 31% | 1,391,980 | 35% |
|
| ||||||||||||||
| 2 | 124 | 16% | 15 | 11% | 52 | 18% | 134 | 14% | 175 | 18% | 677 | 16% | 726,821 | 18% |
|
| ||||||||||||||
| 3 or more | 99 | 13% | 12 | 9.2% | 19 | 6.5% | 45 | 4.6% | 96 | 9.9% | 388 | 9.2% | 453,328 | 11% |
|
| ||||||||||||||
| Smoking during pregnancy | ||||||||||||||
|
| ||||||||||||||
| No | 684 | 93% | 116 | 92% | 255 | 91% | 887 | 95% | 879 | 95% | 3,763 | 93% | 3,380,485 | 89% |
|
| ||||||||||||||
| Yes | 49 | 6.7% | 10 | 7.9% | 26 | 9.3% | 44 | 4.7% | 45 | 4.9% | 267 | 6.6% | 417,691 | 11% |
|
| ||||||||||||||
| Missing | 21 | 5 | 12 | 50 | 46 | 173 | 233,173 | |||||||
|
| ||||||||||||||
| Mother married | ||||||||||||||
| Yes | 576 | 76% | 107 | 82% | 213 | 73% | 904 | 92% | 809 | 83% | 3,380 | 80% | 2,650,219 | 66% |
|
| ||||||||||||||
| No | 178 | 24% | 24 | 18% | 80 | 27% | 75 | 7.7% | 161 | 17% | 819 | 20% | 1,379,500 | 34% |
|
| ||||||||||||||
| Missing | 0 | 0 | 0 | 2 | 0 | 4 | 1,630 | |||||||
The characteristics of mothers at the first birth after a diagnosis differed by cancer type. Breast cancer survivors were older at the time of delivery than melanoma and cervical cancer survivors. In these three U.S. states, 35% of all breast cancer survivors and 25% of both cervical and Hodgkin lymphoma survivors were African-American.
Infants born to survivors of certain cancers were at higher risk of low birth weight, due to being born preterm or small for gestational age (SGA). Births to women with a history of invasive breast cancer were more likely to be preterm (RR for delivery before 37 weeks=1.3, 95% CI: 1.1, 1.7) and very preterm (RR for delivery before 32 weeks=1.7, 95% CI: 1.0, 2.8) than those to matched comparison women (Table 2). Infants born to survivors of invasive breast cancer also had higher risks of other outcomes associated with prematurity (Tables 2 and 3), including low birth weight (RR for <2,500g=1.6, 95% CI: 1.3, 2.0), very low birth weight (RR for <1,500g=2.1, 95% CI: 1.3, 3.6), and 5-minute Apgar score below 7 (RR=1.8, 95% CI: 1.1, 2.9). The RR for NICU admission among infants born to breast cancer survivors was 1.5 (95% CI: 0.9, 2.6). The risk of SGA in infants born to invasive breast cancer survivors was similar to the risk in comparison women (RR=1.2, 95% CI: 0.9, 1.5).
Table 2.
Risk ratios for preterm birth, low birth weight (LBW) and small for gestational age (SGA) for the first eligible live singleton birth conceived after diagnosis with each cancer, compared with births to matched comparison women without a previous cancer diagnosis.
| Cancer | Total births | Preterm birth < 37 weeks
|
Preterm birth < 32 weeks
|
LBW (< 2,500g)
|
Very LBW (< 1,500g)
|
LBW at term
|
SGA
|
||||||
|---|---|---|---|---|---|---|---|---|---|---|---|---|---|
| N | RR | N | RR | N | RR | N | RR | N | RR | N | RR | ||
| Brain | 104 | 11 | 1.1 (0.6, 1.9) | 1 | – | 7 | – | 2 | – | 1 | – | 16 | 1.7 (1.1, 2.8) |
|
| |||||||||||||
| Breast, all | 754 | 110 | 1.3 (1.1, 1.6) | 22 | 1.5 (1.0, 2.5) | 96 | 1.4 (1.2, 1.8) | 24 | 1.8 (1.1, 2.8) | 23 | 1.1 (0.7, 1.7) | 89 | 1.1 (0.9, 1.3) |
|
| |||||||||||||
| Breast, invasive (no DCIS) | 598 | 94 | 1.3 (1.1, 1.7) | 18 | 1.7 (1.0, 2.8) | 82 | 1.6 (1.3, 2.0) | 20 | 2.1 (1.3, 3.6) | 21 | 1.4 (0.9, 2.2) | 78 | 1.2 (0.9, 1.5) |
|
| |||||||||||||
| Breast, DCIS only | 156 | 16 | 0.9 (0.6, 1.5) | 4 | – | 14 | 1.2 (0.7, 2.0) | 4 | – | 2 | – | 11 | 0.7 (0.4, 1.3) |
|
| |||||||||||||
| Cervix uteri | 131 | 37 | 2.8 (2.1, 3.7) | 13 | 5.4 (3.1, 9.6) | 28 | 2.8 (2.0, 4.0) | 10 | 4.3 (2.3, 8.2) | 1 | – | 10 | 0.7 (0.4, 1.4) |
|
| |||||||||||||
| Hodgkin lymphoma | 293 | 29 | 1.1 (0.7, 1.5) | 1 | – | 19 | 1.0 (0.6, 1.5) | 2 | – | 4 | – | 27 | 1.0 (0.7, 1.4) |
|
| |||||||||||||
| Leukemia | 63 | 14 | 2.1 (1.3, 3.5) | 3 | – | 10 | 2.2 (1.2, 4.1) | 2 | – | 1 | – | 10 | 1.5 (0.8, 2.7) |
|
| |||||||||||||
| Melanoma | 981 | 85 | 0.9 (0.8, 1.2) | 15 | 1.7 (0.9, 3.0) | 50 | 0.9 (0.7, 1.3) | 9 | – | 14 | 0.9 (0.5, 1.5) | 61 | 0.8 (0.6, 1.1) |
|
| |||||||||||||
| Non-Hodgkin lymphoma, nodal | 95 | 10 | 1.1 (0.6, 2.1) | 3 | – | 9 | – | 2 | – | 2 | – | 5 | – |
|
| |||||||||||||
| Non-Hodgkin lymphoma, extranodal | 63 | 7 | – | 1 | – | 11 | 2.0 (1.1, 3.5) | 0 | – | 5 | – | 16 | 2.3 (1.5, 3.6) |
|
| |||||||||||||
| Thyroid | 970 | 101 | 1.0 (0.8, 1.2) | 14 | 1.1 (0.6, 1.9) | 64 | 1.0 (0.7, 1.3) | 16 | 1.4 (0.8, 2.4) | 19 | 0.9 (0.6, 1.5) | 82 | 0.9 (0.7, 1.1) |
Risk ratios are presented for associations with ≥10 events in survivors of each cancer type. Comparison women without cancer were matched 5:1 to invasive breast, melanoma, and thyroid cancer survivors and 25:1 to survivors of all other cancers on exact age at birth (single-year category), parity (0, 1, 2, 3+), race and ethnicity (Hispanic, non-Hispanic white, African American, Asian, Pacific Islander, Native American, and multiracial of any ethnicity), maternal education (college graduate yes or no), and state of residence (GA, NC, or TN).
Table 3.
Risk ratios for admission to the neonatal intensive care unit (NICU), 5-minute Apgar score <7, and Cesarean section for the first live singleton birth conceived after diagnosis with each cancer, compared with births to matched comparison women without a previous cancer diagnosis.
| Cancer | Admission to NICU
|
Apgar score < 7 at 5 minutes
|
C-section
|
|||
|---|---|---|---|---|---|---|
| N | RR | N | RR | N | RR | |
| Brain | 2/34 | – | 4/103 | – | 40/104 | 1.2 (1.0, 1.6) |
|
| ||||||
| Breast, all | 17/182 | 1.3 (0.8, 2.2) | 26/751 | 1.7 (1.1, 2.7) | 329/754 | 1.1 (1.0, 1.2) |
|
| ||||||
| Breast, invasive (no DCIS) | 15/149 | 1.5 (0.9, 2.6) | 22/595 | 1.8 (1.1, 2.9) | 255/598 | 1.2 (1.0, 1.3) |
|
| ||||||
| Breast, DCIS only | 2/33 | – | 4/156 | – | 74/156 | 1.2 (1.0, 1.4) |
|
| ||||||
| Cervix uteri | 6/28 | – | 5/131 | – | 66/130 | 1.5 (1.3, 1.8) |
|
| ||||||
| Hodgkin lymphoma | 4/90 | – | 3/293 | – | 108/293 | 1.1 (1.0, 1.3) |
|
| ||||||
| Leukemia | 1/19 | – | 1/62 | – | 28/63 | 1.4 (1.1, 1.9) |
|
| ||||||
| Melanoma | 7/240 | – | 15/974 | 1.0 (0.6, 1.7) | 345/978 | 1.1 (1.0, 1.2) |
|
| ||||||
| Non-Hodgkin lymphoma, nodal | 1/29 | – | 5/95 | – | 35/95 | 1.1 (0.8, 1.4) |
|
| ||||||
| Non-Hodgkin lymphoma, extranodal | 1/13 | – | 2/63 | – | 28/63 | 1.4 (1.0, 1.8) |
|
| ||||||
| Thyroid | 18/313 | 0.9 (0.5, 1.4) | 17/968 | 1.0 (0.6, 1.6) | 340/969 | 1.1 (1.0, 1.2) |
Risk ratios are presented for associations with ≥10 events in survivors of each cancer type. Comparison women without cancer were matched 5:1 to invasive breast, melanoma, and thyroid cancer survivors and 25:1 to survivors of all other cancers on exact age at birth (single-year category), parity (0, 1, 2, 3+), race and ethnicity (Hispanic, non-Hispanic white, African American, Asian, Pacific Islander, Native American, and multiracial of any ethnicity), maternal education (college graduate yes or no), and state of residence (GA, NC, or TN).
There was a high risk of preterm birth in cervical cancer survivors (Table 2), with 28% of live births delivered before 37 weeks (RR=2.8, 95% CI: 2.1, 3.7), and 10% delivered before 32 weeks (RR=5.4, 95% CI: 3.1, 9.6). Infants born to cervical cancer survivors also had higher risks of low birth weight (RR=2.8, 95% CI: 2.0, 4.0) and very low birth weight (RR=4.3, 95% CI: 2.3, 8.2) than infants born to matched comparison women, and were more likely to be delivered by C-section (RR=1.5, 95% CI: 1.3, 1.8). However, infants born to cervical cancer survivors did not have a higher risk of being born SGA than infants born to comparison women (RR=0.7, 95% CI: 0.4, 1.4).
Infants born to leukemia survivors were more likely to be preterm (RR=2.1, 95% CI: 1.3, 3.5) and low birth weight (RR=2.2, 95% CI: 1.2, 4.1). The RR comparing the risk of SGA births in leukemia patients to matched comparison women was 1.5 (95% CI: 0.8, 2.7). There was a higher risk of SGA in infants born to brain cancer survivors than matched comparison women (RR=1.7, 95% CI: 1.1, 2.8), with 16/104 (15%) born SGA. However, only 1 of the 16 infants born SGA to brain cancer survivors was small enough to be classified low birth weight at term (Table 2). Of the 63 infants born to survivors of extranodal non-Hodgkin lymphoma, 16 were SGA (RR=2.3, 95% CI: 1.5, 3.6) and 11 were low birth weight (RR=2.0, 95% CI: 1.1, 3.5).
Although the risk of delivering by C-section was slightly higher for survivors of most cancers (Table 3), women diagnosed with DCIS, Hodgkin lymphoma, melanoma, and thyroid cancer did not have a higher estimated risk of any other adverse outcome in their first live birth after diagnosis than matched comparison women (Tables 2 and 3).
A risk ratio for the association between cancer diagnosis and stillbirth was not estimated because a high proportion of stillbirths were missing values of one or more matching factors. However, the crude risk of stillbirth did not appear higher in births to cancer survivors than the general population. Among eligible pregnancies after a cancer diagnosis that reached 20 weeks, 0.7% (30/4,582) ended in stillbirth, which was the same as the risk (also 0.7%) in all unmatched eligible pregnancies to women without a cancer diagnosis in these three U.S. states.
African-American cancer survivors had higher overall risks of adverse pregnancy outcomes than white cancer survivors (Table 4). The disparity was starkest for thyroid cancer, where African-American survivors had a 17% risk (95% CI: 11%, 24%) of low birth weight in the first pregnancy conceived after diagnosis, compared with 5% (95% CI: 4%, 7%) in white survivors. But because African-American women also had much higher baseline risks of adverse outcomes, the excess risk attributable to breast and thyroid cancer was not meaningfully different for African-American women than white women. For all three pregnancy outcomes, the risk differences comparing white breast cancer survivors to white women without cancer were nearly the same as the risk differences comparing African-American breast cancer survivors to African-American women without cancer (Interaction Contrast=0.02, 95% CI: −0.04, 0.08 for preterm birth; 0.03, 95% CI: −0.03, 0.09 for low birth weight, and 0.04, 95% CI: −0.02, 0.09 for SGA). Interaction contrasts comparing risk differences in white and African-American women after thyroid cancer were similarly null. However, white women did have a higher risk of low birth weight after reproductive cancer than white women without cancer (14% after cancer vs. 5% in comparison women), while African-American women did not have an increase in risk associated with cancer (14% vs. 13%) (Table 4).
Table 4.
Risks, risk differences, and risk ratios for preterm birth, low birth weight, and small for gestational age in the first live singleton birth conceived after diagnosis with breast, reproductive, and thyroid cancers, compared with births to matched comparison women without a previous cancer diagnosis, stratified by race.
| Breast | Reproductive | Thyroid | |
|---|---|---|---|
| Preterm birth | |||
| White women | |||
| Risk, cancer survivors | 12% (9%, 15%) | 18% (13%, 24%) | 9% (7%, 12%) |
| Risk, matched comparison births (ref) | 9% (8%, 10%) | 8% (8%, 9%) | 9% (8%, 10%) |
| Risk Difference | 3% (−1%, 6%) | 9% (4%, 15%) | 0% (−2%, 3%) |
| Risk Ratio | 1.3 (1.0, 1.8) | 2.1 (1.6, 2.9) | 1.1 (0.8, 1.4) |
| African-American women | |||
| Risk, cancer survivors | 20% (15%, 25%) | 22% (14%, 33%) | 20% (13%, 28%) |
| Risk, matched comparison births (ref) | 15% (13%, 17%) | 14% (13%, 16%) | 17% (14%, 20%) |
| Risk Difference | 4% (−1%, 10%) | 8% (−1%, 18%) | 2% (−5%, 10%) |
| Risk Ratio | 1.3 (1.0, 1.7) | 1.6 (1.0, 2.4) | 1.1 (0.8, 1.7) |
| Interaction Contrast | 0.02 (−0.04, 0.08) | −0.01 (−0.12, 0.10) | 0.02 (−0.06, 0.10) |
| Low birth weight | |||
| White women | |||
| Risk, cancer survivors | 9% (7%, 12%) | 14% (9%, 20%) | 5% (4%, 7%) |
| Risk, matched comparison births (ref) | 7% (6%, 8%) | 5% (5%, 6%) | 6% (5%, 7%) |
| Risk Difference | 2% (−1%, 5%) | 9% (4%, 14%) | 0% (−2%, 1%) |
| Risk Ratio | 1.4 (1.0, 1.9) | 2.7 (1.9, 3.9) | 0.9 (0.7, 1.3) |
| African-American women | |||
| Risk, cancer survivors | 18% (14%, 24%) | 14% (7%, 24%) | 17% (11%, 24%) |
| Risk, matched comparison births (ref) | 13% (11%, 15%) | 13% (11%, 14%) | 11% (9%, 14%) |
| Risk Difference | 6% (1%, 11%) | 2% (−6%, 10%) | 5% (−2%, 12%) |
| Risk Ratio | 1.4 (1.1, 1.9) | 1.1 (0.6, 2.0) | 1.5 (0.9, 2.3) |
| Interaction Contrast | 0.03 (−0.03, 0.09) | −0.07 (−0.17, 0.02) | 0.06 (−0.01, 0.13) |
| Small for gestational age | |||
| White women | |||
| Risk, cancer survivors | 8% (6%, 11%) | 8% (5%, 13%) | 8% (6%, 10%) |
| Risk, matched comparison births (ref) | 9% (8%, 10%) | 9% (8%, 9%) | 8% (7%, 9%) |
| Risk Difference | −1% (−4%, 2%) | 0% (−4%, 4%) | 0% (−2%, 2%) |
| Risk Ratio | 0.9 (0.6, 1.3) | 1.0 (0.6, 1.6) | 1.0 (0.7, 1.3) |
| African-American women | |||
| Risk, cancer survivors | 17% (13%, 22%) | 13% (6%, 23%) | 12% (7%, 19%) |
| Risk, matched comparison births (ref) | 14% (12%, 16%) | 15% (14%, 17%) | 15% (13%, 18%) |
| Risk Difference | 3% (−2%, 8%) | −2% (−10%, 5%) | −3% (−9%, 3%) |
| Risk Ratio | 1.2 (0.9, 1.6) | 0.9 (0.5, 1.5) | 0.8 (0.5, 1.3) |
| Interaction Contrast | 0.04 (−0.02, 0.09) | −0.02 (−0.11, 0.07) | −0.03 (−0.09, 0.04) |
Reproductive cancers include cervix uteri, corpus uteri, ovary, vulva, and all other female genital cancers. Comparison women without cancer were matched 5:1 to breast and thyroid cancer survivors and 25:1 to reproductive cancer survivors on exact age at birth (single-year category), parity (0, 1, 2, 3+), race and ethnicity (Hispanic, non-Hispanic white, African American, Asian, Pacific Islander, Native American, and multiracial of any ethnicity), maternal education (college graduate yes or no) and state of residence (GA, NC, or TN).
The results did not change substantially when we: 1) added BMI to the model for preterm birth in breast cancer survivors from Tennessee, 2) controlled for household income as measured by eligibility for public health insurance through the Medicaid program, 3) controlled for household income as measured by eligibility for nutrition assistance through the WIC program, or 4) excluded women diagnosed with a more than one cancer before conception of the pregnancy.
Discussion
This large, multistate, population-based study allowed us to analyze the risks of adverse pregnancy outcomes specific to the most common cancer types of young adulthood. We observed a high risk of preterm delivery in cervical cancer survivors, whose risks of preterm birth and low birth weight were three times higher than in women without a history of cancer. In infants born to breast cancer survivors, we saw a slightly higher risk of preterm birth than in women without cancer, and a moderately higher risk of low birth weight. Although the sample sizes were small, we observed an increased risk of preterm birth and low birth weight in infants born to leukemia survivors and SGA in infants born to women diagnosed with brain cancer and extranodal non-Hodgkin lymphoma. Aside from slightly higher risks for delivery by C-section, we did not see a higher risk of adverse pregnancy outcomes after DCIS, Hodgkin lymphoma, melanoma, or thyroid cancer.
Previous studies have found a slightly elevated risk of some adverse pregnancy outcomes in cancer survivors compared with women who have not had cancer, with odds ratios (ORs) for preterm birth between 1.3 and 1.5.8–11 When comparing all women with any previous cancer diagnosis to matched women without cancer, we see a similar overall association (RR=1.2, 95% CI: 1.1, 1.3). However, this study suggests that the increased risks are limited to certain cancers. Our results are consistent with population-based studies in Denmark that did not observe increased risks of preterm birth or low birth weight at term in infants born to women diagnosed with Hodgkin lymphoma15 or melanoma.16 Our estimated RR for preterm birth in breast cancer survivors was 1.3 (95% CI: 1.0, 1.6). A Danish study of births to breast cancer survivors diagnosed between 1943 and 2002 had a similar result, although with a wider confidence interval reflecting that study’s smaller sample size (OR=1.3, 95% CI: 0.7, 2.2).17 We similarly found higher risks of very preterm birth in survivors of invasive breast cancer (RR=1.7, 95% CI: 1.0, 2.8).
For most cancers, the increased risk of infants born low birth weight appears to be the result of preterm birth rather than growth restriction. A similar study of survivors in Finland, which included all cancers diagnosed in both childhood and adulthood, also reported increased odds of low birth weight and preterm birth in all cancer survivors, but no overall increased odds of infants born small for gestational age.8
Cancer treatment in adulthood might increase the risk of early delivery through different mechanisms. Surgery for cervical cancer could structurally weaken the cervix and reduce its capacity to serve as a barrier against infection.18 Some types of chemotherapy might cause preterm birth through immunosuppression, reducing survivors’ ability to combat infections associated with preterm birth.19,20 Although it is unclear how long immunosuppression may persist after different treatment regimens, studies in breast cancer patients have found CD4+ counts that remained 50% below baseline 12–14 months after treatment21 and weaker vaccine response in survivors with a mean of 2.6 years since chemotherapy.22 Although closer management of pregnancies in women with a history of cancer could result in more iatrogenic preterm births, we did not see evidence of this in our data. Among infants born preterm, 15.4% of deliveries in cancer survivors were induced, similar to the 14.7% of deliveries in matched comparison women that were induced.
Although we did not see an increase in risk in infants born SGA after diagnosis with most cancers, we did observe higher risks of this outcome in infants born to survivors of brain cancer and extranodal non-Hodgkin lymphoma. Cranial radiation for brain cancer and other cancers of the head and neck has been linked to long-term damage to the hypothalamic-pituitary-adrenal (HPA) axis,23–25 which plays an important role in fetal growth.26 Extranodal non-Hodgkin lymphoma can involve any organ in the body, so depending on the location of the tumor, some patients receive cranial radiation.27 Patients with abdominopelvic lymphomas can receive radiation to the pelvic field, which researchers have hypothesized might lead to intrauterine growth restriction in subsequent pregnancies through fibrosis, endometrial injury, reduced uterine volume, or poorer vascularization.23 However, our small sample sizes for brain cancer and extranodal non-Hodgkin lymphoma warrant a cautious interpretation of these associations, which may be chance findings.
In this study, African-American survivors of breast, reproductive, and thyroid cancers had higher risks of adverse outcomes after cancer than white women. But these higher risks mostly reflected the high baseline risks of adverse outcomes in African-American women, rather than a larger increase in risk after cancer diagnosis. Our observation of an increased risk of low birth weight risk after reproductive cancer among white women, but not among African-American women, is largely consistent with results from the only other paper examining risks by race.11 However, for breast cancer, the previous study using birth records linked to cancer diagnosis data in the state of Florida found higher risks of low birth weight after breast cancer in African-American women, but not in white women. In contrast, we observed nearly identical small increases in risk among women of both races. One key difference is that the Florida study included women diagnosed with cancer during the pregnancy or immediately after delivery (who thus may have had undetected cancer during the pregnancy), while our study was limited to pregnancies conceived after diagnosis.
This study has important strengths, including its population-based design and large sample of African-American women. With more than 4,000 first births after cancer, our study is the largest of pregnancy outcomes in cancer survivors to date.
The quality of cancer diagnosis information in U.S. cancer registries is high, with a study finding 96% sensitivity for detection of cancer cases and a mean of 95% accuracy across 13 variables.28 Although the quality of birth certificate data differs by variable and state, studies of U.S. vital records have consistently shown that the pregnancy outcomes of low birth weight, Apgar score, and delivery method, as well as all four matching factors (maternal age, race/ethnicity, parity, and education), have excellent agreement with both medical records and maternal self-report.29–32 Preterm delivery from the obstetric estimate of gestational age has generally good agreement with medical records,30,33,34 although both birth certificates and medical records may misclassify preterm delivery, particularly in women who did not plan their pregnancies.
One limitation of the study is that the U.S. does not have a national cancer registry, so cancer diagnosis information is specific to each state. Thus, to be correctly identified, a woman’s first birth after cancer must have occurred in the same state as her diagnosis. Women who were diagnosed in one state and then gave birth in another state are missing from this analysis. We are also unable to correctly identify cancer survivors diagnosed before the years covered by the study. It is thus likely that we are missing a disproportionate number of survivors who had a long interval between diagnosis and the first birth after cancer, because these women are more likely to have been diagnosed in years before we have registry data and because they had more time to move to a different state before delivery. While having cancer data only from recent years is thus a limitation of the study, it is also a strength, because the survivors identified in our study all received modern cancer treatments. Counts of stillbirths to cancer survivors in this study need to be interpreted with caution, because the stillbirth records were more often incomplete. A higher proportion of stillbirth records than live births were missing key variables used in the link, including Social Security number, the unique identifier assigned to each U.S. citizen. This could cause us to underestimate the true number of stillbirths to cancer survivors if true matches were missed, or to overestimate the true number of stillbirths if there were false matches between different women who shared other linking factors like name and date of birth.
Future studies should use other data sources to examine outcomes including stillbirth, early pregnancy loss, and birth defects, and should focus on risks after less common cancers that we had insufficient sample size to analyze. Our study suggests that survivors of some cancers need closer monitoring and management in pregnancy. However, the results are reassuring for many survivors of cancer diagnosed in young adulthood; we did not observe an increased risk of adverse pregnancy outcomes after many cancer diagnoses.
Supplementary Material
Figure 1.
Novelty and Impact.
In pregnancies conceived after diagnosis, infants born to cervical cancer survivors were three times more likely to be preterm than infants born to matched comparison women without a cancer history. Infants born to breast cancer and leukemia survivors also had a higher risk of preterm birth. In contrast, infants born to survivors of Hodgkin lymphoma, melanoma, and thyroid cancer did not have a higher risk of being born preterm or small for gestational age.
Acknowledgments
The authors are grateful to Lyn Almon at the Georgia Cancer Registry, who linked the data to Georgia vital records and worked with other states to facilitate the link and standardize linking methodologies. We would also like to thank Rana Bayakly, James Steiner, and Gordon Freymann at the Georgia Department of Public Health, Gary Leung, Soundarya Radhakrishnan, and Chandrika Rao at the North Carolina Central Cancer Registry, Matt Avery and Eleanor Howell at the North Carolina Center for Health Statistics, Jake Richards and Martin Whiteside at the Tennessee Cancer Registry, and Benjamin Crumpler at the Tennessee Office of Vital Statistics, who worked to provide the linked datasets and made this study possible. Funding for this research was provided by The Eunice Kennedy Shriver National Institute of Child Health and Human Development Grant 1R01HD066059, the Reproductive, Perinatal & Pediatric Training Grant T32HD052460, Laney Graduate School at Emory University, and the Achievement Rewards for College Scientists (ARCS) Foundation Atlanta chapter. Infrastructure funding for state cancer registries is provided by cooperative agreement award numbers 5NU58DP00387504 to Georgia, 5U58DP00393305 to North Carolina, and 5U58DP003901 to Tennessee from the Centers for Disease Control and Prevention and through contract HHSN261201300015I with the National Cancer Institute. The findings and conclusions in this manuscript are those of the authors and do not necessarily represent the official position of the Centers for Disease Control and Prevention or the National Cancer Institute.
Abbreviations
- RR
risk ratio
- CI
confidence interval
- OR
odds ratio
- DCIS
ductal carcinoma in situ
- LBW
low birth weight
- SGA
small for gestational age
- NICU
neonatal intensive care unit
Footnotes
Additional Supporting Information may be found in the online version of this article.
References
- 1.Jemal A, Ward EM, Johnson CJ, et al. Annual Report to the Nation on the Status of Cancer, 1975–2014 Featuring Survival. J Natl Cancer Inst. 2017;109(9) doi: 10.1093/jnci/djx030. [DOI] [PMC free article] [PubMed] [Google Scholar]
- 2.Martin JA, Hamilton BE, Osterman MJ, Driscoll AK, Mathews TJ. Births: Final Data for 2015. Natl Vital Stat Rep. 2017;66(1):1. [PubMed] [Google Scholar]
- 3.Letourneau JM, Ebbel EE, Katz PP, et al. Acute ovarian failure underestimates age-specific reproductive impairment for young women undergoing chemotherapy for cancer. Cancer. 2012;118(7):1933–1939. doi: 10.1002/cncr.26403. [DOI] [PMC free article] [PubMed] [Google Scholar]
- 4.Partridge AH, Gelber S, Peppercorn J, et al. Web-based survey of fertility issues in young women with breast cancer. J Clin Oncol. 2004;22(20):4174–4183. doi: 10.1200/JCO.2004.01.159. [DOI] [PubMed] [Google Scholar]
- 5.Peate M, Meiser B, Friedlander M, et al. It’s now or never: fertility-related knowledge, decision-making preferences, and treatment intentions in young women with breast cancer–an Australian fertility decision aid collaborative group study. Journal of clinical oncology : official journal of the American Society of Clinical Oncology. 2011;29(13):1670–1677. doi: 10.1200/JCO.2010.31.2462. [DOI] [PubMed] [Google Scholar]
- 6.Platt MJ. Outcomes in preterm infants. Public Health. 2014;128(5):399–403. doi: 10.1016/j.puhe.2014.03.010. [DOI] [PubMed] [Google Scholar]
- 7.Hamilton BE, Martin JA, Osterman MJ, Curtin SC, Matthews TJ. Births: Final Data for 2014. Natl Vital Stat Rep. 2015;64(12):1–64. [PubMed] [Google Scholar]
- 8.Madanat-Harjuoja LM, Malila N, Lahteenmaki PM, Boice JD, Jr, Gissler M, Dyba T. Preterm delivery among female survivors of childhood, adolescent and young adulthood cancer. Int J Cancer. 2010;127(7):1669–1679. doi: 10.1002/ijc.25157. [DOI] [PMC free article] [PubMed] [Google Scholar]
- 9.Stensheim H, Klungsoyr K, Skjaerven R, Grotmol T, Fossa SD. Birth outcomes among offspring of adult cancer survivors: a population-based study. Int J Cancer. 2013;133(11):2696–2705. doi: 10.1002/ijc.28292. [DOI] [PubMed] [Google Scholar]
- 10.Clark H, Kurinczuk JJ, Lee AJ, Bhattacharya S. Obstetric outcomes in cancer survivors. Obstet Gynecol. 2007;110(4):849–854. doi: 10.1097/01.AOG.0000284458.53303.1c. [DOI] [PubMed] [Google Scholar]
- 11.Mogos MF, Salihu HM, Aliyu MH, Whiteman VE, Sultan DH. Association between reproductive cancer and fetal outcomes: a population-based study. Int J Gynecol Cancer. 2013;23(2):218–226. doi: 10.1097/IGC.0b013e31827b877b. [DOI] [PubMed] [Google Scholar]
- 12.Adamo MDL, Ruhl J. SEER Program Coding and Staging Manual 2015. Bethesda, MD: National Cancer Institute; 2015. [Google Scholar]
- 13.Oken E, Kleinman KP, Rich-Edwards J, Gillman MW. A nearly continuous measure of birth weight for gestational age using a United States national reference. BMC Pediatr. 2003;3:6. doi: 10.1186/1471-2431-3-6. [DOI] [PMC free article] [PubMed] [Google Scholar]
- 14.Alexander GR, Himes JH, Kaufman RB, Mor J, Kogan M. A United States national reference for fetal growth. Obstet Gynecol. 1996;87(2):163–168. doi: 10.1016/0029-7844(95)00386-X. [DOI] [PubMed] [Google Scholar]
- 15.Langagergaard V, Horvath-Puho E, Norgaard M, Norgard B, Sorensen HT. Hodgkin’s disease and birth outcome: a Danish nationwide cohort study. Br J Cancer. 2008;98(1):183–188. doi: 10.1038/sj.bjc.6604126. [DOI] [PMC free article] [PubMed] [Google Scholar]
- 16.Langagergaard V, Puho EH, Lash TL, Norgard B, Sorensen HT. Birth outcome in Danish women with cutaneous malignant melanoma. Melanoma Res. 2007;17(1):31–36. doi: 10.1097/CMR.0b013e3280124749. [DOI] [PubMed] [Google Scholar]
- 17.Langagergaard V, Gislum M, Skriver MV, et al. Birth outcome in women with breast cancer. Br J Cancer. 2006;94(1):142–146. doi: 10.1038/sj.bjc.6602878. [DOI] [PMC free article] [PubMed] [Google Scholar]
- 18.Stout MJ, Frey HA, Tuuli MG, et al. Loop electrosurgical excision procedure and risk of vaginal infections during pregnancy: an observational study. BJOG. 2015;122(4):545–551. doi: 10.1111/1471-0528.13252. [DOI] [PMC free article] [PubMed] [Google Scholar]
- 19.Romero R, Espinoza J, Goncalves LF, Kusanovic JP, Friel L, Hassan S. The role of inflammation and infection in preterm birth. Semin Reprod Med. 2007;25(1):21–39. doi: 10.1055/s-2006-956773. [DOI] [PMC free article] [PubMed] [Google Scholar]
- 20.Helmo FR, Alves EAR, Moreira RAA, et al. Intrauterine infection, immune system and premature birth. J Matern Fetal Neonatal Med. 2017:1–7. doi: 10.1080/14767058.2017.1311318. [DOI] [PubMed] [Google Scholar]
- 21.Hakim FT, Cepeda R, Kaimei S, et al. Constraints on CD4 recovery postchemotherapy in adults: thymic insufficiency and apoptotic decline of expanded peripheral CD4 cells. Blood. 1997;90(9):3789–3798. [PubMed] [Google Scholar]
- 22.Wiser I, Orr N, Kaufman B, et al. Immunosuppressive treatments reduce long-term immunity to smallpox among patients with breast cancer. J Infect Dis. 2010;201(10):1527–1534. doi: 10.1086/651950. [DOI] [PubMed] [Google Scholar]
- 23.Wo JY, Viswanathan AN. Impact of radiotherapy on fertility, pregnancy, and neonatal outcomes in female cancer patients. Int J Radiat Oncol Biol Phys. 2009;73(5):1304–1312. doi: 10.1016/j.ijrobp.2008.12.016. [DOI] [PMC free article] [PubMed] [Google Scholar]
- 24.Stava CJ, Jimenez C, Vassilopoulou-Sellin R. Endocrine sequelae of cancer and cancer treatments. J Cancer Surviv. 2007;1(4):261–274. doi: 10.1007/s11764-007-0038-6. [DOI] [PubMed] [Google Scholar]
- 25.Patterson BC, Truxillo L, Wasilewski-Masker K, Mertens AC, Meacham LR. Adrenal function testing in pediatric cancer survivors. Pediatr Blood Cancer. 2009;53(7):1302–1307. doi: 10.1002/pbc.22208. [DOI] [PubMed] [Google Scholar]
- 26.Sharma D, Shastri S, Sharma P. Intrauterine Growth Restriction: Antenatal and Postnatal Aspects. Clin Med Insights Pediatr. 2016;10:67–83. doi: 10.4137/CMPed.S40070. [DOI] [PMC free article] [PubMed] [Google Scholar]
- 27.Yahalom J, Illidge T, Specht L, et al. Modern radiation therapy for extranodal lymphomas: field and dose guidelines from the International Lymphoma Radiation Oncology Group. Int J Radiat Oncol Biol Phys. 2015;92(1):11–31. doi: 10.1016/j.ijrobp.2015.01.009. [DOI] [PubMed] [Google Scholar]
- 28.Thoburn KK, German RR, Lewis M, Nichols PJ, Ahmed F, Jackson-Thompson J. Case completeness and data accuracy in the Centers for Disease Control and Prevention’s National Program of Cancer Registries. Cancer. 2007;109(8):1607–1616. doi: 10.1002/cncr.22566. [DOI] [PubMed] [Google Scholar]
- 29.Dobie SA, Baldwin LM, Rosenblatt RA, Fordyce MA, Andrilla CH, Hart LG. How well do birth certificates describe the pregnancies they report? The Washington State experience with low-risk pregnancies. Matern Child Health J. 1998;2(3):145–154. doi: 10.1023/a:1021875026135. [DOI] [PubMed] [Google Scholar]
- 30.Vinikoor LC, Messer LC, Laraia BA, Kaufman JS. Reliability of variables on the North Carolina birth certificate: a comparison with directly queried values from a cohort study. Paediatric and perinatal epidemiology. 2010;24(1):102–112. doi: 10.1111/j.1365-3016.2009.01087.x. [DOI] [PMC free article] [PubMed] [Google Scholar]
- 31.DiGiuseppe DL, Aron DC, Ranbom L, Harper DL, Rosenthal GE. Reliability of birth certificate data: a multi-hospital comparison to medical records information. Matern Child Health J. 2002;6(3):169–179. doi: 10.1023/a:1019726112597. [DOI] [PubMed] [Google Scholar]
- 32.Northam S, Knapp TR. The reliability and validity of birth certificates. J Obstet Gynecol Neonatal Nurs. 2006;35(1):3–12. doi: 10.1111/j.1552-6909.2006.00016.x. [DOI] [PubMed] [Google Scholar]
- 33.Dietz PM, Bombard JM, Hutchings YL, et al. Validation of obstetric estimate of gestational age on US birth certificates. American journal of obstetrics and gynecology. 2014;210(4):335 e331–335. doi: 10.1016/j.ajog.2013.10.875. [DOI] [PMC free article] [PubMed] [Google Scholar]
- 34.Andrade SE, Scott PE, Davis RL, et al. Validity of health plan and birth certificate data for pregnancy research. Pharmacoepidemiol Drug Saf. 2013;22(1):7–15. doi: 10.1002/pds.3319. [DOI] [PMC free article] [PubMed] [Google Scholar]
Associated Data
This section collects any data citations, data availability statements, or supplementary materials included in this article.