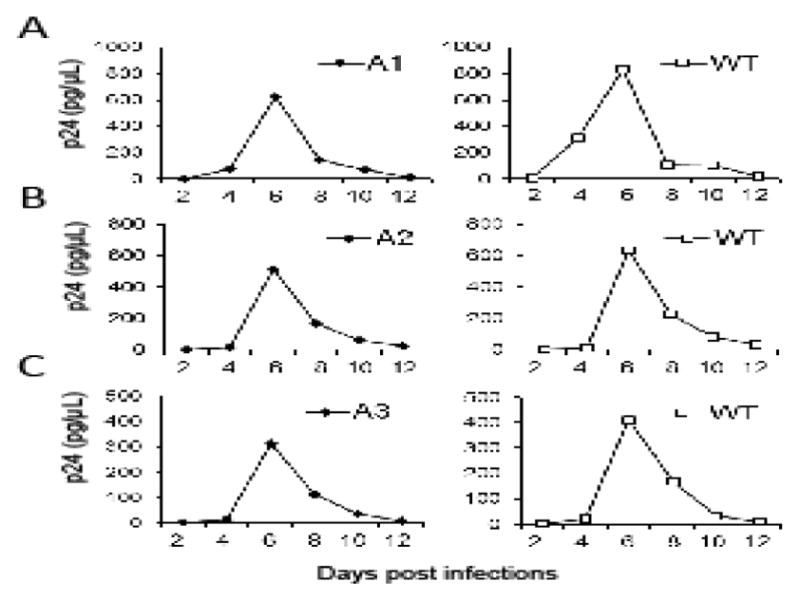
Fig. 3.

Replication kinetics of the wild-type and the mutant viruses. Representative replication kinetics of mutant viruses (A1, A2, A3) are shown on the left whereas those from NL4-3 virus performed in parallel are shown on the right. Equal amounts of viruses were used to infect CEM cells, supernatants were harvested at 2, 4, 6, 8, 10 or 12 days post-infection, and virus production was measured by p24 ELISA. Three independent experiments were performed for each mutant; one representative replication curve for each mutant virus is shown.
