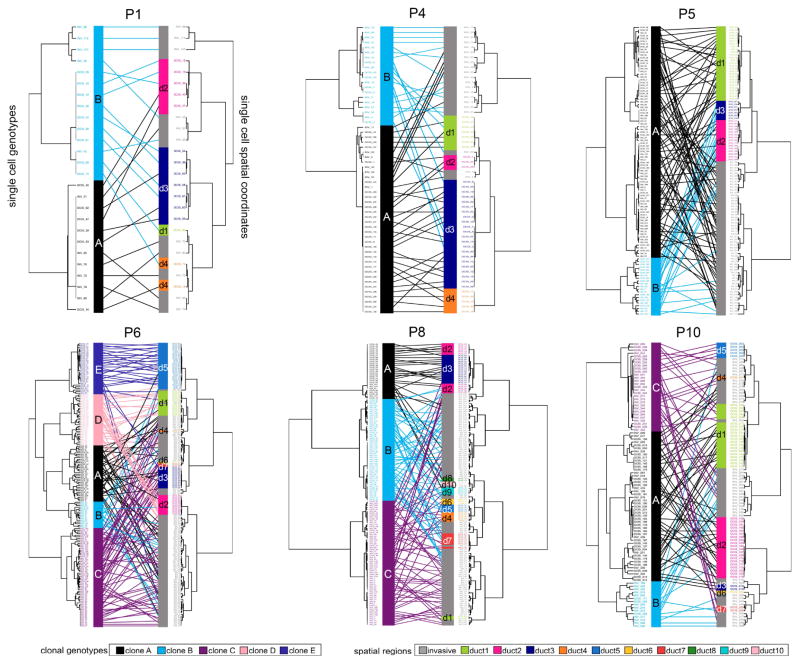
Figure 5. Mapping of Spatial Coordinates and Clonal Genotypes.
Genomic copy number trees were mapped to spatial coordinate trees using tanglegrams in the 6 polyclonal patients. Genotype trees are located on the left side for each patient, with clonal subpopulations indicated by color. Spatial trees are located on the right side with different ducts indicated by colors, and the invasive regions colored in grey. Mapping of cells coordinates and genotypes were performed by minimizing overlapping connections.

