

Abstract
Thermal degradation of insulin complicates its delivery and use. Previous efforts to engineer ultra-stable analogs were confounded by prolonged cellular signaling in vivo, of unclear safety and complicating mealtime therapy. We therefore sought an ultra-stable analog whose potency and duration of action on intravenous bolus injection in diabetic rats are indistinguishable from wild-type (WT) insulin. Here, we describe the structure, function, and stability of such an analog, a 57-residue single-chain insulin (SCI) with multiple acidic substitutions. Cell-based studies revealed native-like signaling properties with negligible mitogenic activity. Its crystal structure, determined as a novel zinc-free hexamer at 2.8 Å, revealed a native insulin fold with incomplete or absent electron density in the C domain; complementary NMR studies are described in the accompanying article. The stability of the analog (ΔGU 5.0(±0.1) kcal/mol at 25 °C) was greater than that of WT insulin (3.3(±0.1) kcal/mol). On gentle agitation, the SCI retained full activity for >140 days at 45 °C and >48 h at 75 °C. These findings indicate that marked resistance to thermal inactivation in vitro is compatible with native duration of activity in vivo. Further, whereas WT insulin forms large and heterogeneous aggregates above the standard 0.6 mm pharmaceutical strength, perturbing the pharmacokinetic properties of concentrated formulations, dynamic light scattering, and size-exclusion chromatography revealed only limited SCI self-assembly and aggregation in the concentration range 1–7 mm. Such a combination of favorable biophysical and biological properties suggests that SCIs could provide a global therapeutic platform without a cold chain.
Keywords: diabetes, hormone, protein engineering, protein structure, receptor tyrosine kinase
Introduction
Insulin has long provided a model for biochemical and biophysical studies of globular proteins with application to human health (1). The first protein to be sequenced and the first recombinant therapeutic protein, insulin is central to the hormonal control of vertebrate metabolism. Since its discovery in 1921, the hormone has provided a mainstay of treatment for diabetes mellitus (2). Whereas insulin itself contains two polypeptide chains (A and B) as the proteolytic product of a single-chain precursor (proinsulin (3)), the hormone belongs to an ancestral metazoan superfamily of single-chain homologs (4), including vertebrate insulin-like growth factors (IGFs (5, 6)) and invertebrate neuroendocrine factors (7). This study and accompanying article (8) drew inspiration from these evolutionary relationships to investigate the structure, stability, and function of a single-chain insulin analog (SCI)6 with high biological activity and enhanced thermodynamic stability.
The structure of insulin (Fig. 1, A–C) has been extensively investigated by X-ray crystallography (1, 9) and NMR spectroscopy (10–13). Although stored within pancreatic β-cells as zinc-stabilized hexamers (14), the hormone functions in the bloodstream as a zinc-free monomer (6). The native conformation contains three α-helices, two in the A chain (21 residues; green in Fig. 1C) and one in the B chain (30 residues; blue). Globular folding is stabilized by two inter-chain disulfide bridges (cystines A7–B7 and A20–B19) and one intra-chain bridge (cystine A6–A11). The core is sealed at one face by the B chain's C-terminal β-strand (residues B24–B28). This β-strand forms an antiparallel β-sheet at the classical dimer interface (Fig. 1B), a building block of zinc insulin hexamers (Fig. 1A) (1). Substitutions at positions B28 and B29 have enabled design of rapid-acting insulin analogs for mealtime injection or use in pumps (15). Whereas clinical use of animal insulins gave way in the 1980s to recombinant human insulin (16), current therapeutic regimens often employ analogs with enhanced pharmacokinetic (PK) properties. Their development represented an early triumph of structure-based protein design in pharmacology (2).
Figure 1.

Structural overview and insulin analog sequences. A, crystal structures of T6 (porcine insulin; PDB code 4INS (1)), T3Rf3 (B29–A1 single chain insulin; PDB code 6INS (19)), and R6 (human insulin; PDB code 1ZNJ) hexamers, as labeled. In each structure, the T state protomers are gray and R state protomers are green. HisB10 side chains are displayed as sticks with coordinated Zn2+ ions as red spheres. The second axial Zn2+ ion lies directly behind the first. B, anti-parallel β-sheet dimer interface of porcine insulin (PDB code 4INS). C, overlay of a T state protomer of B29–A1 single-chain insulin (transparent gray; PDB code 6INS) and porcine insulin (PDB code 4INS). The latter displays the A (green) and B (blue) chains and three native disulfide bridges (yellow sticks): A20–B19, A7–B7, and A6–A11 (black boxed labels). Side chains of WT residues ThrA8 and TyrA14 are highlighted as red sticks. The C-terminal B chain segment (important in both dimerization and IR binding) is labeled. Red dashed line and asterisk represent C domains of proinsulin and SCIs. D, protein sequences of SCI-a and SCI-b as well as progenitor SCI-c (29). Peptide bonds connecting the A and B domains to the C domain are illustrated with red lines. Substitutions relative to WT insulin are identified by red letters. Gold lines identify the three native disulfide bonds. Black arrows at bottom of D highlight residues B10, B28, B29, and A14, key sites of substitution.
Crystallographic studies of an insulin monomer bound to domain-minimized models of the insulin receptor (IR) (17, 18) demonstrated that the B chain β-strand pivots from the α-helical core to insert in trans between IR α-subunit domains (the N-terminal Leu-rich domain (L1) from one protomer and the C-terminal element (αCT) of the other; for review of IR domains, see Ref. 6). Such pivoting unmasks an otherwise hidden non-polar surface of the A chain (including IleA2 and ValA3), thereby extending the hormone's primary receptor-binding surface (17, 18). This conformational transition rationalizes a wealth of prior biochemical data (10, 19–22), including early studies of insulin analogs modified by bifunctional reagents to cross-link the C-terminal segment of the B chain and the N terminus of the A chain (23, 24). These studies demonstrated that short cross-links markedly impair IR binding, whereas longer cross-links could, at least in part, restore activity.
Studies of SCIs began in the 1980s with the advent of microbial manufacture of insulin (16). Providing trypsin-cleavable manufacturing intermediates (mini-proinsulins), these recombinant proteins contain a peptide bond to the N terminus of the A chain (GlyA1) from a residue at or near the C terminus of the B chain (ThrB30) (25, 26). Constrained within a closed conformation, such SCIs (50–53 residues) exhibited favorable folding properties and hence high manufacturing yield (25, 27), but they were essentially devoid of biological activity despite native-like structures (19, 26) The T3Rf3 crystal structure of B29-A1 mini-proinsulin, like the “dog that did not bark in the night-time,”7 was remarkable for the absence of perturbations (central panel in Fig. 1A) (19).
Subsequent studies of single-chain chimeric insulin-IGF proteins suggested that insertion of the 12-residue IGF-I connecting (C) domain between insulin's ThrB30 and GlyA1 could restore, at least in part, IR affinity (28). Interest in active SCIs was first stimulated by potential applications in viral gene therapy.8 Their biophysical properties have been investigated in relation to insulin fibrillation (29, 30), a form of physical degradation (31) that makes necessary a pharmaceutical “cold chain” of storage and distribution (32). Circumventing this complex and costly process defines a current translational goal of insulin analog design (32, 33).
Here, we describe the structure and function of an active SCI with sequence features designed to co-optimize its biophysical, biochemical, and biological properties (SCI-a in Fig. 1D and Table 1). The C domain contains 6 residues, resulting in a 57-residue protein. To enhance solubility, the protein contains acidic substitutions predicted to reduce its isoelectric point from 5.4 (wild-type (WT) insulin)9 to 4.9. Sites of substitution were chosen to impair binding to the mitogenic type 1 IGF receptor (IGF-1R) (34, 35) and enhance stability (29, 36). The crystal structure of SCI-a, obtained herein at 2.8 Å resolution, depicts a novel zinc-free hexamer containing native-like insulin folds with apparent disorder in the C domains. Whereas SCI-a forms classical dimers (Fig. 1B), their hexameric assembly differs from that of zinc-coordinated two-chain insulin hexamers (Fig. 1A) (1, 37). In the accompanying article (8) we employed heteronuclear NMR methods to investigate the solution structure and dynamics of a monomeric SCI variant (SCI-b in Fig. 1D). The two SCIs differ at positions B28 and B29 in accordance with well-established structure–activity relationships underlying past design of rapid-acting clinical analogs (38–40).
Table 1.
SCI sequence design features and their associated rationale
| Design element | Rationale |
|---|---|
| GluC1–GluC2 | Isoelectric shift (for enhanced solubility) and hypothesized reduction in IGF-1R cross-binding |
| GlyC3–ProC4 | Facilitates flexible chain reversal in direction of A1–A8 helixa |
| ArgC5–ArgC6 | Mimics the charge pattern of the dibasic cleavage site at the C to A domain junction in proinsulina |
| HisA8 | Stability enhancement through optimization of A1–A8 helical C-capa |
| GluA14 | Protein stabilization through reduction in entropic penalty likely incurred by solvent exposed TyrA14 in the WTb |
| GluB29 (SCI-a) | Formation of stable dimersc |
| AspB28–ProB29 (SCI-b) | Accelerated hexamer/dimer disassemblyd |
a Data are as in the SCI-c prototype (29).
b A14 was hypothesized to exhibit the “reverse hydrophobic effect” (103) wherein the WT solvent-exposed and hydrophobic tyrosine side chain would destabilize the folded state. Replacement with charged (hydrophilic) and solvated GluA14 would ameliorate this effect. Although a GluA14-insulin analog has been previously synthesized (59) with no significant change in hormone activity, to our knowledge, the isolated contribution of TyrA14 → Glu to thermodynamic stability has not yet been determined.
c Data are as in insulin glulisine, a fast-acting clinical analog (40).
This study paid particular attention to the duration of biological action as defined by the pharmacodynamic (PD) properties of the insulin analog on intravenous (i.v.) bolus injection. Because insulin clearance from the bloodstream is >20-fold more rapid than physiological attenuation of insulin signaling (41), such studies probe the duration of insulin signaling at target tissues once the IR is engaged. Previous efforts to obtain ultra-stable analogs, either by introduction of an additional disulfide bridge (33) or by design of an active SCI (29), encountered aberrant prolongation of in vivo glucose-lowering activity (Fig. S1). Such prolonged signaling would be unfavorable for prandial or pump-based therapy (15) and could be associated with adverse biological effects (42).
To our knowledge, SCI-a provides the first example of an ultra-stable insulin analog whose in vivo duration of action is similar to that of WT insulin. The analog exhibits striking resistance to thermal degradation with prolonged retention of biological activity. Moreover, its cell cycle–related transcriptional signaling resembles WT insulin and not single-chain homolog IGF-I or mitogenic insulin analogs (34). Together, these studies highlight the translational promise of ultra-stable SCIs as a platform for global distribution without the cost and complexity of a therapeutic cold chain. Such molecular technologies, motivated by the current diabetes pandemic, may be especially important in the developing world (32, 43).
Results
SCI-a and monomeric analog SCI-b incorporated multiple design elements for simultaneous optimization of biophysical and therapeutic properties. These elements were introduced based on prior studies of two-chain insulin analogs (38, 39) and a single-chain prototype (SCI-c (29)). Key sequence features and their rationale are summarized in Table 1. Whereas the C domain (EEGPRR) contains offsetting negative and positive charges, the set of substitutions in the A and B domains was expected to accentuate the proteins' net negative charge at neutral pH and thereby mitigate both native and non-native aggregation (44).
The SCIs contain exclusively WT residues at the hormone's classical (site 1) and accessory (site 2) receptor-binding surfaces (6, 18). Stabilizing acidic substitutions at residue B10 (Asp or Glu) was avoided due to their association with enhanced mitogenicity and carcinogenesis (34). Retention of HisB10 was also intended to enable zinc-mediated hexamer assembly (1), traditionally employed to stabilize pharmaceutical formulations (45). Near the site 1 interface, HisA8 (a feature of avian insulins (36)) has previously been shown to enhance both stability and receptor binding, presumably as a more favorable α-helical C-cap residue than ThrA8 (30, 36).
An overarching objective was avoidance of anomalously prolonged activity on i.v. bolus injection as observed in prior ultra-stable insulin analogs (Fig. S1). Such prolongation, first reported by Vinther et al. (33) in studies of an insulin analog stabilized by a fourth disulfide bridge (Fig. S1, A and C), was reproducible in our hands (black triangles in Fig. S1D) and also seen in studies of a prior SCI prototype (SCI-c; blue crosses in Fig. S1D and structure in Fig. S1B). These studies employed male Lewis rats rendered diabetic by streptozotocin (30). Use of i.v. bolus injection circumvented PK issues related to the subcutaneous depot (41).
SCI-a and SCI-b each exhibited substantial activity in the i.v. rat assay (Fig. 2). Results are shown in relation to the absolute blood-glucose concentration (Fig. 2A) and relative to the starting blood-glucose level (Fig. 2B). The PD profile of SCI-a (orange circles in Fig. 2) was similar to that of insulin lispro (red squares), whereas SCI-b exhibited a late tail of insulin action (green triangles) similar to that of SCI-c (Fig. S1D). The native-like PD profile of SCI-a implies that its clearance and duration of cellular signaling are similar to WT insulin. Despite its native potency in vivo, receptor-binding studies of SCI-a in vitro revealed decreased affinity for the A (by 5-fold) and B (by 15-fold) isoforms of the IR with at least 10-fold reduction in affinity for the type 1 IGF receptor (IGF-1R). The respective receptor-binding affinities of SCI-b were similarly reduced (Table S2).
Figure 2.
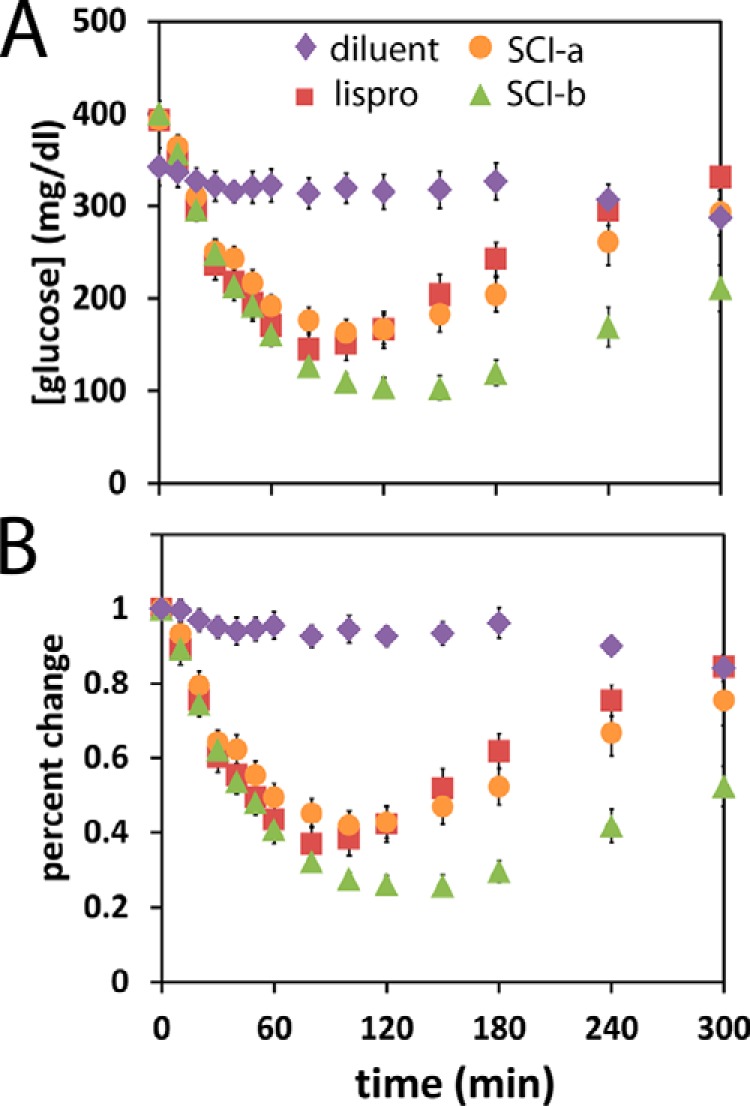
Rat studies of fresh insulin analog solutions. Shown are rat studies of insulin action following i.v. injection of 1.7 nmol/300-g rat of the specified SCI or control. A, blood-glucose concentration; B, percent change relative to initial blood-glucose concentration. Symbols are defined as inset in A. Samples sizes: (diluent control) n = 12; (insulin lispro) n = 13; (SCI-a) n = 13; and (SCI-b) n = 10.
SCI-a retains canonical structure as a zinc-free hexamer
The crystal structure of SCI-a was determined as a zinc-free hexamer to a resolution of 2.8 Å (Fig. 3A). Diffraction statistics are given in Table 2. The asymmetric unit contained the entire hexamer, and so the structure provided six independent protomers (labeled A–F) forming three independent dimers (AB, CD, and EF). Electron density corresponding to the C domains was absent as was (to a varying extent among protomers) density corresponding to adjoining residues in the A and B domains (gray dashed lines in Fig. 3A). The most complete map pertained to protomer D (gold in Fig. 3A): weak density was observed at ProB28 and GlyA1, whereas intervening residues (sequence ETEEGPRR) were not visualized. The average pairwise root-mean-square deviations (r.m.s.d.) among main-chain atoms well-defined in each protomer was 0.75(±0.09) Å. Following analogous pairwise alignment and comparison of the three dimers, mean r.m.s.d. among main-chain atoms was 1.0(±0.2) Å.
Figure 3.

SCI-a crystal structure and electron density map. A, ribbon model of novel zinc-free hexamer. Electron densities of the B1–B4, B27–B30, and C1–C6 segments were poor in all SCI-a monomers; gray dashed lines (connecting α-carbons) in each monomer denote missing C domains in the hexamer. B and C, backbone superposition of all SCI-a dimers (color scheme as in A) aligned according to the main-chain atoms of residues A1–A8, A13–A19, and B9–B19 (helices) of the 4INS dimer (gray) (B) and all SCI-a monomers aligned according to the above main-chain atoms in 4INS monomer 1 (gray) (C). NA, CA, NB, and CB labels respective chain termini of the A and B chains of 4INS; the termini of one SCI-a monomer (brown) are likewise labeled by N and C. Disulfide bonds are not shown. D, SCI-a hexamer with residues B9, B10, and B13 within hexamer core displayed as sticks. The gray boxed region is expanded in the stereo view of the core in E. E, stick representations of residues B9–B13 and underlying electron density (2m|Fo| − D|Fc|; gray wire frame). Side-chain labels are provided as white text with black outlines. Atom colors: pink/red, oxygen, and blue, nitrogen; carbons are colored as in respective monomers in D.
Table 2.
Crystallographic data collection and refinement statistics for SCI-a
| Data collection | |
| Source | SSRL BL7-1 |
| Wavelength (Å) | 1.12709 |
| Space group | P21 |
| Unit cell dimensions | a = 43.382, b = 85.771, c = 45.696 Å |
| β = 110.89° | |
| Resolution (Å) | 38.22–2.80 (2.95–2.80)a |
| Rmerge (%) | 5.6 (30.9) |
| I/σI | 15.2 (3.6) |
| Completeness (%) | 99.3 (96.0) |
| Redundancy | 3.7 (3.5) |
| No. of reflections | 7718 |
| Refinement | |
| Resolution (Å) | 38.22–2.80 |
| R-factor/RFree (%) | 25.10/31.42 |
| No. of protein atoms | 2155 |
| r.m.s.d. bond length (Å) | 0.007 |
| r.m.s.d. bond angle (°) | 1.098 |
| Average B-factors (Å2) | |
| Chain A | 78.5 |
| Chain B | 79.5 |
| Chain C | 59.8 |
| Chain D | 69.1 |
| Chain E | 84.1 |
| Chain F | 54.4 |
| Ramachandran plot (%) | |
| Most favored region | 94.8 |
| Additionally allowed regions | 4.8 |
| Generously allowed regions | 0.4 |
| Disallowed regions | 0.0 |
a Values in parentheses are for the highest resolution shell.
Each protomer exhibited a canonical T state conformation (Fig. 3C; porcine insulin monomer 1 as reference structure). Relative to six reference T state protomers in prior crystal structures of insulin, the mean pairwise main-chain r.m.s.d. was 0.71 Å (Table S1A) with a range of 0.60–0.95 Å. Each dimer likewise conformed to a classical T2 dimer (Fig. 3B). Relative to reference dimers in two prior crystal structures, the mean main-chain r.m.s.d. was 1.10 Å with range 0.96–1.33 Å (Table S1B, left). Higher r.m.s.d. were obtained on comparison of the SCI-a hexamer with classical insulin hexamers (Table S1B, right), reflecting a novel change in dimer–dimer orientation relative to zinc insulin hexamers (1). This observation, as well as the potential presence of magnesium ion coordination (Fig. 3, D and E), is further evaluated under “Discussion” (below).
The absence of C domain electron density suggests its flexibility. To probe such apparent disorder, SCI-b was prepared as a monomeric model. Whereas 1H NMR spectra of SCI-a exhibited concentration-dependent resonance broadening (Fig. S2, A–D), the spectrum of SCI-b exhibits narrow resonances even at a concentration of 1 mm (Fig. S2E). The solution structure and dynamics of SCI-b are described in our accompanying article (8).
SCIs exhibited enhanced stability and resistance to physical degradation
Stability was assessed by CD-monitored guanidine denaturation. Free energies of unfolding (ΔGU) were calculated based on two-state modeling (Table 3). SCI-a (ΔGU 5.0(±0.1) kcal/mol) is ∼2 kcal/mol more stable than insulin lispro (3.0(±0.1) kcal/mol); under these conditions the stability of WT insulin was reported to be 3.3(±0.1) kcal/mol, in accordance with prior studies (46). SCI-b was somewhat less stable than SCI-a (ΔΔGU 0.3(±0.2) kcal/mol) as expected based on its B28–B29 element (47). These assays predict that formulations of SCI-a and SCI-b would exhibit slower rates of chemical degradation (45).
Table 3.
CD denaturation and fibrillation studies
| Analog | ΔGUa | m-valueb | Cmidc | Fibrillation lag time (days)d |
|---|---|---|---|---|
| kcal/mol | kcal/(mol·m) | m | ||
| WT insulin | 3.3 ± 0.1 | 0.69 ± 0.01 | 4.8 ± 0.1 | 5.3 ± 0.5 |
| lispro | 3.0 ± 0.1 | 0.63 ± 0.01 | 4.7 ± 0.1 | 4.3 ± 0.2 |
| SCI-a | 5.0 ± 0.1 | 0.86 ± 0.01 | 5.8 ± 0.1 | >140 |
| SCI-b | 4.7 ± 0.1 | 0.82 ± 0.01 | 5.7 ± 0.1 | >110 |
a Data are from two-state modeling of CD-guanidine titrations performed at 25 °C and pH 7.4.
b The m-value (units of kcal/(mol·m)) is the slope of unfolding free energy ΔGU versus molar concentration of denaturant.
c Cmid is the guanidine denaturant concentration at which 50% of the protein is in the unfolded state.
d SCI analogs at U-100 concentration were gently rocked in triplicate at 45 °C in modified Lilly® diluent containing Zn2+ ions, wherein Tris-HCl was substituted for sodium phosphate buffer. WT insulin and lispro fibrillation studies utilized gentle rocking at 45 °C of the pharmaceutical formulations Humulin® and Humalog®, respectively; both are U-100 strength in Lilly® diluent. Error in associated lag times is the standard deviation of triplicate samples.
Susceptibility to physical degradation, defined as aggregation-coupled misfolding without breakage of chemical bonds, was assessed through measurement of lag times in fibrillation assays (30, 45). The studies were performed in glass vials at a protein concentration of 0.6 mm (corresponding to WT U-100 formulations) at 45 °C with gentle agitation in the presence of an air–liquid interface. Such conditions mimicked insulin solutions transported in the developing world without benefit of a cold chain (32). Whereas WT insulin (Humulin®) and lispro (Humalog®) were observed to begin fibrillation within a few days, fibrillation of SCIs was not observed despite prolonged thermal stress (Table 3).
SCIs exhibited enhanced solubility with decreased aggregation
To assess solubility and aggregation, SCIs in Zn2+-containing solutions compatible with pharmaceutical formulation were studied by turbidimetry (Fig. 4A) and rp-HPLC (Fig. 4B). WT insulin at pH 7.4 began to precipitate between 5 and 7 mm. Whereas at 7 mm <60% of WT insulin was HPLC-detectable after centrifugation (Fig. 4B), the SCIs at 7 mm were fully recoverable.
Figure 4.

Studies of protein self-assembly and aggregation. A, concentration dependence of optical absorbance at 500 nm (turbidimetry (78)); insulin analogs were dissolved in Tris-HCl buffer (pH 7.4) containing zinc, phenol, and meta-cresol. Error bars represent the standard deviation of four measurements. B, studies of protein solubility; rp-HPLC-based estimates are presented as fraction of protein recovered after centrifugation. Error per measurement in B is fixed at 10% to reflect deviations between multiple injections of 10-μg Humalog® standard (see “Experimental procedures”). C, SEC of insulin analogs at stated concentrations (7, 5, and 1 mm). Elution peaks are labeled with calculated masses (in kDa) as interpolated from a set of molecular mass standards (see under “Experimental procedures” and Fig. S5). D and E, dynamic light scattering. Field autocorrelation functions (D, solid lines are fits) and inferred size distributions (E) by the regularization method (91) for insulin analogs at stated concentrations. Blue arrow in E highlights presence of large aggregates of WT insulin at 5 mm. Color code: WT insulin, blue; SCI-a, green; and SCI-b, red.
Protein aggregation was probed by size-exclusion chromatography (SEC; Fig. 4C). Samples were made 1–7 mm and diluted on entrance to the Zn2+-free mobile phase and SEC matrix. As this simulates dilution and clearance of formulation buffer upon subcutaneous injection, zinc-coordinated species such as hexamers are not observed (46). At 5–7 mm WT insulin eluted as a heterogeneous mixture of oligomers with masses between those of the dimer (∼12 kDa) and hexamer (∼35 kDa); peaks were observed at 23.2 and 17.6 kDa. At 1 mm, the elution time corresponded to a mass of 8.3 kDa, providing evidence of a monomer–dimer equilibrium. Although also heterogeneous, SCI-a at 5–7 mm was less polydisperse than WT insulin; its elution time corresponding to a mass of 12.2 kDa, close to that predicted of an SCI dimer. At 1 mm, SCI-a yielded an elution profile similar to that of WT insulin. SCI-b eluted as a monomer (6.2–7.2 kDa) at all concentrations tested. For all samples, no V0 peak corresponding to elution of aggregates larger than the column molecular weight range were observed.
We further evaluated the distribution of protein aggregates in the presence of zinc-containing formulation buffer by dynamic light scattering (DLS; Fig. 4, D and E), which is more sensitive to large aggregate formation than SEC. All analogs form hexamers in the above concentration range, as indicated by the presence of hydrodynamic radii (Rh) between 2 and 3 nm. Although it was difficult to distinguish the DLS signatures of insulin monomers and dimers (Rh ∼1–2 nm) from that of hexamers (Rh = 2.8 nm) due to similar translational diffusion rates (48), at 7 mm both WT insulin and SCI-a exhibited a combined monomer–dimer–hexamer signal.
WT insulin also formed large aggregates with radii ∼1000 and 10,000 nm, the signal from such higher-order aggregates was attenuated in the SCI solutions as indicated by (i) rarer bursts in count rate associated with large aggregates at each protein concentration, and (ii) comparative studies at 5 mm at which only WT insulin forms micron-sized species. Smaller aggregates (Rh ∼100–150 nm) were weakly detectable in all 1 mm solutions, in part due to the disproportionate sensitivity of DLS to larger aggregates relative to smaller assemblies (48).
SCIs were refractory to thermal inactivation
To assess thermal inactivation, an SQ rat assay was employed to test activities of protein solutions following gentle agitation at 45 or 75 °C (upper panel in Fig. 5A); conditions were as described for the fibrillation lag-time assay (above). Fractional areas under the curve (AUC; lower panel at center in Fig. 5A) were extracted to estimate fractional changes (upper right-hand panel) and percent maintenance of activity (lower right-hand panel). Results demonstrated that the SCIs exhibited prolonged retention of activity under conditions wherein current clinical analogs degraded (Fig. 5, B–E). Thus, SCI-a and SCI-b both remain fully active when incubated at 45 °C with gentle agitation for 140 days (SCI-a) and 111 days (SCI-b), whereas essentially complete inactivation of standard analogs insulin lispro (after 5 days) and insulin glargine (after 11 days) was observed (Fig. 5, B and D). Similar trends were obtained at 75 °C (Fig. 5, C and E).
Figure 5.

Rat studies of heat-stressed insulin analogs. A, schematic diagram of the thermal inactivation assay wherein formulations of insulin at U-100 (0.6 mm) in septum-sealed glass vials are gently rocked in an oven set to either 45 or 75 °C. At the indicated times, the vials were removed followed by dilution and SQ injection into diabetic rats to assess residual potency. Bottom panel of A shows the resulting glucose-response curves for a fully active (black) and completely dead analog (red), the latter of which would give an identical curve to a diluent-only control. These curves are integrated and processed to provide AUC and AOC. These metrics provide fractional AUC, a reporter of significant differences between the fresh and heated analog data, and percent activity, which illustrates degree of inactivation following heating. Fractional AUC for the stated fresh (white) or heated (gray) analogs are given for 45 °C (B) and 75 °C (C) experiments. Heated incubation times are given below the appropriate analog name. Percent (%) activities for the experiments in B and C are given in D and E. *, p < 0.1; **, p < 0.05, ns, not significant (p > 0.1). Sample sizes for each SQ experiment were n = 4–5 rats and analog doses ranged from 3.0 to 6.0 nmol/300-g rat. Doses in this range do not produce significantly different glucose-response profiles. The dose and sample size of any given analog set was the same for fresh and heated injections.
SCIs exhibited no increase in mitogenic signaling relative to WT insulin
Cellular signaling was assessed in two cell lines: rat L6 myoblasts overexpressing insulin receptor isoform A (L6-IRA (49)) and human MCF-7 breast cancer cells (50); the latter expresses human IGF-1R and to a lesser extent IR isoforms A (IR-A) and B (IR-B) (50). Following exposure to 100 nm hormone (WT insulin, SCI, or control analogs; top left in Fig. 6A), transcriptional activation of mitogenic/proliferative pathways was assessed by real-time quantitative PCR (rt-qPCR; schematic at bottom right in Fig. 6A). In addition, ligand-dependent IR tyrosine phosphorylation and Akt serine phosphorylation were probed by Western blotting as respective probes of receptor activation and post-receptor signaling (top right in Fig. 6A; Ref. 51). A flowchart describing these assays and their rationale is provided in Fig. S3. These blots were performed to verify that analogs inducing reduced mitogenic transcriptional activation still execute a significant insulin-stimulated response from the L6-IRA and MCF-7 cells.
Figure 6.

Cell biological assessment of insulin signaling. A, schematic outline of cell-based assays for the assessment of hormone-induced IR-A signaling and activation of mitogenic pathways. L6 rat myoblasts stably expressing human IR isoform A (IR-A) (developed by De Meyts and co-workers (49)) or MCF-7 human breast cancer cells expressing both IR isoforms (IR-A and IR-B) and high levels of IGF-1R (50) were treated with SCI analogs or control two-chain analogs. After 15 min of treatment, Tyr-phosphorylation of IR and Akt was assessed by Western blotting (51) (upper flowchart). To analyze relative mitogenic potencies, L6-IRA or MCF-7 cells treated for 8 h were collected, and the transcriptional response of cell proliferation markers cyclin D1 and cyclin G2 (cell cycle schematic adapted from Ref. 102) was assessed by rt-qPCR (schematic adapted from Bio-Rad). The increased accumulation of cyclin D1 and decreased cyclin G2 mRNA served as readouts for insulin-induced activation of cellular proliferation pathways (bottom flowchart). B, assessment of insulin-driven cyclin D1 and G2 transcription in L6-IRA cells; known mitogenic analogs (dashed box) yield increased accumulation of cyclin D1 mRNA and repression of cyclin G2. Brackets designate p values: *, <0.05, or **, <0.01; ns indicates p values >0.05. C, histogram representation of the average fold increase over diluent and dot-plot representation of the actual fold increase over diluent for each data point collected from L6-IRA Western blottings of p-IR/IR (left) and histogram average and actual dot-plot representations of the ratio of p-Akt to total cell Akt obtained from L6-IRA blots of p-Akt/Akt (right). D and E, studies in a human breast cancer cell line. MCF-7 cell-derived rt-qPCR (D) and phosphorylation Western blot data (E) are presented as in B and C. Histograms: n = 3; ± standard error. ** or * indicates p value < 0.01 or <0.05. Whiskers for the dot-plot follow Tukey's box plot method: lowest data point within 1.5 Interquartile Range (IQR) of the lower quartile, and the highest data point within 1.5 IQR of the upper quartile. Abbreviations: Con, diluent control; X10, AspB10-insulin; WT insulin; KP, insulin lispro.
In the rt-qPCR assay mitogenic analogs AspB10-insulin (labeled “X10”) and IGF-I (34) effected a reduction in cyclin G2 transcription with an increase in cyclin D1 mRNA accumulation (Fig. 6, B and D). By contrast, WT insulin and lispro exhibited decreased cyclin D1 activation and cyclin G2 repression. The rt-qPCR signatures of SCI-a and SCI-b resembled WT insulin and lispro and were distinct from the rt-qPCR signatures of AspB10-insulin or IGF-I (Fig. 6, B and D). Western blotting revealed that the SCIs nonetheless stimulated IR and Akt phosphorylation to an extent similar to or greater than WT insulin or lispro (Fig. 6, C and E; see also Fig. S4).
Discussion
Proinsulin, the biosynthetic precursor of insulin, is a single chain with domain organization B–C–A (3). Flanked by dibasic sites, the 35-residue C domain is excised by prohormone convertases in pancreatic β-cells, yielding the mature two-chain hormone (52). Vertebrate C domains vary in length (30–35 residues) and are less well conserved than are the A and B domains (Table S3) (53). Although proinsulin binds to IR isoforms more weakly than does WT insulin (relative affinity 5%) (54), the precursor retains substantial biological activity in vivo (55). Its therapeutic efficacy was evaluated in the 1980s as a partial hepatoselective agonist (55). Although clinical trials were terminated due to excess cardiovascular deaths (55), these data provided proof of principle for an SCI-based regimen.
Our interests have focused on insulin analogs that are less susceptible to physical and chemical degradation than WT insulin or current clinical analogs (32). Such degradation is exacerbated above room temperature (31, 45), leading to guidelines from the United States Food and Drug Administration regarding the distribution, storage, shelf life, and disposal of pharmaceutical formulations (56). A particular problem is posed by the susceptibility of two-chain analogs (i.e. all current insulin products) to fibrillation (31). Because creation of an amyloidogenic nucleus (“seeds”) can occur on their transient exposure to moderately high temperatures (31) and because such seeding can accelerate fibrillation even in refrigerated solutions (57), distribution of insulin formulations presently requires a complex and costly cold chain (32, 43). Implications for global health have been deepened by an emerging pandemic of type 2 diabetes mellitus (32, 43).
In this and our accompanying article (8), we have investigated the structure and function of an ultra-stable SCI with a six-residue C domain. The connecting domain sequence (EEGPRR) contains offsetting negative (bold) and positive (italics) charges. The former element was introduced to disfavor binding to IGF-1R, a receptor associated with mitogenic signaling (58), whereas the latter (mimicking the natural dibasic site) was intended to interact with GluA4 (29) to stabilize the adjoining A domain α-helix (residues A1–A8), an unstable “Achilles' heel” in the mechanism of insulin fibrillation (30). The central GlyC3–ProC4 element (underlined above) was intended to promote flexible chain reversal. SCI-a also contained substitutions in the A and B domains intended to augment stability, solubility, and receptor binding in accordance with previous studies of two-chain analogs (Table 1) (36, 59). Substitution of HisB10 by Asp, incorporated in a previous SCI design (29) to augment stability and activity (SCI-c in Fig. 1D), was excluded due to its association with elevated mitogenicity and carcinogenesis in rats (34, 60). Because these adverse effects may, at least in part, reflect the enhanced affinity of AspB10-insulin for the IR isoforms and IGF-1R (relative affinities >200%) with increased residence times (34), our design criteria tolerated relative affinities <100% in cell-free assays provided native potency was maintained in vivo.
Previous efforts to engineer ultra-stable insulin analogs encountered a puzzling prolongation of signaling on i.v. bolus injection (Fig. S1) (33). Such extended duration of activity was observed, for example, in otherwise elegant studies of two-chain analogs stabilized by a fourth non-canonical disulfide bridge (33). This PD perturbation presumably reflected an alteration in cellular events that mediate termination of insulin signaling. Analogous perturbations have not been observed in studies of current long-acting insulin products, whose protracted action reflects conventional PK properties rather than delayed signal termination by target cells (61). Irrespective of molecular mechanism, such prolonged signaling would preclude use in insulin pumps and raise safety concerns on chronic administration (42).
Unlike the above analog (33) and our prior SCI prototype (sequence SCI-c at bottom in Fig. 1D (29, 62)), i.v. bolus injection of SCI-a in streptozotocin-induced diabetic rats was found to reproduce the PD profile similar to that of insulin lispro (Fig. 2). Modification of the B domain in SCI-b (intended as a monomeric NMR model; see accompanying article (8)) nonetheless conferred a delayed “tail” in blood-glucose recovery. This tail exhibited greater prominence in SCI-c (Fig. S1D). Biochemical principles relating SCI sequence to duration of action in vivo are not presently understood. The native-like PD properties of SCI-a motivated studies of its structure, stability, and possible mode of receptor binding as discussed in turn.
Crystal structure reveals native-like subunits in novel hexamer
The compatibility of the canonical insulin fold with direct B-A peptide bonds or with C domains of variable length reflects the native proximity of the C terminus of the B domain and N terminus of the A domain (25, 26, 63). Although ThrB30 is disordered in some crystal structures (37) and exhibits motional narrowing in solution structures of engineered insulin monomers (12), in a subset of crystallographic protomers a salt bridge has been observed between the C-terminal B30 carboxylate and the N-terminal amino group of GlyA1 (1). We thus anticipated that the crystal structure of SCI-a would depict native insulin folds with preservation of a canonical dimer interface.
Crystallographic analysis of SCI-a at moderate resolution (2.8 Å) indeed revealed an ordered and native-like α-helical subdomain (spanning residues B4–B19 and A1–A21); its dimer interface (including dimer-related antiparallel β-sheet; B24–B28 and B28′–B24′) was similar to that of WT insulin (37). Unusually, the structure was obtained in the absence of zinc ions and presence of high concentrations of magnesium ions. The only existing zinc-free insulin hexamer crystallized de novo required GluB13 → Gln substitution to alleviate electrostatic repulsion within the hexamer (64). Near-complete extraction of zinc ions from WT T6 hexamers on soaking 2-Zn insulin crystals with EDTA yielded native-like hexamers (65). Neither of these prior structures anticipated the shift in dimer–dimer orientations observed in the present crystal structure.
SCI-a by contrast retains GluB13. Although metal-ion density in the SCI-a hexamer core (Fig. 3, D and E) was not observed due to either diffraction resolution limitations or ion static or dynamic disorder, magnesium coordination or binding is possible. Packing defects among HisB10 and GluB13 side chains were observed (top half of Fig. 3E). It is possible that protonation of the B10 imidazole rings may offset the negatively charges of GluB13; the side chains of SerB9 may also participate in stabilizing hydrogen bonds (lower half of Fig. 3E). It would be of future interest to measure the pKa values of HisB10 and GluB13 in such a metal-ion-free hexamer to allow their protonation states to be inferred. The free space surrounded by these negatively charged and polar residues could be occupied by an interacting magnesium cation, magnesium hydrate, or possibly hydronium molecules.
Evidence for disorder in the crystal state was provided by qualitative features of the electron-density maps. In this crystal form the asymmetric unit was the hexamer itself, and so three independent views of the SCI dimer were obtained, in turn providing six views of the C domain. Each dimer exhibited a canonical interface with discontinuous electron density between B27 and A1. In most monomers, density in this region was not interpretable. An exception, monomer D included some density for residues B28–B29 and C6. Although static disorder in the lattice can in principle contribute to such attenuated or discontinuous electron density, the consistency of these findings motivated design of SCI-b to enable NMR studies as described in our accompanying article (8).
The structure of the SCI-a hexamer exhibits a novel change in dimer–dimer orientations relative to canonical T6, T3Rf3, and R6 zinc-insulin hexamers (structures given in Fig. 1A) (9, 19, 37, 64). Specifically, the trimer interface (Fig. 7), which is composed of the three independent dimers (AB, CD, and EF), is unprecedented. With alignment of AB dimers (Fig. 8, A–C), the other two dimers (CD and EF) in SCI-a are rotated about 24–26° (Table 4) relative to their usual orientation in T6 insulin. This large deviation results in high pairwise r.m.s.d. between SCI-a and classic T6 hexamers (Table S1B, right). Alignment of EF dimers or CD dimers (Fig. 8, D and E, and Table 4) produces similar transformations for the remaining dimers, although the axis of rotation/translation shifts away from the dimer center of mass. The average rotational deviation of non-aligned dimers (Table 4) is 28(±4)°. Whereas WT T6 hexamers are symmetric, the SCI-a hexamer is asymmetric as shown by alignment of dimer AB to CD of a replicated structure (Fig. 8F).
Figure 7.

Self-assembly surfaces of insulin and novel SCI-a hexamer. A, color-coded sequence of WT insulin. Residues at dimer interface (blue), trimer interface (green), or metal ion binding in the hexamer (pink) are highlighted. B, classical 4INS T6 hexamer with trimer interface of monomer B (gray) and monomer C (green) boxed in red. C, stereo view of red-boxed region in A with residues at the trimer interface (B17, B18, A12, A13, and A17) from both protomers shown as sticks. D, stereo view of SCI-a trimer interface with appropriate residues highlighted as sticks. 4INS monomer C is a gray ghost to highlight its rotation relative to its counterpart protomer C in SCI-a. For this, dimer AB of 4INS was aligned to dimer AB of SCI-a. Color code: red, oxygen; blue, nitrogen; carbons are colored as in schematic monomer representations.
Figure 8.

Structural relationship between SCI-a hexamer and classical T6 zinc hexamer. Shown are minimized cylindrical representations showing only the B9–B19 helices of SCI-a (green) and T6 human insulin (PDB code 1MSO (37); blue). A, alignment of dimer AB of SCI-a to dimer AB of 1MSO via the backbone of all three native helices. Red bars drawn in 3D denote the axis of rotation about which dimers CD and EF must independently be translated and rotated to align to the classic T6 arrangement of dimers CD and EF in 1MSO. B and C, enlarged views of alignment in A with independent alignment transformations for dimers CD and EF, respectively. Alignment via main-chain atoms of the three α-helices and their dimer-related mates within dimer CD to CD (D) and dimer EF to EF (E); independent alignment vectors for remaining dimers (red bars) are illustrated in A. F, dimer CD of an SCI-a copy was aligned to dimer AB of the original (green).
Table 4.
Orientation of SCI-a dimers relative to T6 hexamers
| Aligned dimera | Transformed dimerb | Rotation | Translation |
|---|---|---|---|
| ° | Å | ||
| AB | CD | 26.00 | 0.90 |
| AB | EF | 24.20 | 1.70 |
| CD | AB | 24.06 | 1.63 |
| CD | EF | 33.58 | 0.53 |
| EF | AB | 26.10 | 0.00 |
| EF | CD | 33.67 | 0.37 |
| Mean (±S.D.) | 27.9 (±4.5) | 0.9 (±0.7) |
a “Aligned dimers” in SCI-a were first aligned to the same dimer in T6 human insulin (PDB code 1MSO) by the backbone atoms of helices A1–A8, A13–A19, and B9–B19.
b Transformations necessary to align the “Transformed Dimer” in SCI-a to its counterpart in 1MSO were calculated in PyMOL and are presented as degrees rotation and angstrom translation (along the axis of rotation).
It is possible that the zinc-free crystal structure of SCI-a (schematically represented as ellipsoids in Fig. 9B) is of biological relevance. Proinsulin translation and oxidative folding occurs in the ER of β-cells (Fig. 9A, left). After folding and upon (i) transit through Golgi apparatus and (ii) packaging into immature secretory granules (66), the C domain is cleaved by specific prohormone convertases (52) at dibasic sites in the BC and CA junctions. The mature hormone is stored (Fig. 9A, middle) as Zn2+-stabilized hexamers within specialized secretory granules (67), which dissociate upon secretion into the portal circulation (Fig. 9A, right). SCI-a is the first GluB13-containing insulin to form zinc-free hexamers de novo. Building upon this observation, it is possible that proinsulin forms zinc-free hexamers in the ER and/or Golgi where zinc content is typically low ([Zn2+]ER = 0.9 pm and [Zn2+]Golgi = 0.6 pm in HeLa cells (68)) to enable zinc-dependent self-assembly. The novel dimer orientations (mean ∼28° rotation relative to classic T6 dimers) in the SCI-a hexamer, which is zinc-free but may contain magnesium ions that are either disordered or unseen at 2.8 Å resolution, may reflect those within the hypothetical zinc-free proinsulin hexamers in the ER and/or Golgi (Fig. 9B) that, upon entry into secretory granules via the ZnT8 transporter (67) and coordination to Zn2+, acquire the dimer orientations of classic T6 insulin (Fig. 9C).
Figure 9.
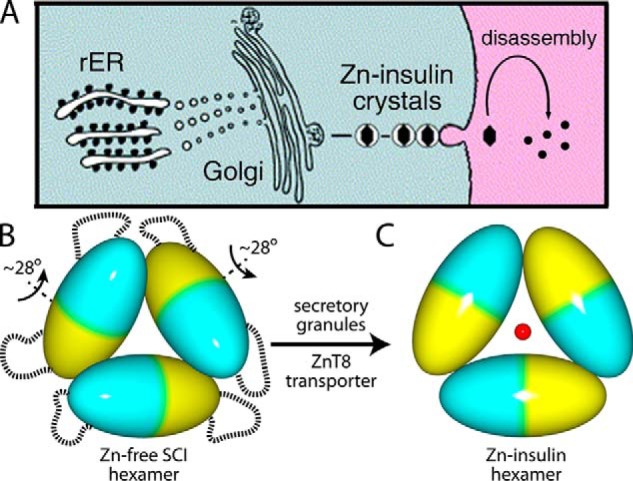
Insulin self-assembly in β-cell-specific biosynthetic pathway. A, proinsulin biosynthesis in the β-cells begins in the rough endoplasmic reticulum (rER) (left) followed by trafficking through the Golgi apparatus (middle) and storage into zinc-insulin granules, ultimately leading to glucose-regulated secretion with disassembly in the bloodstream (right). B, ellipsoid model of SCI-a zinc-free hexamer. Each ellipsoid represents an insulin dimer; monomers are denoted by blue or yellow. Dashed lines indicate disordered C domains on hexamer surface. Each ellipsoid is rotated an average of 28° relative to the bottom ellipsoid (see Table 5). C, corresponding model of classical T6 zinc insulin hexamer with two axial zinc ions (red sphere; the second axial zinc ion is hidden directly behind sphere). Packaging of WT insulin hexamers into zinc-containing storage vesicles is enabled by granule-specific zinc transporter ZnT8 (67).
SCI might bind to the receptor via threading of αCT
In accordance with an extensive prior literature (19, 20, 22), recent crystallographic studies of insulin bound to a domain-minimized insulin micro-receptor (μIR) demonstrated that the B24–B27 segment of insulin is displaced from its classical packing against the A1–A8 and B9–B19 α-helices (17, 18). Effected by changes in Ramachandran dihedral angles flanking PheB24, this “unhinging” (by ∼60° relative to classical crystal structures of the free hormone dimer or hexamer (17, 18)) enables conserved non-polar surface (spanned by the side chains of IleA2, ValA3, PheB24, and PheB25) to engage the receptor (17, 18). An extended B24–B27 segment lies in a groove between receptor elements L1 and αCT (17, 18). Residues B28–B30, not well conserved among vertebrate insulins and dispensable for activity (1), were presumed to be disordered in the μIR complex. Accordingly, these three residues would amplify the orientational freedom of the C domain as a flexible tether between ThrB27 and GlyA1 at the hormone–μIR interface.
To enable IR binding, we speculate that the B domain of SCI-a undergoes a change in conformation similar to that observed in WT insulin on μIR binding (residues B23–B27; black strand in Fig. 10A). An essential feature of this co-crystal structure is the reposition of αCT (purple ribbon in Fig. 10A) over the surface of L1 (powder blue) to occupy space ordinarily taken (in insulin's free conformation) by the C-terminal segment of the B chain (green strand). In the WT insulin–μIR complex the B24–B30 segment must pivot both (a) to re-position conserved aromatic residues PheB24, PheB25, and TyrB26 and (b) to expose the conserved aliphatic side chains of IleA2 and ValA3 (data not shown). The C domain in the free hormone (dashed line in Fig. 10A), extended by flexible residues B28–B30, must therefore reposition to span the gap between ThrB27 and GlyA1 at the μIR interface (red arrow in Fig. 10A). Thus, we envision that in the bound state SCI-a would open a hole through which αCT would “thread.” A similar “threading model” may pertain to homologous IGF–IGF-1R complexes (69). To test the plausibility of this model, molecular dynamics simulations of an SCI bound to the μIR complex are described in our accompanying article (8).
Figure 10.

Open state of receptor-bound insulin and its implications for mechanism of fibrillation. A, crystal structure of WT insulin (A chain, yellow; B chain, black) bound to the μIR (17). The B24–B30 segment (black; only observed up to B26) of WT insulin inserts between IR L1 (blue) and αCT (pink) domains (18). The classical (unbound) conformation of the insulin B chain is displayed in green; aromatic side chains B24–B26 in the unbound monomer are presented as sticks. Dashed line and asterisk indicate a schematic C domain in unbound SCI-a. The red embossed arrow indicates that the C domain of the bound SCI may wrap about the αCT segment of the IR in an SCI-αCT threading motif. This panel was adapted from Pandyarajan et al. (90) with permission of the authors. This research was originally published in the Journal of Biological Chemistry. Pandyarajan, V., Phillips, N. B., Rege, N. K., Lawrence, M. C., Whittaker, J., and Weiss, M. A. Contribution of TyrB26 to the function and stability of insulin: structure-activity relationships at a conserved hormone-receptor interface. J. Biol. Chem. 2016; 291:12978–12990. © the American Society for Biochemistry and Molecular Biology. B, transmission electron microscopy image of mature insulin fibrils induced by heat (reproduced with permission from Ref. 72). This research was originally published in Journal of Biological Chemistry. Hua, Q. X., and Weiss, M. A. Mechanism of insulin fibrillation: the structure of insulin under amyloidogenic conditions resembles a protein-folding intermediate. J. Biol. Chem. 2004; 279:21449–21460. © the American Society for Biochemistry and Molecular Biology. C, schematic nucleation pathway of insulin fibrillation is mediated by aggregation of a distorted monomeric conformation (black trapezoid at center; adapted with permission from Yang et al. (30) (This research was originally published in the Journal of Biological Chemistry. Yang, Y., Petkova, A., Huang, K., Xu, B., Hua, Q. X., Ye, I. J., Chu, Y. C., Hu, S. Q., Phillips, N. B., Whittaker, J., Ismail-Beigi, F., Mackin, R. B., Katsoyannis, P. G., Tycko, R., and Weiss, M. A. An Achilles' Heel in an amyloidogenic protein and its repair: insulin dynamics, misfolding, and therapeutic design. J. Biol. Chem. 2010; 285:10806–10821. © the American Society for Biochemistry and Molecular Biology.); models of insulin protofilament and their higher-order assembly are shown at far right (reproduced with permission from the authors (70) (Jimenez, J. L., Nettleton, E. J., Bouchard, M., Robinson, C. V., Dobson, C. M., and Saibil, H. R. (2002) The protofilament structure of insulin amyloid fibrils. Proc. Natl. Acad. Sci. U.S.A. 99, 9196–9201. Copyright (2002) National Academy of Sciences)).
Enhanced stability predicts resistance to chemical and physical degradation
SCI-a exhibits enhanced thermodynamic stability relative to WT insulin (ΔΔGU = 1.7 kcal/mol as inferred from chemical-denaturation studies; Table 3). This estimate was based on two-state modeling (46), which may introduce baseline fitting artifacts in the presence of considerable resistance to denaturation. Nevertheless, the reliability of this method was corroborated by our companion NMR studies (8). Previous studies of the susceptibility of insulin analogs to chemical degradation suggested that such a change in ΔGU predicts reduced rates of a variety of processes (breakage or rearrangement of disulfide bridges, scission of peptide bonds, deamidation of Asn, and formation of iso-Asp) that can impair activity and confer immunogenicity (45). Such processes are likely to be faster in the unfolded state than in the native state.
The SCIs demonstrated remarkable resistance to physical degradation as probed by fibrillation assays at elevated temperatures (Table 3) and associated rat studies of heat-stressed protein solutions (Fig. 5). Insulin fibrils (transmission electron micrograph in Fig. 10B), like pathological amyloid deposits in general (70), are thought to arise from nucleation by non-native aggregates (71). Lag times in kinetic studies of protein fibrillation reflect rare intermediate conformational fluctuations among distorted monomers, whose aggregation can provide amyloidogenic nuclei (Fig. 10C) (30). A variety of evidence suggests that splaying of the B chain C-terminal strand from the α-helical core promotes insulin fibrillation (29, 31, 71, 72). Whereas mature fibrils (far right in Fig. 10C) presumably represent the true thermodynamic ground state of insulin as a heteropolymer, the closed conformation of the B chain and its native self-assembly thus protect the hormone from physical degradation (far left in Fig. 10C).
We suggest that the foreshortened C domain in SCI-a and SCI-b provides a topological barrier to amyloid formation (29, 30). By delimiting the extent to which B30 may separate from A1, an SCI whose C domain is below a critical length imposes a partial or total block to nucleation (blocked arrows in Fig. 10C). This model assumes that in an insulin protofilament the A and B domains undergo a substantial α → β transition in accordance with fiber diffraction studies (70). Because proinsulin is susceptible to fibrillation, its long C domain (35 residues) must confer sufficient conformational flexibility to enable packing of the distorted A and B domains within the fibril's cross-β assembly (73). It would be of future interest to determine a 3D structure of an insulin protofilament in relation to the free and μIR-bound structures of a foreshortened SCI.
SCI-a and IGFs exhibit similar structures but differ in mitogenic signaling
IGF-I and IGF-II are insulin-like peptides with ∼40% sequence identity to insulin and similar 3D structures; their domain organization is similar to an SCI (74) with the addition of a C-terminal D region. Analogous to that of SCI-a in this study, crystal structures of IGF-I and IGF-II typically exhibit poorly defined density in the C region (69, 74), suggesting conformational flexibility or disorder. Furthermore, crystallization of IGF-I and IGF-II has required a binding partner, such as an IGF-binding protein, an IGF receptor fragment, anti-IGF antibody, or detergent molecule, presumably to prevent non-specific aggregation and reduce conformational flexibility of the monomer (74, 75). IGFs do not form ordered hexamers analogous to those of insulin due to GluB10, LysB28, and ProB29 (residue positions 9, 27, and 28 in IGF-I). GluB10 would be expected to block axial zinc coordination, whereas LysB28 and ProB29 would impair dimerization as in insulin lispro. NMR studies of IGFs are discussed in our accompanying article (8).
The signaling activities of the SCIs (in comparison with those of WT insulin, AspB10–insulin, and IGF-I) were tested in (i) L6 rat myoblast cells with exogenous overexpression of human IR-A and (ii) MCF-7 human mammary adenocarcinoma cells (50) expressing high levels of IGF-1R and, to a lesser extent, IR-A and IR-B. The proliferative phenotype was correlated with representative gene-regulatory markers (encoding cyclin D1 and cyclin G2) as evaluated by rt-qPCR. The biological signature of cell-cycle progression, as probed by transcriptional activation (cyclin D1) or repression (cyclin G2), has previously been validated by De Meyts and co-workers (34) at the protein level; our assay monitored the analogous process at the level of mRNA accumulation. Because of its technical simplicity and reproducibility, we believe that the rt-qPCR approach enhances the utility of such assays to probe differences in mitogenic signaling among insulin analogs (other families of growth factors). In the future, this approach may be extended from two genes to gene-regulatory networks.
SCI-a demonstrated no increased activation of mitogenic pathways relative to WT insulin and lispro. Notably, SCI-b showed a similarly low level of cyclin D1 accumulation (Fig. 6B) in both cell lines. Although not originally intended as a candidate therapeutic, these data suggest that SCI-b may also be safe for clinical use10 despite demonstrating delayed blood-glucose recovery (through unknown mechanisms) on i.v. injection (Fig. 2). These results correlate with (but are more informative than) in vitro receptor-binding affinities of SCIs for IR-A, IR-B, and IGF-1R ( Table S2). This study has thus demonstrated novel ultra-stable insulin analogs that appear not to be mitogenic, raising confidence in their safety for potential human use.
Although biased agonists of G-protein–coupled receptors have been identified (76), such synthetic molecules have not yet been discovered in the context of receptor tyrosine-kinase networks, including the IR. Naturally-occurring biased agonists of IR include insulin, which favors Akt-mediated metabolic pathways, and IGF-II, which preferentially activates mitogen-activated protein kinase (MAPK)-mediated mitogenic pathways (51). An example of biased metabolic stimulation has been provided by a recent study of an insulin-mimetic peptide that favored activation of hepatic lipid metabolism in an obese rodent model of type 2 diabetes mellitus (77). As the search for metabolic-biased and/or non-mitogenic insulin therapeutics expands (2), this study has described a straightforward rt-qPCR method for screening the mitogenic signaling activities of novel analogs with minimal sample consumption. Furthermore, our results obtained from two cell lines (L6-IRA and MCF-7) suggest that the rt-qPCR method can be extended to other cellular models pertinent to insulin action, such as primary hepatocytes in culture. Future development of this technique may enable identification of analogs that preferentially stimulate Akt-mediated pathways relative to MAPK-mediated pathways.
Enhanced solubility and decreased aggregation may offer clinical advantages
The net negative charge of SCI-a at neutral pH was enhanced by substitutions LysB29→ Glu and TyrA14 → Glu (offset to a limited extent by HisA8). Its IEF-defined isoelectric point (Table 5) was reduced by ∼0.6 units relative to WT insulin. This shift was associated with enhanced solubility (>7 mm by turbidimetry (78) and rp-HPLC (79)) in a buffer compatible with pharmaceutical formulation. Concentration-dependent precipitation of SCI-a or SCI-b was not observed, in striking contrast to WT insulin (∼60% soluble at 7 mm; Fig. 4B). SEC studies suggested that, under conditions similar to those in an SQ depot (Fig. 4C), WT insulin in the concentration range of 5–7 mm forms a heterogeneous mixture of aggregates, whereas at these concentrations SCIs were predominantly dimeric (SCI-a) or monomeric (SCI-b). DLS likewise indicated that the SCIs are less prone than WT insulin to form large protein aggregates.
Table 5.
Isoelectric points of WT insulin and SCI analogs
a Data were calculated using protein sequence and ProtParam.
b Data were as measured by IEF electrophoresis.
Aggregation and precipitation are significant general barriers to development of high-concentration solutions of therapeutic proteins. In the case of insulin there is a growing clinical need due to increasing prevalence of marked insulin resistance (defined as >200 units of insulin per day) (80). Such high insulin requirements are primarily encountered in obese patients but may also be associated with lipodystrophy and in pregnancy. Use of standard insulin formulations (0.6 mm) in such patients requires large injection volumes, which can be painful and inconsistently absorbed (80). Interest in ultra-concentrated insulin formulations has been further generated by innovative engineering efforts to miniaturize insulin pumps, including implantable devices for intraperitoneal delivery (80).
Unfortunately, aggregation of WT insulin at high concentrations markedly delays its SQ absorption (38). Thus, rather than being rapid-acting as a regular U-100 insulin formulation, Humulin® R U-500 (3 mm; Lilly) exhibits the prolonged PD properties of a twice-a-day microcrystalline insulin suspension (Neutral Protamine Hagedorn) due to delayed subcutaneous absorption (80). In small clinical trials, U-500 treatment of patients with marked insulin resistance was nonetheless associated with better glycemic control than was achieved in the same patients treated with U-100 formulations (81). Off-label use of U-500 in insulin pumps has also been described despite safety concerns regarding prolonged hypoglycemia following overdelivery (80). These observations have led to the recent reformulation of insulins lispro and aspart (AspB28-insulin) at double the standard strength (U-200 or 1.2 mm (82)), near the limit of concentration as rapid-acting products.
Our results hold promise to the development of ultra-concentrated and yet rapid-acting insulin formulations. The remarkable solubility of SCI-a (≥7 mm) and its limited aggregation under these conditions in principle makes possible rapid-acting U-500 formulations and even strengths ≥U-1000. Such applications might enhance the efficacy and safety of multi-injection regimens in patients with marked insulin resistance and enable next-generation external and implanted insulin pumps (80).
Concluding remarks
The coming years will soon mark the 50th anniversary of the crystal structure of insulin (1969) and centennial of its discovery (1921). The intervening decades have been remarkable for the interplay between basic science and its translation. Pharmaceutical manufacture of recombinant human insulin, for example, has long exploited proinsulin or “mini-proinsulin” analogs as production intermediates (16, 25, 26). The latter exhibit more efficient folding and secretion in yeasts Saccharomyces cerevisiae and Pichia pastoris than does proinsulin, enhancing fermentation yields (25, 27). Increased in vitro folding efficiency has likewise been described in a synthetic 49-residue “des-Di” polypeptide containing a peptide bond between residues B28 and A1 (63).
In this and our accompanying article (8), we have sought to extend the role of an SCI from manufacturing intermediate to therapeutic protein. This extension may provide an ultra-stable template by which to prolong shelf life and circumvent the global cold chain of insulin distribution, with particular utility in developing regions experiencing high year-round temperatures and sparse access to refrigeration (32). Furthermore, the resistance of SCI-a to higher-order self-assembly at high protein concentrations may enable, for the first time, development of ultra-high-strength rapid-acting insulin formulations. Such applications motivated foundational studies of structure and function with a focus on the identification of Achilles' heels in the protein fold that, when exploited through conformational fluctuations, results in the formation of amyloid nuclei and fibrils that underlie physical degradation (30). Such weakness in native two-chain insulins is avoided with the foreshortened C domain of SCIs, which provides a topological barrier to amyloid fibril formation (29, 30), enhancing physical stability and thereby extending projected pharmaceutical shelf life.
The present findings have uncovered salient questions for further investigation. How flexible are connecting domains, and to what extent might the dynamics of the tether be coupled to conformational fluctuations in the globular portion of the structure? How do the structural and dynamic properties of an SCI enable its engagement by the insulin receptor? Finally, what controls the duration of signaling at the cellular level, and in particular why are some ultra-stable analogs associated with aberrant prolongation of signaling in vivo? This and our accompanying article (8) promise to provide a foundation for addressing these questions.
Experimental procedures
Construction of SCI expression vectors
A set of plasmids (pPICZα) was constructed for expression in yeast P. pastoris directing secretion of SCI precursors into media (21, 83). A template plasmid for SCI precursors, designated pPICZαTKSCI-c, was first constructed from a synthetic gene purchased from Genscript (Piscataway, NJ) encoding (from 5′ to 3′) the following: (i) an α-factor pre-pro-leader and Kex2-cleavage site (EKR) connected to (ii) spacer sequence (EEAEAEAEPK); both are N-terminal to (iii) the coding sequence of SCI-c. An XbaI site was included at the 3′-end to facilitate cloning; codon usage was optimized for expression in P. pastoris. The synthetic gene was cloned into the XhoI and XbaI sites (respective nucleotides 1185 and 1272) (84). Following sequence verification (Molecular Cloning Laboratories, San Francisco), this construct provided a template for synthesis (via the QuikChange site-directed mutagenesis kit from Agilent, Santa Clara, CA) of pPICZα A plasmids encoding precursors of SCI-a, SCI-b, or variant “mini-proinsulins” (MPI); the latter encodes single-chain precursors of two-chain analogs [AspB10]insulin, 4SS-DKP, and DKP insulins (respectively designated DB10-MPI, 4SS-DKP-MPI, and DKP-MPI), where “DKP” denotes substitutions AspB10, LysB28, and ProB29. For construction of MPI derivatives from pPICZαTKSCI-c, a long single-stranded DNA primer (Ultamer from Integrated DNA Technologies, Coralville, IA) was amplified by PCR, and the purified product was used as a primer in the QuikChange reaction according to the manufacturer's instructions. DKP-MPI differs from insulin lispro in three respects: (a) addition of HisB10 → Asp; (b) deletion of B30; and (c) incorporation of short tripeptide sequence EWK connecting B29 to A1. 4SS-DKP-MPI has the same sequence as DKP-MPI, but with IleA10 → Cys and GlnB4 → Cys, enabling formation of fourth disulfide linkage (cystine A10–B4 (33)). DB10-MPI possesses the WT insulin sequence except for AspB10 and EWK linker. Final PCR products were amplified and isolated from Escherichia coli DH5α cells as described by the vendor (EasySelect Pichia Expression kit; Invitrogen), followed by sequence verification (Molecular Cloning Laboratories).
Biosynthesis of SCI precursor
Biosynthesis of SCI precursors followed an established protocol (85). First, electroporation of competent P. pastoris strain X33 with isolated SCI-precursor pPICZα plasmid (corresponding to either SCI-a, SCI-b, SCI-c, DKP-MPI, or 4SS-DKP-MPI) was performed with Gene Pulser II (Bio-Rad) as described in the EasySelect Pichia Expression kit (Invitrogen) followed by selection on sterile YPDA + Z plates (1% yeast extract, 2% peptone, 2% dextrose, 2% agar, 100 μg/ml Zeocin). After 3 days of incubation at 30 °C, protein expression by transformant colonies was assessed via small-scale culture in 50-ml Falcon tubes. Colonies were inoculated into 10-ml autoclave-sterilized YPS + Z media (1% yeast extract, 2% peptone, 0.1 m sorbitol, 100 μg/ml Zeocin) and grown for 24 h at 30 °C with stirring speed 225 rpm (C25KC Incubator/Shaker; New Brunswick Scientific, Edison, NJ). Cells were then diluted into new 10-ml volumes of YPS + Z to an A600 nm of 0.33 and incubated for 3 days at 30 °C with 225 rpm stirring; methanol was added to 1% after the first 24 h and to 0.5% at 48 and 72 h. After pelleting (1500 × g for 5 min), 19 μl of each culture's supernatant was analyzed by SDS-PAGE (NuPAGE 12% BisTris; Life Technologies, Inc.) to assess relative SCI-precursor expression levels. After verifying the presence of the SCI precursor (7601, 7587, and 7455 Da for SCI-a, SCI-b, and SCI-c precursors, respectively) in the supernatant by matrix-assisted laser-desorption ionization/time-of-flight mass spectrometry (MALDI-TOF MS; 4700 Proteomics Analyzer; Applied Biosystems, Foster City, CA), the colony presenting the most intense SCI-precursor band (at 6–8 kDa) by SDS-PAGE was selected for post-transformational vector amplification (86). Iterative amplification, adapted for the SCI system, increased pPICZα plasmid copy number (and thereby SCI-precursor expression (87)) by (i) growing colonies overnight in 10 ml of YPS + Z media (30 °C with 225 rpm stirring); (ii) streaking cells on YPDA selection plates containing increasing Zeocin concentration (200, 400, 1000, and finally 2000 μg/ml); (iii) expression screening (as above) of amplified colonies; and (iv) regrowth of the highest-expressing strain followed by selection on YPDA plates containing the next Zeocin concentration step. Iterative amplification (i.e. repeating steps i–iv above) was stopped once a strain resistant to 2000 μg/ml Zeocin was obtained.
For scaled SCI-precursor production, cells were inoculated in a flask containing 100 ml of YPG + Z (1% yeast extract, 2% peptone, 2% glycerol, 100 μg/ml Zeocin) and grown to 20 A600 nm at 30 °C with stirring. Cells were then added to fermentation medium (5% glycerol, 2% (NH4)2SO4, 1.2% KH2PO4, 0.47% MgSO4·7H2O, 0.036% CaCl2·2H2O, 1% yeast extract, 1% peptone, and 0.5% fermentation Pichia trace metal 1 (PTM1; Bioworld, Dublin, OH)) in a fermentation vessel (BioFlo310, New Brunswick Scientific, Edison, NJ) to a final 0.25 A600 nm. Expression of an SCI precursor was induced by adding methanol to 1%. After fermentation, supernatant containing SCI precursors was collected by centrifugation and purified (see below).
Purification of recombinant yeast product
Hydrophobic-interaction chromatography (butyl-Sepharose 4 Fast Flow resin; GE Healthcare) was used to capture the SCI precursors. Purifications by rp-HPLC were performed using 0.1% trifluoroacetic acid (TFA) in water as aqueous mobile phase (buffer A) and 0.1% TFA in acetonitrile as the organic modifier (buffer B). Preparative purifications utilized a Waters 2545 quaternary pumping system with FlexInject (Waters). The SCI precursors were isolated by preparative C4 rp-HPLC (C4 Proto 300 Å, 10-μm, 20 × 250 mm; Higgins Analytical Inc., Mountain View, CA). Eluted SCI precursors were collected and lyophilized.
Preparation of ACP-1 protease
A gene encoding Achromobacter protease I (ACP-1), derived from Achromobacter lyticus (88), was cloned into a pET15b plasmid; its sequence contained substitution Lys30 → Arg (to enhance stability) and a C-terminal His tag (GSGSHHHHHH; to enable affinity purification). The plasmid was transformed into competent E. coli cells (strain BL21(DE3) pLysS as described by the vendor; Promega, Madison, WI) with selection on lysogeny broth (LB) plates containing 100 μg/ml ampicillin and 34 μg/ml chloramphenicol. ACP-1-expressing cells were grown at 37 °C in LB media (with antibiotics) to 1.0 A600 nm followed by induction with 0.8 mm isopropyl β-d-1-thiogalactopyranoside for 20 h at 25 °C. Cells were collected by centrifugation, washed in 100 mm Tris-HCl (pH 8.0), and resuspended in buffer containing 100 mm Tris-HCl (pH 8.0), 1 mm EDTA, and 20% sucrose. Cells were lysed via 10 min of gentle agitation in the presence of lysozyme (0.2 mg/ml) at 25 °C followed by addition of ice-cold water to lysate for 10 min. Lysates were centrifuged at 2500 × g (Centrifuge 5810R; Eppendorf, Hauppauge, NY) for 15 min. To immobilize His-tagged ACP-1, supernatants were incubated with Ni-Sepharose Fast Flow resin (GE Healthcare) at 25 °C for 1 h, rinsed with wash buffer (50 mm sodium phosphate (pH 6.5), 300 mm NaCl, 2 mm imidazole), and resuspended in digestion buffer (25 mm Tris-HCl (pH 8.5), 1 mm EDTA, 0.1 m urea).
Enzymatic cleavage of SCI precursor
Enzymatic conversion of the SCI precursors to SCI (effected via cleavage of the EEAEAEAEPK decapeptide at the C terminus of lysine) was achieved by gently rocking (at 25 °C) a 2 mg/ml solution of SCI precursor in digestion buffer containing ACP-bound resin (see above). Preparative C8 rp-HPLC (C8 Kromasil 100 Å, 10-μm, 20 × 250 mm; Akzo Nobel, Amsterdam, Netherlands) isolated the target SCI. Final purification utilized a C18 column (C18 Proto 300 Å, 10-μm, 200 × 250 mm; Higgins Analytical Inc.); the mass of the eluted SCI was verified by MALDI-TOF MS (6517, 6503, and 6371 Da for SCI-a, SCI-b, and SCI-c, respectively). Purities were assessed using analytical C18 rp-HPLC (C18 Discovery BIOwide 300 Å, 5-μm, 4.6 × 250 mm; Supelco, Bellefonte, PA). Purities ≥98% were achieved.
Enzymatic semi-synthesis of insulin analogs
Two-chain insulin analogs were prepared by trypsin-catalyzed semi-synthesis (89) using variant des-octapeptide(B23–B30)-insulin (DOI) fragments containing AspB10 (with or without cystine A10–B4) as described (46). These fragments were generated by tryptic digestion of AspB10-MPI, DKP-MPI, or 4SS-DKP-MPI isolated from P. pastoris cultures followed by preparative C8 rp-HPLC purification as above. Final and in-process purities were assessed using C18 analytical rp-HPLC as above. Eluates were lyophilized. Following semi-synthetic linkage of variant DOI and octapeptide, the analogs were purified by C4 preparative rp-HPLC as above. The analog was lyophilized, and its mass was verified by MALDI-TOF MS.
Purification of control insulin analogs
WT insulin, insulin lispro, and insulin glargine were purified from respective products Humulin®, Humalog® (both from Lilly), and Lantus® (Sanofi-Aventis, Paris, France) by preparative C4 rp-HPLC as above. Eluted proteins were lyophilized and stored at −20 °C until use.
Formulation-compatible buffers
SCIs and control insulin analogs were dissolved at stated concentrations in either Lilly Diluent® (a product containing 3.8 mg/ml sodium phosphate (pH 7.4), 16 mg/ml glycerin, 1.6 mg/ml meta-cresol, 0.65 mg/ml phenol) or, in the case of insulin glargine, a solution similar to that in Lantus® as prepared in accordance with the product insert (2.7 mg/ml meta-cresol, 16 mg/ml glycerin, with pH adjusted to 4.0 with NaOH and HCl, but without inclusion of polysorbate 20). ZnCl2 was then added to a ratio of 3 Zn2+:1 insulin hexamer.
Isoelectric focusing
Isoelectric points (pI) of SCIs and WT insulin were measured by IEF gel electrophoresis using a 5–10-μg protein samples (79). Experimental pI values were calculated via a linear plot of migration distance versus pH gradient of the IEF standards (79). Estimates of pI predicted on the basis of protein sequence were generally lower than gel-derived values.
Studies of protein solubility and aggregation
Lyophilized proteins (3–5 mg) were dissolved in 1 ml of deionized water with pH adjustment to 7.4 with dilute NaOH. Protein content was measured by UV absorbance (Nanodrop 2000C spectrophotometer; Thermo Fisher Scientific, Waltham, MA). DLS samples were degassed and syringe-filtered (0.02-μm Whatman® Anotop® 10 filters; Sigma). Aliquots necessary to obtain respective 7, 5, 2, and 1 mm protein solutions in 30-μl final volumes were pipetted into separate Eppendorf tubes and lyophilized. The powder was then dissolved in “Tris diluent” (25 mm Tris-HCl (pH 7.4) containing 16 mg/ml glycerin, 1.6 mg/ml meta-cresol, 0.65 mg/ml phenol, and ZnCl2 at a ratio of 3 Zn2+ ions per insulin hexamer; Tris-HCl was substituted for sodium phosphate (as in Lilly Diluent®; see above) to avoid interaction between phosphate anions and zinc cations to form a precipitate). For DLS samples, all buffer components (i.e. deionized water, 4× Tris-HCl diluent (pH 7.4), and 10 mm ZnCl2) were degassed via nitrogen bubbling for 15 min and then syringe-filtered as above, followed by centrifugation (5 min at 16,100 × g). Gentle mixing of the filtered components with lyophilized protein was performed by repeated pipetting. Once mixed, samples were incubated at room temperature for 30 min before use.
Turbidimetry
Possible precipitation of insulin in the protein concentration range 1–7 mm in Tris Diluent (above) was assessed by 500 nm absorbance as described (78) using a Nanodrop 2000C (Thermo Fisher Scientific) with 2-μl samples per measurement.
HPLC-based assessment of solubility
Solubility was assessed by rp-HPLC as described (79). In brief, insulin analogs were made 1–7 mm in Tris Diluent (above). 2-μl aliquots were mixed with 98 μl of deionized water and analyzed by C4 analytical rp-HPLC (C4 Proto 300 Å, 5-μm, 250 × 4.6 mm; Higgins Analytical Inc.). The stock insulin solution was then centrifuged for 5 min at 16,100 × g (Centrifuge 5415D; Eppendorf) to remove any precipitates and another 2 μl was analyzed by C4 analytical rp-HPLC as above. The insulin peak in each chromatogram was integrated in the Empower HPLC software (Waters), and data were presented as the ratio of peak area of the non-centrifuged sample to that of the centrifuged sample, yielding percent recovery, which reflects the fraction of protein that is fully dissolved at stated concentrations (1–7 mm). Error presented in these measurements was obtained by replicate injection of 10 μg of Humalog® (0.6 mm insulin lispro at pH 7.4), which revealed ∼6–10% random error between injections. Injection of known quantities of insulin lispro in water (quantitated by UV absorbance) provided a control for losses unrelated to solubility; percent recoveries of insulin lispro were typically between 85 and 90%.
Size-exclusion chromatography
Self-assembly of WT insulin and SCIs (1–7 mm) was analyzed by SEC as described previously (90). Insulins in Tris-HCl diluent (10 μl injection) at stated concentrations were analyzed by SEC (Enrich SEC-70 10 × 300-mm column; fractionation range 0.5–70 kDa; Bio-Rad) using a 1 ml/min isocratic flow of mobile phase (10 mm Tris-HCl (pH 7.4), 145 mm NaCl, and 0.01% sodium azide). Molecular weights of eluted peaks were interpolated as described (90) from a linear regression analysis of the elution volumes, Ve, of known molecular weight standards. Briefly, thyroglobulin (669 kDa) was used to determine void volume, V0. The calibration curve (Fig. S5) used to determine the molecular mass of insulin samples was then obtained from a semi-log plot of the Ve/V0 versus the known molecular mass of the following gel filtration standards (Sigma): ovalbumin (45 kDa), carbonic anhydrase (29 kDa), myoglobin (17 kDa), cytochrome c (12.4 kDa), and aprotinin (6.5 kDa).
Dynamic light scattering
Protein-free Tris-HCl diluent or Tris-buffered insulin solution (pH 7.4) was placed in a low-volume Wyatt microcuvette (25-μl sample volume) and 90° scattering data collected for 30 min (10-s correlation averaging time) using a Wyatt miniDawn TREOs instrument equipped with a quasi-elastic light-scattering autocorrelator module with subsequent data analysis performed in ASTRA 6 (all from Wyatt Technology Corp., Santa Barbara, CA). Protein-free samples gave only shot noise, indicating that the mixing protocol does not introduce bubbles. Size distributions of insulin samples were obtained using the regularization (91) processing protocol in ASTRA 6. As more concentrated protein samples (e.g. WT insulin at 7 mm) had a high incidence of large aggregates resulting in spurious bursts in count rate that confound analysis, regularization analysis was applied only to regions of stable count rate; 5–10 correlation functions were averaged to obtain each distribution.
Receptor-binding assays
Affinities of insulin or insulin analogs to the A and B isoform of the insulin receptor and to the insulin-like growth factor 1 receptor (IGF-1R) were measured in a competitive-displacement assay as described (46). Data for homologous and heterologous receptor binding were analyzed as described previously (92).
Guanidine denaturation studies
Thermodynamic stabilities of all insulin peptides in KPi buffer (10 mm K2HPO4/KH2PO4 (pH 7.4) with 50 mm KCl) at 25 °C were determined by monitoring guanidine-induced unfolding at the helix-sensitive wavelength of 222 nm with a CD spectropolarimeter (Aviv Biomedical Inc., Lakewood, NJ) equipped with temperature control and an automated titration unit, as described previously (46). Using non-linear least-squares regression, plots of ellipticity versus guanidine concentration were fit to a two-state unfolding model (93) as shown in Equation 1,
| (Eq. 1) |
where ΔG is the Gibbs free energy of unfolding; c is guanidine concentration; R is the ideal gas law constant; T is absolute temperature, and ϴA and ϴB are baseline ellipticity values representing the folded and unfolded state. Baseline ellipticities were calculated via simultaneous fitting of linear equations ϴA(c) = ϴA + mAc and ϴB(c) = ϴB + mBc, as described previously (94).
Fibrillation assays
Insulin fibrillation was monitored in solutions containing 0.6 mm protein dissolved in Lilly® Diluent (pH 7.4) or, in the case of insulin glargine, a Lantus-like solution (see above), in each case with gentle rocking at 45 °C in the presence of an air–liquid interface. The solutions were incubated in sealed glass vials. Aliquots were taken at regular intervals and frozen to enable analysis of thioflavin T fluorescence at assay termination, which occurred on visual appearance of cloudiness (46).
NMR spectroscopy
Spectra were acquired at pH 7.4 in 10% D2O, 90% H2O with a Bruker AVANCE 700 MHz spectrometer equipped with a triple-resonance cryoprobe (Bruker Biospin Corp, Billerica, MA), as described (46). Data were processed using Bruker's TopSpin software.
X-ray crystallography
Lyophilized SCI-a was dissolved in 0.02 n HCl to a concentration of 10 mg/ml; crystallization trials employed sitting-drop vapor diffusion. The best diffracting crystals were obtained at 20 °C with a 1:1 volume ratio of SCI-a mixed with well solution containing 0.2 m MgCl2, 15% w/v polyethylene glycol (PEG) 8000, and 0.1 m Tris-HCl (pH 8.5). Single crystals were harvested with a nylon cryoloop and immersed in perfluoropolyether cryoprotectant oil (Hampton Research, Aliso Viejo, CA) to remove mother liquor before submerging in liquid nitrogen for storage.
Diffraction data were collected at SSRL BL7-1 from a single cryo-cooled crystal using a Quantum 315r CCD detector (Area Detector Systems Corp., Poway, CA). Data were processed with XDS (95), and the structure was solved by molecular replacement using PHASER (Table 2) (96). A search model was constructed using a monomer from a high-resolution crystal structure of WT insulin (PDB code 1GUJ (44)) with residues renumbered 1–57 in accordance with the nomenclature of SCI-c as studied previously by NMR (PDB code 2JZQ (29)). The 57 residues thus consist of a B domain (residues 1–30), C segment (residues 31–36), and A domain (residues 38–57). Side chains of non-conserved residues in the search model were computationally truncated to Ala. Molecular replacement calculations with this monomer (residues Gln4–Tyr26 and Gly37–Asn57) located six copies that form a hexamer in the asymmetric unit of the P21 unit cell to give a calculated Vm of 2.03 Å3/Da and solvent content of 39%. After rigid body and restrained refinement in Refmac (97), side chains of non-conserved residues as well as additional residues not present in the original search model were built into electron-density maps using Coot (98). Iterative cycles of model building were alternated with refinement calculations using Phenix (Table 2) (99). Composite refined omit maps were calculated to generate density with minimal search model bias. Refinement calculations were carried out with and without non-crystallographic symmetry restraints; release of the restraints resulted in a modest decrease of the refined R-factor (25.1 to 24.7%) but a significant increase in RFree (31.4–33.1%). The final model was refined with non-crystallographic symmetry restraints and against F > 0σF. In each monomer, between 7 and 9 residues in the linker (and adjoining BC and CA junctions) could not be located in density and were presumed to be flexible or disordered. The six monomers were labeled as chains A–F. Using this convention, the final model consisted of residues GlnA4–ThrA27 and GlyA37–AsnA57; GlnB4–ProB28 and GlyB37–AsnB57; HisC5–ThrC27 and GlyC37–AsnC57; GlnD4–ProD28 and ArgD36–AsnD57; GlnE4–ProE28 and ArgE36–AsnE57; HisF5–ThrF27 and GlyF37–AsnF57. In total, there was a lack of continuous, interpretable density for ∼20% of the expected amino acids, which were not built into the final model. These are located at the N termini (residues 1–4) and in the B and C domain segments B27–B30 and C1-C6 (together comprising residues 27–36) of each monomer and are presumed to be flexible or disordered. As these disordered residues represent a significant fraction of the total molecule that yields non-continuous electron density not accounted for in either the refinement model or the uniform density bulk solvent model, they may contribute to the slightly high RFree (31.4%) which nonetheless gives a reasonable RFree–R-factor difference of ∼7%.
Biological testing in diabetic rats
The insulin analogs were dissolved at concentrations specified in the legends to Figs. S1, S2, and S5 in either Lilly® Diluent or, in the case of insulin glargine, a Lantus-like acidic solution. The formulations each contained ZnCl2 at a ratio of 3 Zn2+:1 insulin hexamer. Insulin purity was verified by C4 analytical rp-HPLC as above. Protein-free Lilly® Diluent was used as a negative control (buffer only).
Groups of male Lewis rats (mean body mass ∼300 g) rendered diabetic by streptozotocin (100) were utilized. Rats were injected either SQ or i.v. at time t = 0 with the specified dose of insulin (100 μl/300 g of body mass). For i.v. injection, animals were placed in an induction chamber and anesthetized using 5% isoflurane in 100% oxygen. While under anesthesia, the tail of the rat was washed with lukewarm water and further cleaned with gauze containing alcohol and/or xylene. WT insulin or insulin analogs were injected at specified doses into the lateral tail vein.
Following SQ or i.v. injection, a small drop of blood was obtained from the clipped tip of the rats' tails at t = 0 and then every 10 min for the 1st h, every 20 min for the 2nd h, every 30 min during the 3rd h and then once per h for the remainder of the experiment. Measurements of [glucose] were made using a clinical glucometer (EasyMax® V Glucose Meter; Oak Tree Health, Las Vegas, NV). Because of day-to-day variation (even in the same rat on different days), 4–8 rats were injected per analog formulation on each test day, and the experiments were repeated on one or more non-consecutive days to obtain a larger sample size.
Thermal inactivation assays
Heating of SCIs and control analogs was performed in an oven at either 45 or 75 °C with gentle rocking. Protein solutions were incubated in sealed glass vials at a concentration of 0.6 mm (nominal U-100 strength in the case of WT insulin, insulin lispro, or insulin glargine) in either Lilly® Diluent or, in the case of insulin glargine, in an acidic solution similar to that in Lantus® (above). At stated time points in Fig. 5, samples were assessed for residual potency by diluting 10-fold (to a nominal strength of U-10; 0.06 mm) in their appropriate buffer (Lilly Diluent® (pH 7.4) or Lantus-like solution (pH 4.0)) before SQ injection at stated doses into diabetic rats (see above).
To obtain a quantitative assessment of residual insulin action, a custom MATLAB (MathWorks, Natick, MA) script was written to process rat glucose measurements in batch. AUCs were calculated for each individual data set using trapezoidal numerical integration. Two reporters of functional degradation were then determined: fractional AUC and percent activity. Fractional AUC was defined as the ratio of average AUC for a heat-stressed analog's dataset to the average AUC of the fresh (unstressed) analog. This value defined as fully active the fresh analogs, corresponding to a fractional AUC of 1.0, whereas partially or fully inactivated samples exhibited fractional AUCs >1.0. To further quantify the degree of thermal inactivation, percent activity was calculated: the average AUC of fresh or heated datasets was subtracted from the average AUC of diluent-only control injections to yield area over the curve (AOC). AOC for the heated dataset was divided by the AOC of the unheated sample, yielding a percentage. Fully active samples thus had the same AOC as the fresh sample (i.e. 100% active), whereas completely inactivated analogs had the same glucose-response curve as diluent-only (i.e. AOC = 0). Because of biological variability among rat responses, the heated insulin curves can have a lower AUC than that of the diluent-only curve, resulting in apparent negative values for percent activity; this corresponded to complete inactivation.
Signaling assays in mammalian cell culture
Signaling activities of the insulin analogs were tested in (a) L6 cells (rat myoblasts) engineered to overexpress human IR-A (49) and (b) MCF-7 human breast adenocarcinoma cells (which express IR-A, IR-B and high levels of IGF-1R (50)). L6-IRA cells were cultured in DMEM supplemented with 10% fetal bovine serum (FBS) and G418 antibiotic for selection. MCF-7 cells (American Type Culture Collection, Manassas, VA) were cultured in Eagle's minimum essential medium supplemented with 10% FBS, 1% penicillin/streptomycin, and sodium pyruvate (1 mm). 24-h serum-starving protocol using appropriate culture medium except FBS was applied at 70–75% cell confluence (∼0.8 × 10⁶ cells per well (L6-IRA) and 6 × 10⁶ per 10-cm dish (MCF-7)). After serum-starving, serum-free medium containing 100 nm insulin analogs was added to each well (control wells received medium with no added insulin). Media were removed after 15 min, followed by cell lysis using RIPA buffer with protease and phosphatase inhibitors (Cell Signaling Technology, Danvers, MA). Protein concentrations in cell lysates were determined with a Pierce BCA assay kit (Thermo Fisher Scientific) for use in immunoblotting. Cells cultured for rt-qPCR assays (see below) were, after 24 h of serum starvation, treated with either a protein-free medium or medium supplemented with an insulin analog (to a hormone concentration of 100 nm) medium for 8 h.
Real-time qPCR transcriptional assay
Mitogenic gene transcription was measured in triplicate by rt-qPCR with samples prepared according to the One-step rt-qPCR kit (Bio-Rad).
The following sets of primers (5′–3′) were used for L6-IRA cells: cyclin D1, GCCGAGTGGAAACTTTTGTCG and CGGGAAGCGTGTACTTATCCT; cyclin G2, GCAAGAAAAGAAGCCAAGCT and TGACCAAGAGGCAAAATAAAATCAA; glyceraldehyde-3-phosphate dehydrogenase (GAPDH), GACATGCCGCCTGGAGAA and GCCCAGGATGCCCTTTAGT; and TFIID, CTGAGGGGGCAATGTCTAAC and GGGCAGCTAGTGAGATGAGC.
For MCF-7 cell-based assays, the following primers (5′–3′) were used: cyclin D1, AATGACCCCGCACGATTTC and TCAGGTTCAGGCCTTGCAC; cyclin G2, ATCGTTTCAAGGCGCACAG and CAACCCCCCTCAGGTATCG; GAPDH, AGCCGAGCCACATCGCT and TGGCAACAATATCCACTTTACCAGAGT; and TFIID, GCACAGGAGCCAAGAGTGAA and TCACAGCTCCCCACCATGTT.
Insulin-stimulated protein phosphorylation
Samples contained 2–5 μg (for L6-IRA) or 25 μg (for MCF-7) of protein from cell lysate in each loading well (as quantitated by BCA assay). Cell lysates were dissolved in Laemmli buffer (Bio-Rad) with 10% β-mercaptoethanol, heated at 100 °C for 5 min (for all Akt/p-Akt blotting), 50 °C for 10 min (for L6-IRA IR/p-IR), or 100 °C for 8 min (for MCF-7 IR/p-IR) and then centrifuged at 9300 × g for 1 min (Biofuge A; Baxter Scientific, Soddy Daisy, TN). Samples were loaded into 10% Mini-PROTEAN TGX gels (Bio-Rad). Proteins were transferred to 0.2-μm PVDF membrane and then blocked in 5% bovine serum albumin (or 10% milk for p-Akt data) for 1 h. All antibodies were purchased from Cell Signaling Technology unless otherwise stated. Membranes were incubated overnight at 4 °C with insulin receptor β (4B8) rabbit monoclonal antibody (mAb) or an equal mixture of phospho-insulin receptor β (Tyr1150/1151) rabbit mAb; phospho-insulin receptor (Tyr1158) polyclonal antibody (Thermo Fisher Scientific); phospho-insulin receptor (Tyr1334) polyclonal antibody (Thermo Fisher Scientific); phospho-insulin receptor β (Tyr1345) rabbit mAb; and anti-insulin receptor (phospho-Tyr972) antibody (Abcam, Cambridge, UK). Dilutions for these antibodies were 1:5000 in 5% bovine serum albumin. Antibodies for Akt blotting were p-Akt1/2/3 antibody (Ser473) (1:1000) and Akt1/2/3 antibody (H-136) (1:2000). For MCF-7 samples, the following anti-Akt antibody dilutions in 10% milk were used: p-Akt1/2/3 antibody (Ser473) (1:1000) and Akt1/2/3 antibody (H-136) (1:2000). After the primary antibody incubation, membranes were washed with Tris-buffered saline with 0.1% Tween 20 and incubated in goat anti-rabbit HRP-conjugated secondary antibody diluted 1:10,000 in 5% bovine serum albumin (or 10% milk for p-Akt data) for 1–2 h at room temperature. All membranes were washed three times with 1× Tris-buffered saline, 0.1% Tween 20 and incubated in Luminata Crescendo Western HRP Substrate (Merck Millipore, Billerica, MA) for 45 s and developed.
Author contributions
Plasmids were designed and constructed by J. W. and M. P. Biochemical and biophysical assays were performed by M. D. G. and N. B. P. Rat studies were performed by K. C., M. P., N. R., M. S., and N. B. P. under the guidance of F. I.-B. with data analysis by M. D. G., K. C., and F. I.-B. Crystallization trials and structure determination were performed by K. A., Y. P., and V. C.Y .; analysis of the crystal structure was undertaken by M. D. G., V. C. Y., and M. A. W. with advice from M. C. L. NMR studies were performed by N. P. W., Y. Y., and M. A. W. Receptor-binding studies were performed by J. W. and N. R. Cell biological studies were performed by K. C. and Y.-S. C. The overall program of research was directed by M. A. W.
Supplementary Material
Acknowledgments
We thank Y. Liu, T. Hattier, L. Broadwater, and T. Cardon for assistance with and development of protocols for the expression and purification of recombinant SCIs; L. Whittaker for assistance with plasmid construction and receptor-binding studies in the early stages of this work; B. Smith and J. G. Menting for discussion; and C. T. Roberts, Jr., for advice regarding cell-based assays. We are also grateful to M. Muschol for advice on dynamic light scattering. L6 IR-A cells (developed by P. De Meyts) were provided by B. Forbes. Use of the Stanford Synchrotron Radiation Lightsource at the SLAC National Accelerator Laboratory is supported by the United States Department of Energy (DOE), Office of Science and Office of Basic Energy Sciences under Contract No. DE-AC02-76SF00515. The SSRL Structural Molecular Biology Program is supported by the DOE Office of Biological and Environmental Research and by the National Institutes of Health NIGMS Grant P41GM103393.
This work, a contribution of the Cleveland Center for Membrane and Structural Biology and CWRU Institute for the Science of Origins, was supported in part by National Institutes of Health Grants R01 DK040949 and R01 DK069764 (to M.A.W.), Australian National Health and Medical Research Council Project Grant APP1058233 (to M. C. L.), Victorian State Government Operational Infrastructure Support, and funding from the Australian NHMRC Independent Research Institutes Infrastructure Support Scheme, both to his institution. M.A.W. has equity in Thermalin Diabetes, LLC (Cleveland, OH), where he serves as Chief Innovation Officer; he has also been a consultant to Merck Research Laboratories and DEKA Research & Development Corp. N. B. P. and F. I.-B. are consultants to Thermalin Diabetes, LLC. Part of M.C.L.'s research is funded by Sanofi (Germany). The content is solely the responsibility of the authors and does not necessarily represent the official views of the National Institutes of Health.
This article contains Figs. S1–S5, Table S1–S3, and supporting Refs. 1–7.
The atomic coordinates and structure factors (code 5WDM) have been deposited in the Protein Data Bank (http://wwpdb.org/).
From “The Adventure of Silver Blaze,” a Sherlock Holmes short story from The Memoirs of Sherlock Holmes by Sir Arthur Conan Doyle first published in 1892.
Clinical use of SCIs was first motivated by viral gene therapy in a study since retracted by its authors (101).
Wild-type insulin pertains to the human sequence unless otherwise stated. Insulin residues are denoted by residue type (in standard three-letter code) followed by chain and position as a superscript (e.g. TyrB16 designates a tyrosine at the 16th position of the B chain). Insulin lispro is a clinical analog that exhibits rapid action due to interchange of residues B28 and B29. Activity of insulin formulations is standardized in International Units (IU); standard U-100 formulations contain 100 IUs per ml and correspond to a WT protein concentration of 0.6 mm. A U-1167 strength formulation would thus correspond to ∼7 mm WT insulin.
Our accompanying article (8) discusses the possible utility of SCI-b as a biphasic agonist with PD properties analogous to current premixed formulations.
- SCI
- single-chain insulin
- αCT
- C-terminal domain of IR
- μIR
- domain-minimized insulin micro-receptor
- Akt
- protein kinase B
- ER
- endoplasmic reticulum
- IEF
- isoelectric focusing
- IR
- insulin receptor
- L1
- first leucine-rich repeat domain of IR
- PD
- pharmacodynamics
- PDB
- Protein Data Bank
- r.m.s.d.
- root-mean-square deviation
- rp-HPLC
- reverse-phase high-performance liquid chromatography
- SQ
- subcutaneous
- T6
- insulin hexamer form wherein all protomers exist in a T state
- BisTris
- 2-[bis(2-hydroxyethyl)amino]-2-(hydroxymethyl)propane-1,3-diol
- rt-qPCR
- rt-quantitative PCR
- AOC
- area over the curve
- PK
- pharmacokinetic
- SEC
- size-exclusion chromatography
- DLS
- dynamic light scattering
- AUC
- area under the curve
- MPI
- mini-proinsulin.
References
- 1. Baker E. N., Blundell T. L., Cutfield J. F., Cutfield S. M., Dodson E. J., Dodson G. G., Hodgkin D. M., Hubbard R. E., Isaacs N. W., and Reynolds C. D. (1988) The structure of 2Zn pig insulin crystals at 1.5 Å resolution. Philos. Trans. R. Soc. Lond. B Biol. Sci. 319, 369–456 [DOI] [PubMed] [Google Scholar]
- 2. Zaykov A. N., Mayer J. P., and DiMarchi R. D. (2016) Pursuit of a perfect insulin. Nat. Rev. Drug Discov. 15, 425–439 10.1038/nrd.2015.36 [DOI] [PubMed] [Google Scholar]
- 3. Steiner D. F., Cunningham D., Spigelman L., and Aten B. (1967) Insulin biosynthesis: evidence for a precursor. Science 157, 697–700 10.1126/science.157.3789.697 [DOI] [PubMed] [Google Scholar]
- 4. Shabanpoor F., Separovic F., and Wade J. D. (2009) The human insulin superfamily of polypeptide hormones. Vitam. Horm. 80, 1–31 10.1016/S0083-6729(08)00601-8 [DOI] [PubMed] [Google Scholar]
- 5. Rinderknecht E., and Humbel R. E. (1978) The amino acid sequence of human insulin-like growth factor I and its structural homology with proinsulin. J. Biol. Chem. 253, 2769–2776 [PubMed] [Google Scholar]
- 6. De Meyts P., and Whittaker J. (2002) Structural biology of insulin and IGF1 receptors: implications for drug design. Nat. Rev. Drug Discov. 1, 769–783 10.1038/nrd917 [DOI] [PubMed] [Google Scholar]
- 7. Chan S. J., and Steiner D. F. (2000) Insulin through the ages: phylogeny of a growth promoting and metabolic regulatory hormone. Integr. Comp. Biol. 40, 213–222 [Google Scholar]
- 8. Glidden M. D., Yang Y., Smith N. A., Phillips N. B., Carr K., Wickramasinghe N. P., Ismail-Beigi F., Lawrence M. C., Smith B. J., and Weiss M. A. (2017) Solution structure of an ultra-stable single-chain insulin analog connects dynamics to a novel mechanism of receptor binding. J. Biol. Chem. 293, 69–88 10.1074/jbc.M117.808667 [DOI] [PMC free article] [PubMed] [Google Scholar]
- 9. Derewenda U., Derewenda Z., Dodson E. J., Dodson G. G., Reynolds C. D., Smith G. D., Sparks C., and Swenson D. (1989) Phenol stabilizes more helix in a new symmetrical zinc insulin hexamer. Nature 338, 594–596 10.1038/338594a0 [DOI] [PubMed] [Google Scholar]
- 10. Hua Q. X., Shoelson S. E., Kochoyan M., and Weiss M. A. (1991) Receptor binding redefined by a structural switch in a mutant human insulin. Nature 354, 238–241 10.1038/354238a0 [DOI] [PubMed] [Google Scholar]
- 11. Jacoby E., Hua Q. X., Stern A. S., Frank B. H., and Weiss M. A. (1996) Structure and dynamics of a protein assembly. 1H NMR studies of the 36 kDa R6 insulin hexamer. J. Mol. Biol. 258, 136–157 10.1006/jmbi.1996.0239 [DOI] [PubMed] [Google Scholar]
- 12. Olsen H. B., Ludvigsen S., and Kaarsholm N. C. (1996) Solution structure of an engineered insulin monomer at neutral pH. Biochemistry 35, 8836–8845 10.1021/bi960292+ [DOI] [PubMed] [Google Scholar]
- 13. Hua Q. X., Hu S. Q., Frank B. H., Jia W., Chu Y. C., Wang S. H., Burke G. T., Katsoyannis P. G., and Weiss M. A. (1996) Mapping the functional surface of insulin by design: structure and function of a novel A-chain analogue. J. Mol. Biol. 264, 390–403 10.1006/jmbi.1996.0648 [DOI] [PubMed] [Google Scholar]
- 14. Dodson G., and Steiner D. (1998) The role of assembly in insulin's biosynthesis. Curr. Opin. Struct. Biol. 8, 189–194 10.1016/S0959-440X(98)80037-7 [DOI] [PubMed] [Google Scholar]
- 15. Bode B. W. (2011) Comparison of pharmacokinetic properties, physicochemical stability, and pump compatibility of 3 rapid-acting insulin analogues-aspart, lispro, and glulisine. Endocr. Pract. 17, 271–280 10.4158/EP10260.RA [DOI] [PubMed] [Google Scholar]
- 16. Johnson I. S. (1983) Human insulin from recombinant DNA technology. Science 219, 632–637 10.1126/science.6337396 [DOI] [PubMed] [Google Scholar]
- 17. Menting J. G., Whittaker J., Margetts M. B., Whittaker L. J., Kong G. K., Smith B. J., Watson C. J., Žáková L., Kletvíková E., Jiráčěk, Chan J. S. J., Steiner D. F., Dodson G. G., Brzozowski A. M., Weiss M. A., et al. (2013) How insulin engages its primary binding site on the insulin receptor. Nature 493, 241–245 10.1038/nature11781 [DOI] [PMC free article] [PubMed] [Google Scholar]
- 18. Menting J. G., Yang Y., Chan S. J., Phillips N. B., Smith B. J., Whittaker J., Wickramasinghe N. P., Whittaker L., Pandyarajan V., Wan Z., Yadav S. P., Carroll J. M., Srokes N., Roberts C. T., Ismail-Beigi F., et al. (2014) Protective hinge in insulin opens to enable its receptor engagement. Proc. Natl. Acad. Sci. U.S.A. 111, 1–48 10.1073/iti0114111 [DOI] [PMC free article] [PubMed] [Google Scholar]
- 19. Derewenda U., Derewenda Z., Dodson E. J., Dodson G. G., Bing X., and Markussen J. (1991) X-ray analysis of the single chain B29-A1 peptide-linked insulin molecule. A completely inactive analogue. J. Mol. Biol. 220, 425–433 10.1016/0022-2836(91)90022-X [DOI] [PubMed] [Google Scholar]
- 20. Mirmira R. G., Nakagawa S. H., and Tager H. S. (1991) Importance of the character and configuration of residues B24, B25, and B26 in insulin-receptor interactions. J. Biol. Chem. 266, 1428–1436 [PubMed] [Google Scholar]
- 21. Wang Y., Liang Z. H., Zhang Y. S., Yao S. Y., Xu Y. G., Tang Y. H., Zhu S. Q., Cui D. F., and Feng Y. M. (2001) Human insulin from a precursor overexpressed in the methylotrophic yeast Pichia pastoris and a simple procedure for purifying the expression product. Biotechnol. Bioeng. 73, 74–79 10.1002/1097-0290(20010405)73:1%3C74::AID-BIT1038%3E3.0.CO%3B2-V [DOI] [PubMed] [Google Scholar]
- 22. Hua Q. X., Xu B., Huang K., Hu S. Q., Nakagawa S., Jia W., Wang S., Whittaker J., Katsoyannis P. G., and Weiss M. A. (2009) Enhancing the activity of insulin by stereospecific unfolding. Conformational life cycle of insulin and its evolutionary origins. J. Biol. Chem. 284, 14586–14596 10.1074/jbc.M900085200 [DOI] [PMC free article] [PubMed] [Google Scholar]
- 23. Cutfield J., Cutfield S., Dodson E., Dodson G., Hodgkin D., and Reynolds C. (1981) Evidence concerning insulin activity from the structure of a cross-linked derivative. Hoppe Seylers Z Physiol. Chem. 362, 755–761 10.1515/bchm2.1981.362.1.755 [DOI] [PubMed] [Google Scholar]
- 24. Nakagawa S. H., and Tager H. S. (1989) Perturbation of insulin-receptor interactions by intramolecular hormone cross-linking. Analysis of relative movement among residues A1, B1, and B29. J. Biol. Chem. 264, 272–279 [PubMed] [Google Scholar]
- 25. Markussen J., Jorgensen K. H., Sørensen A. R., and Thim L. (1985) Single chain des-(B30) insulin. Intramolecular crosslinking of insulin by trypsin catalyzed transpeptidation. Int. J. Pept. Protein Res. 26, 70–77 [PubMed] [Google Scholar]
- 26. Hua Q. X., Hu S. Q., Jia W., Chu Y. C., Burke G. T., Wang S. H., Wang R. Y., Katsoyannis P. G., and Weiss M. A. (1998) Mini-proinsulin and mini-IGF-I: homologous protein sequences encoding non-homologous structures. J. Mol. Biol. 277, 103–118 10.1006/jmbi.1997.1574 [DOI] [PubMed] [Google Scholar]
- 27. Kjeldsen T. (2000) Yeast secretory expression of insulin precursors. Appl. Microbiol. Biotechnol. 54, 277–286 10.1007/s002530000402 [DOI] [PubMed] [Google Scholar]
- 28. Kristensen C., Andersen A. S., Hach M., Wiberg F. C., Schaffer L., and Kjeldsen T. (1995) A single-chain insulin-like growth factor I/insulin hybrid binds with high affinity to the insulin receptor. Biochem. J. 305, 981–986 10.1042/bj3050981 [DOI] [PMC free article] [PubMed] [Google Scholar]
- 29. Hua Q. X., Nakagawa S. H., Jia W., Huang K., Phillips N. B., Hu S. Q., and Weiss M. A. (2008) Design of an active ultrastable single-chain insulin analog: synthesis, structure, and therapeutic implications. J. Biol. Chem. 283, 14703–14716 10.1074/jbc.M800313200 [DOI] [PMC free article] [PubMed] [Google Scholar]
- 30. Yang Y., Petkova A., Huang K., Xu B., Hua Q. X., Ye I. J., Chu Y. C., Hu S. Q., Phillips N. B., Whittaker J., Ismail-Beigi F., Mackin R. B., Katsoyannis P. G., Tycko R., and Weiss M. A. (2010) An Achilles' Heel in an amyloidogenic protein and its repair: insulin dynamics, misfolding, and therapeutic design. J. Biol. Chem. 285, 10806–10821 10.1074/jbc.M109.067850 [DOI] [PMC free article] [PubMed] [Google Scholar]
- 31. Brange J., Andersen L., Laursen E. D., Meyn G., and Rasmussen E. (1997) Toward understanding insulin fibrillation. J. Pharm. Sci. 86, 517–525 10.1021/js960297s [DOI] [PubMed] [Google Scholar]
- 32. Weiss M. A. (2013) Design of ultra-stable insulin analogues for the developing world. J. Health Spec. 1, 59–70 10.4103/1658-600X.114683 [DOI] [Google Scholar]
- 33. Vinther T. N., Norrman M., Ribel U., Huus K., Schlein M., Steensgaard D. B., Pedersen T. Å., Pettersson I., Ludvigsen S., Kjeldsen T., Jensen K. J., and Hubálek F. (2013) Insulin analog with additional disulfide bond has increased stability and preserved activity. Protein Sci. 22, 296–305 10.1002/pro.2211 [DOI] [PMC free article] [PubMed] [Google Scholar]
- 34. Svendsen A. M., Winge S. B., Zimmermann M., Lindvig A. B., Warzecha C. B., Sajid W., Horne M. C., and De Meyts P. (2014) Down-regulation of cyclin G2 by insulin, IGF-I (insulin-like growth factor 1) and X10 (AspB10 insulin): role in mitogenesis. Biochem. J. 457, 69–77 10.1042/BJ20130490 [DOI] [PubMed] [Google Scholar]
- 35. Stammberger I., Seipke G., and Bartels T. (2006) Insulin glulisine—a comprehensive preclinical evaluation. Int. J. Toxicol. 25, 25–33 10.1080/10915810500488379 [DOI] [PubMed] [Google Scholar]
- 36. Wan Z., Xu B., Huang K., Chu Y. C., Li B., Nakagawa S. H., Qu Y., Hu S. Q., Katsoyannis P. G., and Weiss M. A. (2004) Enhancing the activity of insulin at the receptor interface: crystal structure and photo-cross-linking of A8 analogues. Biochemistry 43, 16119–16133 10.1021/bi048223f [DOI] [PubMed] [Google Scholar]
- 37. Smith G. D., Pangborn W. A., and Blessing R. H. (2003) The structure of T6 human insulin at 1.0 Å resolution. Acta Crystallogr. D. Biol. Crystallogr. 59, 474–482 10.1107/S0907444902023685 [DOI] [PubMed] [Google Scholar]
- 38. DeFelippis M. R., Chance R. E., and Frank B. H. (2001) Insulin self-association and the relationship to pharmacokinetics and pharmacodynamics. Crit. Rev. Ther. Drug Carrier Syst. 18, 201–264 [PubMed] [Google Scholar]
- 39. Setter S. M., Corbett C. F., Campbell R. K., and White J. R. (2000) Insulin aspart: a new rapid-acting insulin analog. Ann. Pharmacother 34, 1423–1431 10.1345/1542-6270(2000)034%3C1373:IAANRA%3E2.0.CO%3B2,10.1345/aph.19414 [DOI] [PubMed] [Google Scholar]
- 40. Barlocco D. (2003) Insulin glulisine. Aventis Pharma. Curr. Opin. Investig. Drugs 4, 1240–1244 [PubMed] [Google Scholar]
- 41. Brange J., and Langkjaer L. (1997) Insulin formation and delivery. in Protein Delivery: Physical Systems (Sanders L. M., and Hendren R. W. eds.), pp. 343–410, Plenum Press, New York [Google Scholar]
- 42. Sciacca L., Le Moli R., and Vigneri R. (2012) Insulin analogs and cancer. Front. Endocrinol. 3, 21 [DOI] [PMC free article] [PubMed] [Google Scholar]
- 43. Ginter E., and Simko V. (2013) in Diabetes: An Old Disease, A New Insight (Ahmad S. I. ed.), pp 42–50, Springer, New York [Google Scholar]
- 44. Whittingham J. L., Scott D. J., Chance K., Wilson A., Finch J., Brange J., and Dodson G.G. (2002) Insulin at pH 2: structural analysis of the conditions promoting insulin fibre formation. J. Mol. Biol. 318, 479–490 10.1016/S0022-2836(02)00021-9 [DOI] [PubMed] [Google Scholar]
- 45. Brange J., and Langkjoer L. (1993) Insulin structure and stability. Pharm. Biotechnol. 5, 315–350 10.1007/978-1-4899-1236-7_11 [DOI] [PubMed] [Google Scholar]
- 46. Pandyarajan V., Phillips N. B., Cox G. P., Yang Y., Whittaker J., Ismail-Beigi F., and Weiss M. A. (2014) Biophysical optimization of a therapeutic protein by non-standard mutagenesis: studies of an iodo-insulin derivative. J. Biol. Chem. 289, 23367–23381 10.1074/jbc.M114.588277 [DOI] [PMC free article] [PubMed] [Google Scholar]
- 47. Brems D. N., Alter L. A., Beckage M. J., Chance R. E., DiMarchi R. D., Green L. K., Long H. B., Pekar A. H., Shields J. E., and Frank B. H. (1992) Altering the association properties of insulin by amino acid replacement. Protein Eng. 5, 527–533 10.1093/protein/5.6.527 [DOI] [PubMed] [Google Scholar]
- 48. Zhou C., Qi W., Lewis E. N., and Carpenter J. F. (2016) Characterization of sizes of aggregates of insulin analogs and the conformations of the constituent protein molecules: a concomitant dynamic light scattering and Raman spectroscopy study. J. Pharm. Sci. 105, 551–558 10.1016/j.xphs.2015.10.023 [DOI] [PubMed] [Google Scholar]
- 49. Knudsen L., Hansen B. F., Jensen P., Pedersen T. Å. Vestergaard K, Schäffer L., Blagoev B., Oleksiewicz M. B., Kiselyov V. V., and De Meyts P. (2012) Agonism and antagonism at the insulin receptor. PLoS ONE 7, e51972 10.1371/journal.pone.0051972 [DOI] [PMC free article] [PubMed] [Google Scholar]
- 50. Listov-Saabye N., Jensen M. B., Kiehr B., Hansen E. W., Svendsen J. E., Lundby A., Holm G. M., and Oleksiewicz M. B. (2009) MCF-7 human mammary adenocarcinoma cells exhibit augmented responses to human insulin on a collagen IV surface. J. Appl. Toxicol. 29, 470–477 10.1002/jat.1428 [DOI] [PubMed] [Google Scholar]
- 51. Pessin J. E., and Saltiel A. R. (2000) Signaling pathways in insulin action: molecular targets of insulin resistance. J. Clin. Invest. 106, 165–169 10.1172/JCI10582 [DOI] [PMC free article] [PubMed] [Google Scholar]
- 52. Steiner D. F. (1998) The proprotein convertases. Curr. Opin. Chem. Biol. 2, 31–39 10.1016/S1367-5931(98)80033-1 [DOI] [PubMed] [Google Scholar]
- 53. Steiner D. F. (1978) On the role of the proinsulin C-peptide. Diabetes 27 Suppl 1, 145–148 [DOI] [PubMed] [Google Scholar]
- 54. Kobayashi M., Sasaoka T., Sugibayashi M., Iwanishi M., and Shigeta Y. (1989) Receptor binding and biologic activity of biosynthetic human insulin and mini-proinsulin produced by recombinant gene technology. Diabetes Res. Clin. Pract. 7, 25–28 10.1016/0168-8227(89)90040-5 [DOI] [PubMed] [Google Scholar]
- 55. Galloway J. A., Hooper S. A., Spradlin C. T., Howey D. C., Frank B. H., Bowsher R. R., and Anderson J. H. (1992) Biosynthetic human proinsulin: review of chemistry, in vitro and in vivo receptor binding, animal and human pharmacology studies, and clinical trial experience. Diabetes Care 15, 666–692 10.2337/diacare.15.5.666 [DOI] [PubMed] [Google Scholar]
- 56. Niu C.-H., and Chiu Y.-Y. (1998) FDA perspective on peptide formulation and stability issues. J. Pharm. Sci. 87, 1331–1334 10.1021/js9800782 [DOI] [PubMed] [Google Scholar]
- 57. Waugh D. F. (1957) A mechanism for the formation of fibrils from protein molecules. J. Cell. Comp. Physiol. 49, 20 [DOI] [PubMed] [Google Scholar]
- 58. De Meyts P., Wallach B., Christoffersen C. T., Ursø B., Grønskov K., Latus L. J., Yakushiji F., Ilondo M. M., and Shymko R. M. (1994) The insulin-like growth factor-I receptor: structure, ligand binding mechanism and signal transduction. Horm. Res. 42, 152–169 10.1159/000184188 [DOI] [PubMed] [Google Scholar]
- 59. Chu Y. C., Zong L., Burke G. T., and Katsoyannis P. G. (1992) The A14 position of insulin tolerates considerable structural alterations with modest effects on the biological behavior of the hormone. J. Protein Chem. 11, 571–577 10.1007/BF01025035 [DOI] [PubMed] [Google Scholar]
- 60. Gallagher E. J., Alikhani N., Tobin-Hess A., Blank J., Buffin N. J., Zelenko Z., Tennagels N., Werner U., and LeRoith D. (2013) Insulin receptor phosphorylation by endogenous insulin or the insulin analog AspB10 promotes mammary tumor growth independent of the IGF-I receptor. Diabetes 62, 3553–3560 10.2337/db13-0249 [DOI] [PMC free article] [PubMed] [Google Scholar]
- 61. Poon K., and King A. B. (2010) Glargine and detemir: Safety and efficacy profiles of the long-acting basal insulin analogs. Drug Healthc. Patient Saf. 2, 213–223 [DOI] [PMC free article] [PubMed] [Google Scholar]
- 62. Phillips N. B., Whittaker J., Ismail-Beigi F., and Weiss M. A. (2012) Insulin fibrillation and protein design: topological resistance of single-chain analogs to thermal degradation with application to a pump reservoir. J. Diabetes Sci. Technol. 6, 277–288 10.1177/193229681200600210 [DOI] [PMC free article] [PubMed] [Google Scholar]
- 63. Zaykov A. N., Mayer J. P., Gelfanov V. M., and DiMarchi R. D. (2014) Chemical synthesis of insulin analogs through a novel precursor. ACS Chem. Biol. 9, 683–691 10.1021/cb400792s [DOI] [PubMed] [Google Scholar]
- 64. Bentley G. A., Brange J., Derewenda Z., Dodson E. J., Dodson G. G., Markussen J., Wilkinson A. J., Wollmer A., and Xiao B. (1992) Role of B13 Glu in insulin assembly. J. Mol. Biol. 228, 1163–1176 10.1016/0022-2836(92)90323-C [DOI] [PubMed] [Google Scholar]
- 65. Hill C. P., Dauter Z., Dodson E. J., Dodson G. G., and Dunn M. F. (1991) X-ray structure of an unusual Ca2+ site and the roles of Zn2+ and Ca2+ in the assembly, stability, and storage of the insulin hexamer. Biochemistry 30, 917–924 10.1021/bi00218a006 [DOI] [PubMed] [Google Scholar]
- 66. Huang X. F., and Arvan P. (1994) Formation of the insulin-containing secretory granule core occurs within immature β-granules. J. Biol. Chem. 269, 20838–20844 [PubMed] [Google Scholar]
- 67. Lemaire K., Ravier M. A., Schraenen A., Creemers J. W., Van de Plas R., Granvik M., Van Lommel L., Waelkens E., Chimienti F., Rutter G. A., Gilon P., in't Veld P. A., and Schuit F. C. (2009) Insulin crystallization depends on zinc transporter ZnT8 expression, but is not required for normal glucose homeostasis in mice. Proc. Natl. Acad. Sci. U.S.A. 106, 14872–14877 10.1073/pnas.0906587106 [DOI] [PMC free article] [PubMed] [Google Scholar]
- 68. Qin Y., Dittmer P. J., Park J. G., Jansen K. B., and Palmer A. E. (2011) Measuring steady-state and dynamic endoplasmic reticulum and Golgi Zn2+ with genetically encoded sensors. Proc. Natl. Acad. Sci. U.S.A. 108, 7351–7356 10.1073/pnas.1015686108 [DOI] [PMC free article] [PubMed] [Google Scholar]
- 69. Menting J. G., Lawrence C. F., Kong G. K. W., Margetts M. B., Ward C. W., and Lawrence M. C. (2015) Structural congruency of ligand binding to the insulin and insulin/type 1 insulin-like growth factor hybrid receptors. Structure 23, 1271–1282 10.1016/j.str.2015.04.016 [DOI] [PubMed] [Google Scholar]
- 70. Jimenez J. L., Nettleton E. J., Bouchard M., Robinson C. V., Dobson C. M., and Saibil H. R. (2002) The protofilament structure of insulin amyloid fibrils. Proc. Natl. Acad. Sci. U.S.A. 99, 9196–9201 10.1073/pnas.142459399 [DOI] [PMC free article] [PubMed] [Google Scholar]
- 71. Nielsen L., Khurana R., Coats A., Frokjaer S., Brange J., Vyas S., Uversky V. N., and Fink A. L. (2001) Effect of Environmental Factors on the Kinetics of Insulin Fibril Formation: Elucidation of the Molecular Mechanism. Biochemistry 40, 6036–6046 10.1021/bi002555c [DOI] [PubMed] [Google Scholar]
- 72. Hua Q. X., and Weiss M. A. (2004) Mechanism of insulin fibrillation: the structure of insulin under amyloidogenic conditions resembles a protein-folding intermediate. J. Biol. Chem. 279, 21449–21460 10.1074/jbc.M314141200 [DOI] [PubMed] [Google Scholar]
- 73. Huang K., Dong J., Phillips N. B., Carey P. R., and Weiss M. A. (2005) Proinsulin is refractory to protein fibrillation. Topological protection of a precursor protein from cross-β assembly. J. Biol. Chem. 280, 42345–42355 10.1074/jbc.M507110200 [DOI] [PubMed] [Google Scholar]
- 74. Brzozowski A. M., Dodson E. J., Dodson G. G., Murshudov G. N., Verma C., Turkenburg J. P., de Bree F. M., and Dauter Z. (2002) Structural origins of the functional divergence of human insulin-like growth factor-I and insulin. Biochemistry 41, 9389–9397 10.1021/bi020084j [DOI] [PubMed] [Google Scholar]
- 75. Brown J., Delaine C., Zaccheo O. J., Siebold C., Gilbert R. J., van Boxel G., Denley A., Wallace J. C., Hassan A. B., Forbes B. E., and Jones E. Y. (2008) Structure and functional analysis of the IGF-II/IGF2R interaction. EMBO J. 27, 265–276 10.1038/sj.emboj.7601938 [DOI] [PMC free article] [PubMed] [Google Scholar]
- 76. Whalen E. J., Rajagopal S., and Lefkowitz R. J. (2011) Therapeutic potential of β-arrestin- and G protein-biased agonists. Trends Mol. Med. 17, 126–139 10.1016/j.molmed.2010.11.004 [DOI] [PMC free article] [PubMed] [Google Scholar]
- 77. Frikke-Schmidt H., Pedersen T. A., Fledelius C., Olsen G. S., Bouman S. D., Fitch M., and Hellerstein M. (2014) Treatment of diabetic rats with insulin or a synthetic insulin receptor agonist peptide leads to divergent metabolic responses. Diabetes 64, 1057–1066 [DOI] [PubMed] [Google Scholar]
- 78. Landreh M., Alvelius G., Willander H., Stukenborg J.-B., Söder O., Johansson J., and Jörnvall H. (2012) Insulin solubility transitions by pH-dependent interactions with proinsulin C-peptide. FEBS J. 279, 4589–4597 10.1111/febs.12045 [DOI] [PubMed] [Google Scholar]
- 79. Phillips N. B., Wan Z. L., Whittaker L., Hu S. Q., Huang K., Hua Q. X., Whittaker Ismail-Beigi J. F., and Weiss M. A. (2010) Supramolecular protein engineering: design of zinc-stapled insulin hexamers as a long acting depot. J. Biol. Chem. 285, 11755–11759 10.1074/jbc.C110.105825 [DOI] [PMC free article] [PubMed] [Google Scholar]
- 80. Reutrakul S., Wroblewski K., and Brown R. L. (2012) Clinical use of U-500 regular insulin: review and meta-analysis. J. Diabetes Sci. Technol. 6, 412–420 10.1177/193229681200600229 [DOI] [PMC free article] [PubMed] [Google Scholar]
- 81. Eby E. L., Curtis B. H., Gelwicks S. C., Hood R. C., Idris I., Peters A. L., Bergenstal R. M., and Jackson J. A. (2015) Initiation of human regular U-500 insulin use is associated with improved glycemic control: a real-world US cohort study. BMJ Open Diabetes Res. Care 3:e000074, [DOI] [PMC free article] [PubMed] [Google Scholar]
- 82. Segal A. R., Vootla T., and Beaser R. S. (2016) Insulin: making sense of current options. Endocrinol. Metab. Clin. North Am. 45, 845–874 10.1016/j.ecl.2016.06.009 [DOI] [PubMed] [Google Scholar]
- 83. Kjeldsen G., Balschmidt P., Diers I., Hach M., Kaarsholm N. C., and Ludvigsen S. (2001) Expression of insulin in yeast: the importance of molecular adaptation for secretion and conversion. Biotechnol. Genet. Eng. Rev. 18, 89–121 10.1080/02648725.2001.10648010 [DOI] [PubMed] [Google Scholar]
- 84. Sambrook J., Fritsch E. F., and Maniatis T. (1989) Molecular cloning: a laboratory manual, Cold Spring Harbor Laboratory Press, Cold Spring Harbor, NY [Google Scholar]
- 85. Kjeldsen T., Pettersson A. F., and Hach M. (1999) Secretory expression and characterization of insulin in Pichia pastoris. Biotechnol. Appl. Biochem. 29, 79–86 [PubMed] [Google Scholar]
- 86. Sunga A. J., Tolstorukov I., and Cregg J. M. (2008) Posttransformational vector amplification in the yeast Pichia pastoris. FEMS Yeast Res. 8, 870 10.1111/j.1567-1364.2008.00410.x [DOI] [PubMed] [Google Scholar]
- 87. Mansur M., Cabello C., Hernandez L., Pais J., Varas L., Valdes J., Terrero Y., Hidalgo A., Plana L., Besada V., Garcia L., Lamazares E., Castellanos L., and Martinez E. (2005) Multiple gene copy number enhances insulin precursor secretion in the yeast Pichia pastoris. Biotechnol. Lett. 27, 339–345 10.1007/s10529-005-1007-7 [DOI] [PubMed] [Google Scholar]
- 88. Ohara T., Makino K., Shinagawa H., Nakata A., Norioka S., and Sakiyama F. (1989) Cloning, nucleotide sequence, and expression of Achromobacter protease I gene. J. Biol. Chem. 264, 20625–20631 [PubMed] [Google Scholar]
- 89. Inouye K., Watanabe K., Tochino Y., Kobayashi M., and Shigeta Y. (1981) Semisynthesis and properties of some insulin analogs. Biopolymers 20, 1845–1858 10.1002/bip.1981.360200909 [DOI] [PubMed] [Google Scholar]
- 90. Pandyarajan V., Phillips N. B., Rege N. K., Lawrence M. C., Whittaker J., and Weiss M. A. (2016) Contribution of TyrB26 to the function and stability of insulin: structure-activity relationships at a conserved hormone-receptor interface. J. Biol. Chem. 291, 12978–12990 10.1074/jbc.M115.708347 [DOI] [PMC free article] [PubMed] [Google Scholar]
- 91. Goldin A. A. (2002) Software for particle size distribution analysis in photon correlation spectroscopy. Alango, Ltd. [Google Scholar]
- 92. Wang Z. X. (1995) An exact mathematical expression for describing competitive binding of two different ligands to a protein molecule. FEBS Lett. 360, 111–114 10.1016/0014-5793(95)00062-E [DOI] [PubMed] [Google Scholar]
- 93. Sosnick T. R., Fang X., and Shelton V. M. (2000) Application of circular dichroism to study RNA folding transitions. Methods Enzymol. 317, 393–409 10.1016/S0076-6879(00)17026-0 [DOI] [PubMed] [Google Scholar]
- 94. Pace C. N., and Shaw K. L. (2000) Linear extrapolation method of analyzing solvent denaturation curves. Proteins: Struct., Funct., Bioinf. 41, 1–7 [DOI] [PubMed] [Google Scholar]
- 95. Kabsch W. (2010) Integration, scaling, space-group assignment and post-refinement. Acta Crystallogr. D Biol. Crystallogr. 66, 133–144 10.1107/S0907444909047374,10.1107/S0108767310004551 [DOI] [PMC free article] [PubMed] [Google Scholar]
- 96. McCoy A. J., Grosse-Kunstleve R. W., Adams P. D., Winn M. D., Storoni L. C., and Read R. J. (2007) Phaser crystallographic software. J. Appl. Crystallogr. 40, 658–674 10.1107/S0021889807021206 [DOI] [PMC free article] [PubMed] [Google Scholar]
- 97. Winn M. D., Ballard C. C., Cowtan K. D., Dodson E. J., Emsley P., Evans P. R., Keegan R. M., Krissinel E. B., Leslie A. G., McCoy A., McNicholas S. J., Murshudov G. N., Pannu N. S., Potterton E. A., Powell H. R., Read R. J., Vagin A., and Wilson K. S. (2011) Overview of the CCP4 suite and current developments. Acta Crystallogr. D Biol. Crystallogr. 67, 235–242 10.1107/S0907444910045749 [DOI] [PMC free article] [PubMed] [Google Scholar]
- 98. Emsley P., and Cowtan K. (2004) Coot: model-building tools for molecular graphics. Acta Crystallogr. D. Biol. Crystallogr. 60, 2126–2132 10.1107/S0907444904019158 [DOI] [PubMed] [Google Scholar]
- 99. Adams P. D., Afonine P. V., Bunkóczi G., Chen V. B., Davis I. W., Echols N., Headd J. J., Hung L.-W., Kapral G. J., Grosse-Kunstleve R. W., McCoy A. J., Moriarty N. W., Oeffner R., Read R. J., Richardson D. C., Richardson J. S., Terwilliger T. C., and Zwart P. H. (2010) PHENIX: a comprehensive Python-based system for macromolecular structure solution. Acta Crystallogr. D Biol. Crystallogr. 66, 213–221 10.1107/S0907444909052925 [DOI] [PMC free article] [PubMed] [Google Scholar]
- 100. Saker F., Ybarra J., Leahy P., Hanson R. W., Kalhan S. C., and Ismail-Beigi F. (1998) Glycemia-lowering effect of cobalt chloride in the diabetic rat: role of decreased gluconeogenesis. Am. J. Physiol. 274, E984–E991 [DOI] [PubMed] [Google Scholar]
- 101. Cyranoski D. (2009) Retracted paper rattles Korean science. Nature; London 458, 561 10.1038/458561b,10.1038/458561a [DOI] [PubMed] [Google Scholar]
- 102. Poon R. Y. C. (2015) Cell Cycle Control. Reference Module in Biomedical Sciences, Elsevier, New York [Google Scholar]
- 103. Pakula A. A., and Sauer R. T. (1990) Reverse hydrophobic effects relieved by amino-acid substitutions at a protein surface. Nature 344, 363–364 10.1038/344363a0 [DOI] [PubMed] [Google Scholar]
Associated Data
This section collects any data citations, data availability statements, or supplementary materials included in this article.