

Abstract
Cytochrome P450cam (CYP101Fe3+) regioselectively hydroxylates camphor. Possible hydroxylating intermediates in the catalytic cycle of this well-characterized enzyme have been proposed on the basis of experiments carried out at very low temperatures and shunt reactions, but their presence has not yet been validated at temperatures above 0 °C during a normal catalytic cycle. Here, we demonstrate that it is possible to mimic the natural catalytic cycle of CYP101Fe3+ by using pulse radiolysis to rapidly supply the second electron of the catalytic cycle to camphor-bound CYP101[FeO2]2+. Judging by the appearance of an absorbance maximum at 440 nm, we conclude that CYP101[FeOOH]2+ (compound 0) accumulates within 5 μs and decays rapidly to CYP101Fe3+, with a k440 nm of 9.6 × 10⁴ s−1. All processes are complete within 40 μs at 4 °C. Importantly, no transient absorbance bands could be assigned to CYP101[FeO2+por•+] (compound 1) or CYP101[FeO2+] (compound 2). However, indirect evidence for the involvement of compound 1 was obtained from the kinetics of formation and decay of a tyrosyl radical. 5-Hydroxycamphor was formed quantitatively, and the catalytic activity of the enzyme was not impaired by exposure to radiation during the pulse radiolysis experiment. The rapid decay of compound 0 enabled calculation of the limits for the Gibbs activation energies for the conversions of compound 0 → compound 1 → compound 2 → CYP101Fe3+, yielding a ΔG‡ of 45, 39, and 39 kJ/mol, respectively. At 37 °C, the steps from compound 0 to the iron(III) state would take only 4 μs. Our kinetics studies at 4 °C complement the canonical mechanism by adding the dimension of time.
Keywords: cytochrome P450, electron transfer, isotope effect, kinetics, oxidation-reduction (redox)
Introduction
Cytochrome P450 (CYP)5 enzymes are mono-oxygenases that contain heme as a prosthetic group. These enzymes catalyze a wide variety of oxidation reactions, including stereo- and regioselective hydroxylation of non-activated C-H bonds (1). Oxidation of C–H bonds by CYP enzymes with molecular dioxygen, per turnover, requires two electrons that originate from NADH or NADPH (reaction 1) that are transferred sequentially to cytochrome P450, in the case of CYP101 by putidaredoxin (2).
The electrode potential of this half-reaction is estimated to be +1.5 V at pH 7 (3).
Convincing, detailed structural evidence for the existence of intermediates (Fe3+, Fe3+-camphor, Fe2+, and [FeO2]2+) in the reaction cycle (Fig. 1) up to and including the Fe2+-dioxygen complex has been presented (4–6). The addition of a second electron and a proton leads to the formation of “compound 0” (Cpd 0, [FeOOH]2+)6, which has been observed after cryoreduction of [FeO2]2+ (7). Subsequent formation of “compound 1” (8) (Cpd 1, [FeO2+por•+]) and “compound 2” (Cpd 2, [FeO]2+) has been invoked, but these intermediates have never been unequivocally observed during reactions that involve Cpd 0. Intermediates that have been ascribed to Cpd 1 (9–11) and that are capable of hydroxylation (12) have been produced by exposure of cytochromes P450 to peroxyacids in reactions that bypass Cpd 0. More recently, rapid mixing of H2O2 with iron(III) cytochrome P450 allowed direct observation of Cpd 0, but Cpds 1 and 2 were not detected (13). However, an unusual cytochrome P450 (OleT) that decarboxylates fatty acids does form Cpd 0 by H2O2 addition, with compounds 1 and 2 both characterized in subsequent steps (14).
Figure 1.
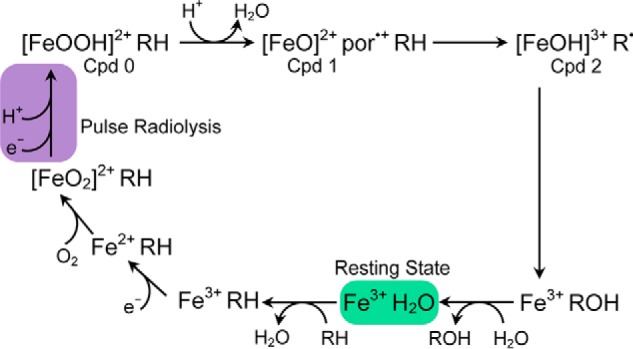
The cytochrome P450 catalytic cycle with the reduction step driven by pulse radiolysis highlighted in purple.
For the best characterized cytochrome P450 isozyme, CYP101, it has been shown that the supply of electrons from putidaredoxin to cytochrome P450 is rate-limiting (15). Hence, it is not possible to observe with standard spectroscopic methods reactive intermediates that occur after the formation of the [FeO2]2+ intermediate. However, the hydrated electron (eaq−), which can be generated by the pulse radiolysis technique, reduces proteins at diffusion-controlled rates on the microsecond time scale. Under pseudo–first order conditions, with CYP101 in excess, CYP101Fe3+ reacts with eaq− with a rate constant of 3 × 10¹⁰ m−1 s−1; the yield of reduced heme is ∼10% relative to eaq− (16, 17). Kobayashi et al. (18) used pulse radiolysis to add an electron to the oxy-form of 2,4-diacetyldeutero-cytochrome P450cam, and the difference absorption spectrum observed was assigned to Cpd 2; however, these authors were unable to analyze formation of hydroxylated camphor; thus, no conclusions could be drawn about the catalytic competence of Cpd 2.
We set out to study the kinetics of the reaction of eaq− with the Fe3+ and [FeO2]2+ forms of camphor-hydroxylating cytochrome P450, CYP101, by UV-visible spectroscopy, with the expectation to observe reactions 2 and 3.
We studied reaction 3 at 4 °C in the presence of camphor and observed spectral changes that correspond to formation of Cpd 0. During the experiments, large concentrations of O2˙̄ and, thus of H2O2 and O2, were produced. CYP101Fe3+ does not react with O2˙̄ (16) and reacts only slowly, on the second time scale, with H2O2. Because the absorbance changes we observed continued only up to 1 ms, reactions with H2O2 can be ignored. Compared with the cryoirradiations of cytochromes P450 described by Davydov et al. (7), the radiation dose from the pulse radiolysis technique is much lower, which mitigates the risk of damage to the protein. Detection of 5-hydroxycamphor as the primary product from Cpd 0 provides evidence that this intermediate is a relevant oxidant in the CYP101 catalytic cycle. We show that the pulse radiolysis technique can be used to “jump-start” the catalytic cycle of cytochrome P450 by providing the second electron to reduce the oxy-form of the enzyme. Although we find no spectral evidence for accumulation of Cpd 1, our evidence indicates that it must be formed.
Results
Half-life of the hydrated electron
The half-life, t½, of eaq− decay, measured after irradiation (100 Gy) of a corresponding N2-saturated 10 mm potassium phosphate buffer at pH 7.4 in the presence of 10 μm camphor but without CYP101, is 0.65 μs (Fig. 2A).
Figure 2.

Reduction of CYP101Fe3+ by eaq− at 4. 0 °C under anaerobic conditions. A, the decay of eaq− at 700 nm in 10 mm potassium phosphate buffer, but without CYP101Fe3+, at pH 7.4, with 2 mm t-BuOH and 10 μm camphor irradiated with a dose of 100 Gy, which corresponds to [eaq−] = 27 μm, at 4 °C; the t½ of eaq− is 0.65 μs, with k = 1.1 × 10⁶ s−1. B, difference spectra constructed from time-resolved absorbance readings normalized to an applied dose of 80 Gy ([eaq−] = 22 μm) at 5 (black square), 7 (red circle), 50 (green triangle), and 200 (inverted blue triangle) μs; difference spectrum of CYP101Fe2+–CYP101Fe3+, calculated from typical UV-visible recordings (black line). C, the reduction of 2 μm CYP101Fe3+ (80 Gy) measured at 390 nm (red line); fit: kobs_reduction = 5.4 × 10⁴ s−1 (black line). The direct reaction of eaq− with the heme has a t½ shorter than 0.65 μs, which is the lifetime in the absence of the protein. Therefore reaction 2 is completed within 3 μs or 5 half-lives. The absorbance change between 0 and 3 μs, 40 mAbs, was used to calculate the rate constant of reaction 2. Reduction of the heme after 3 μs is caused by highly reducing species generated by the reaction of H• and eaq− with the amino acids of the protein. In the absence of O2, this process contributes to roughly half of the total yield of reduction.
Reduction of CYP101Fe3+ by hydrated electrons
The rate constant for the reaction of the eaq− with the heme of CYP101Fe3+ was determined by competition kinetics, i.e. via the yield of this reaction. The yield of reduction was determined by irradiating a N2-saturated solution of 2.0 μm CYP101Fe3+ containing 2 mm t-BuOH at a dose of 80 Gy, which results in the formation of 22 μm eaq−. The observed difference absorbance spectrum (Fig. 2B) is consistent with conversion of CYP101Fe3+to CYP101Fe2+. The absorbance at 390 nm, which was used to follow the reduction of CYP101Fe3+ (Fig. 2C), decreased by a total of ∼65 mAbs in 50 μs. However, over the course of 5 half-lives of eaq− decay (∼3 μs), the corresponding loss of absorbance at 390 nm was ∼40 mAbs, which, given the extinction coefficients of the oxidized and reduced proteins at that wavelength (2) and the 6-cm path length, corresponds to a concentration of CYP101Fe2+ of 0.18 μm. This first phase of absorbance change reflects reduction of ∼9% of the heme iron(III) relative to protein and a yield of reduction of the heme relative to eaq− of 0.8%. The same result was found when traces recorded at 410, 415, 420, and 425 nm were analyzed. The second stage of heme reduction, the loss of the remaining 25 mAbs at 390 nm, occurred after essentially all of the eaq− decayed, proceeding for ∼50 μs, with kobs_reduction = 5.4 × 10⁴ s−1 (Fig. 2C). This stage of heme reduction is likely caused by adducts of eaq− and H• with amino acids (21, 22) formed during the first 3 μs, with reducing equivalents then transferred to the heme by a tunneling or hopping mechanism.
Rate constant for the formation of CYP101[FeO2]2+
To validate pulse radiolysis as the method of choice to provide reducing equivalents, we followed the formation of CYP101[FeO2]2+, as shown in the following reaction,
by reducing CYP101Fe3+ with eaq− in the presence of excess O2. The rate constant measured, k4 = 2.1 × 10⁵ m−1 s−1 (Fig. S1a), agrees with that determined by stopped flow, 2.4 × 10⁵ m−1 s−1 (Fig. S1b), and is the same order of magnitude as the literature value, 7.7 × 10⁵ m−1 s−1 (19). Moreover, these experiments demonstrate that, at 4 °C, CYP101[FeO22+] does not autoxidize significantly for at least 1 min (Fig. S1c).
The reaction of hydrated electrons with CYP101[FeO2]2+
To observe intermediates of the catalytic cycle, we formed substrate-bound CYP101[FeO2]2+ at 4 °C in the irradiation cell by mixing an anaerobic solution of CYP101Fe2+, produced by reducing CYP101Fe3+ in the presence of camphor with a slight excess of S2O42− inside a N2-filled glove box, with a buffered solution containing O2. The CYP101[FeO2]2+ formed can autoxidize; thus, the mixture was irradiated as soon as possible, generally within 30 s. Two distinct absorption bands with maxima at 410 and 440 nm were detected upon exposure to eaq− decay at different rates (Fig. 3A), which indicates that two processes take place simultaneously. Both appear within 5 μs, i.e. “instantaneously.” The absorbance at 440 nm decays by a first-order reaction, k440 nm = 9.6 × 10⁴ s−1 (Fig. 3B), whereas that at 410 nm decays by two consecutive processes with rate constants k410 nm-I = 4.2 × 10⁴ s−1 and k410 nm-II = 2.5 × 10³ s−1 (Fig. 3C). All processes are complete within <1 ms. All rate data have been collected in Table 1.
Figure 3.

Reaction of eaq− with CYP101[FeO2]2+ at 4.0 °C. 6 μm CYP101Fe2+ with 12 μm camphor was mixed 1:1 with 100 μm O2, 10 μm camphor, and 2 mm t-BuOH in 10 mm potassium phosphate buffer, at pH 7.4, from gas-tight syringes and irradiated at 80 Gy, [eaq−] = 22 μm) within 30 s after mixing. A, difference spectra for CYP101Fe3+–CYP101[FeO2]2+ at 5 (red circle), 7 (blue triangle), 20 (inverted purple triangle), 50 (green diamond), and 100 (left-facing dark blue triangle) μs, and a difference spectrum of CYP101Fe3+–CYP101[FeO2]2+ calculated from typical UV-visible recordings (gray line). B, the decay of the 440-nm absorbance (red line), fit to a rate constant of k440 nm = 9.4 × 10⁴ s−1 (black line), and the residual (green line). C, the decay of the 410 nm absorbance (red line), fit to two rate constants: k410 nm-I = 4.2 × 10⁴ s−1 and k410 nm-II = 2.5 × 10³ s−1 (black line), and the residual (green line). D, UV-visible spectra of CYP101Fe3+ (blue line) and CYP101Fe2+ (red line) taken before and the spectrum of CYP101Fe3+ (dotted bright green line) taken after pulse radiolysis (PR). Note that the blue and green lines are superimposable.
Table 1.
Summary of kinetics data
| Rate constant, k | Value | Corresponding process |
|---|---|---|
| kobs_reduction | 5.4 × 10⁴ s−1 | Reduction of the heme by eaq−, likely caused by adducts of eaq− and H• with amino acids formed during the first 3 μs (Fig. 2C) |
| k440 nm | 9.6 × 10⁴ s−1 | Decay at 440 nm, presumably of Cpd 0 after reaction of eaq− with CYP101[FeO2]2+ (Fig. 3B) |
| k410 nm-I | 4.2 × 10⁴ s−1 | First phase of the decay at 410 nm after reaction of eaq− with CYP101[FeO2]2+ (Fig. 3C) |
| k410 nm-II | 2.5 × 10³ s−1 | Second phase of the decay at 410 nm after reaction of eaq− with CYP101[FeO2]2+ (Fig. 3C) |
| k440 nm (D2O) | 3.9 × 10⁴ s−1 | Decay at 440 nm of Cpd 0 after reaction of eaq− with CYP101[FeO2]2+ in D2O (Fig. S4a) |
| k410 nm-I (D2O) | 4.0 × 10⁴ s−1 | First phase of the decay at 410 nm after reaction of eaq− with CYP101[FeO2]2+ in D2O (Fig. S4b) |
| k410 nm-II (D2O) | 2.3 × 10³ s−1 | Second phase of the decay at 410 nm after reaction of eaq− with CYP101[FeO2]2+ in D2O (Fig. S4b) |
| kcontrol | 1.0 × 10⁶ s−1 | Disappearance of eaq− in the absence of protein (Fig. 2A) |
| k3 ( = k2) | (3.8 ± 0.7) × 109 m−1 s−1 | The reaction of CYP101Fe3+ with eaq−, k derived from [CYP101Fe2+]/[eaq−]; the yield of reduction of the heme relative to eaq− is 0.8% (Eq. 5) |
| k4 | 2.1 × 10⁵ m−1 s−1 | Formation of CYP101[FeO2]2+ measured by pulse-radiolysis (reaction 4, Fig. S1a) |
| 2.4 × 10⁵ m−1 s−1 | Formation of CYP101[FeO2]2+ measured by stopped-flow (reaction 4, Fig. S1b) | |
| kobs_activity before PR | (3.8 ± 0.2) × 102 min−1 | NADH oxidation before and after pulse radiolysis (Fig. S3) |
| kobs_activity after PR | (3.7 ± 0.3) × 102 min−1 |
Importantly, no transient absorbance bands that could correspond to Cpd 1 are detected, and the spectrum recorded after irradiation indicates that all iron has returned to the Fe3+ state (Fig. 3D), which leads us to conclude that the heme did not suffer radiation damage. We also determined that the rate of NADH oxidation, which has been shown to reflect the rate of substrate hydroxylation by CYP101 (20), was similar before and after irradiation; the observed rate constant of kobs_activity after PR =(3.7 ± 0.3) × 102 min−1 demonstrates that the enzyme activity is not significantly impaired by radiolysis (Fig. S3).
Analysis of kinetics experiments carried out in D2O followed at 440 nm give a result for k440 nm (D2O) = 3.9 × 10⁴ s−1 (Fig. S4a). The difference relative to the rate constant for the reaction in water (Fig. 3B) amounts to a kinetic isotope effect of ∼2, In contrast, the kinetics at 410 nm are not affected (Fig. S4b).
Product analysis after pulse radiolysis
To confirm that the transient species observed occur along the pathway of camphor hydroxylation, two samples of ∼1 ml each were collected for product analysis. These samples, containing 50 μm of the oxy-enzyme, had each been exposed to a dose of 200 Gy. The substrate and products were extracted with chloroform and analyzed by GC-MS. The GC-MS elution profile shown in Fig. 4A shows, in addition to the peak corresponding to the camphor substrate at 4.9 min, two additional peaks with elution times of 5.9 and 6.9 min. The peak at 6.9 min corresponds to 5-hydroxycamphor (167 Da) with m/z = 168 (after single protonation by electrospray ionization; Fig. 4B), as follows from a comparison with the mass spectrum of authentic 5-hydroxycamphor (Fig. 4C). The yields, quantified by GC with flame ionization detection (FID), were, from two separate experiments, 2.7 and 3.7 μm. The elution profile for m/z = 166 with the peak at 5.9 min shown in Fig. 4D, together with the mass spectrum (Fig. 4E), indicates that a small amount (∼0.9 ± 0.3 μm, quantified by GC-FID) of 5-ketocamphor, a secondary oxidation product, was also formed. No oxidation products of camphor were observed in control experiments performed without CYP101 present or in the presence of lysozyme, a non-heme protein, in place of CYP101.
Figure 4.

Analysis of products formed from reaction of eaq− with CYP101[FeO2]2+. 50 μm CYP101[FeO2]2+ in the presence of camphor was irradiated with a dose of 200 Gy ([eaq−] = 54 μm); reaction mixtures were extracted with CH3Cl:decane (1:1 v/v), concentrated by evaporation under a stream of N2, and analyzed by GC-MS. A, total ion count chromatogram showing elution of substrate camphor (4.9 min) and products 5-hydroxycamphor (6.9 min) and 5-ketocamphor (5.9 min). B, elution profile at m/z = 168 (green line) corresponding to 5-hydroxycamphor. C, MS of 5-hydroxycamphor. D, elution profile at m/z = 166 corresponding to 5-ketocamphor (blue line). E, MS of 5-ketocamphor.
Simulation of pulse radiolysis reaction conditions and theoretical product yield
The theoretical yield of 5-hydroxycamphor was calculated with a chemical kinetics simulator (IBM Research) program by simulating the reactions shown in Table S1. To provide a value for k3 for use in this simulation, we assume it to be equal to k2, which we calculate according to Equation 1,
| (Eq. 1) |
where kcontrol = 1.0 × 10⁶ s−1 is the rate at which eaq− disappears in the absence of protein (Fig. 2A). We found the yield of reduction (reaction 2), i.e. of the heme relative to eaq− ([CYP101Fe2+]/[eaq−]), to be 0.8%, from which a value of k3 (= k2) of (3.8 ± 0.7) × 109 m−1 s−1 is derived. This finding is consistent with literature reports of a rate constant for the overall reaction of CYP 101Fe3+ with eaq− of 3 × 10¹⁰ m−1 s−1 and that ∼9% of the eaq− reaches the heme (16, 17). The concentration of O2 available to CYP101Fe2+ was determined by a kinetics simulation (Fig. S2), which shows that the original concentration of 50 μm O2 decreases by 18 μm in 1 μs.
From a simulation of substrate oxidation by the primary oxidant generated via reduction of the heme of 50 μm CYP101[FeO2]2+ at 200 Gy, we estimate the product yield to be 3.1 ± 0.6 μm (Fig. S5). We found experimental yields of 2.7 and 3.7 μm hydroxycamphor product, from which we conclude that the reaction is, within the error, quantitative. Because there is no indication that pulse radiolysis impairs enzyme function or its spectral properties, we assume that reaction of eaq− with the protein causes no damage to the protein, which allows us to ignore protein damaging reactions in the simulations.
In addition to 5-hydroxycamphor, formation of a further oxidation product, 5-ketocamphor, was observed. To test the hypothesis that the alcohol is converted to the ketone by reaction with H2O2 in the presence of Fe3+, we incubated 5-hydroxycamphor with CYP101Fe3+ in the presence of H2O2 at concentrations of up to 1 mm, a concentration more than 1 order of magnitude higher than can be achieved by the radiation dose used, and found no evidence for the formation of 5-ketocamphor, even after overnight incubation. Hydrogen peroxide clearly does not interfere with our measurements. Formation of 5-ketocamphor was observed only with H2O2 present at concentrations of ≥2 mm (Fig. S6a). To test the hypothesis that 5-hydroxycamphor remaining in the active site could be oxidized during a second reaction cycle, we irradiated a solution of 50 μm CYP101Fe3+ with 100 μm of 5-hydroxycamphor as substrate in the presence of 50 μm O2; analysis of a sample by GC-MS shows formation of 0.7 μm 5-ketocamphor (Fig. S6c). As a negative control, a solution of 75 μm of CYP101Fe2+ was irradiated in the presence of 100 μm O2 without substrate present, after which the sample was mixed with a solution of 100 μm 5-hydroxycamphor before analysis by GC-MS. Surprisingly, formation of 0.7 μm 5-ketocamphor was found as well in this negative control (Fig. S6b).
Discussion
Our main findings are that the pulse radiolysis technique can be used to jump-start the catalytic cycle of cytochrome P450, providing the electrons to reduce the enzyme, and that Cpd 0 so formed is converted to Cpd 1 very rapidly. The latter reacts either with bound substrate or with a protein moiety even faster, such that Cpd 1 does not accumulate. Additionally, we demonstrate that reduction of CYP101 by pulse radiolysis is productive, i.e. that 5-hydroxycamphor is formed.
Validation of the pulse radiolysis technique
We demonstrate that it is possible to use the pulse radiolysis technique, which allows electrons to be added to the heme one at a time and permits reactions that occur within a few microseconds to be followed spectroscopically, to probe the natural catalytic cycle of CYP101. Pulse radiolysis is an inherently quantitative technique in which the dose is used to calculate [eaq−], and the yields of all reaction products can be estimated relative to [eaq−].
Although reactions after formation of Cpd 0 are too rapid to be accessible by stopped-flow methods, the third reaction in the CYP101cycle—formation of CYP101[FeO2]2+ from CYP101Fe2+and O2, Fig. 1—is considerably slower. We could analyze this relatively slow reaction by both the stopped-flow and pulse radiolysis techniques to confirm that pulse radiolysis is suitable for analysis of the more rapid reactions in the cycle. The rate constant measured by pulse radiolysis, k4 = 2.1 × 10⁵ m−1 s−1, is essentially identical to that measured by stopped flow, 2.4 × 10⁵ m−1 s−1, and is in agreement with the literature (19).
Intermediates in the CYP101 reaction cycle identified by one-electron reduction steps
The one-electron reduction of CYP101[FeO2]2+ initially gives rise to an absorbance spectrum that closely resembles that published for Cpd 0. There are minor differences at higher wavelengths that may originate from the 100-fold higher dose of radiation used by Denisov et al. (23). We assign the maximum at 440 nm (Fig. 3A) to Cpd 0. The decay kinetics at 440 nm are monophasic, with k440 nm = 9.6 × 10⁴ s−1 (Fig. 3B). The initially increased absorbance observed at 410-nm decays in a biphasic first-order fashion, but with different rate constants, k410 nm-I = 4.2 × 10⁴ s−1 and k410 nm-II = 2.5 × 10³ s−1 (Fig. 3C). Given that the absorbance bands at both 410 and 440 nm are present within μs after the pulse, we conclude that the absorbance decays at these wavelengths reflect not serial, but parallel processes. The transient absorbance at 410 nm may indicate the presence of a tyrosyl radical (TyrO•), which is unlikely to result from reaction with O2˙̄, present in high concentrations directly after the pulse, because this radical does not react with amino acids (24). Instead, the absorbance at 410 nm is probably due to camphor-free CYP101, which has been shown to form Cpd ES upon reaction with a peracid (25, 26). Cpd ES, first reported by Schünemann et al. (27), contains an oxidoiron(IV) and TyrO•, with an absorbance maximum at 406 nm. Using the Kd for camphor of 1.46 μm at 4 °C (28), we calculate that more than 85% of 3 μm CYP101[Fe]3+ binds to camphor under the experimental conditions. Therefore, the remaining <15% may well form Cpd ES and account for the observed transient absorbance at 410 nm. The short lifetime of the 410-nm band makes further characterization very difficult, but in all likelihood the decay corresponds to the reduction of TyrO•.
The presence of this small amount of CYP101[FeO2]2+ without camphor bound allows us to appreciate the time scale of the events after formation of Cpd 0. The formation and decay of the camphor radical, which has no absorbance maxima in the UV-visible range, cannot be observed, but if the absorbance at 410 nm is indeed caused by formation of TyrO•, this may be taken as a “reporter” for formation of Cpd 1. Thus, although we do not directly observe formation of Cpd 1, we conclude that any Cpd 1 formed immediately oxidizes camphor, or, in the absence of camphor, oxidizes Tyr and does not accumulate. In agreement with this interpretation, we observe that the decay of TyrO• “trails” that of Cpd 0; the first rate constant for the decay of TyrO• is about half that of Cpd 0 (Table 1).
Within the error, the yield of product formation approaches 100%, that is, for every molecule of Cpd 0 produced, one of 5-hydroxycamphor was formed. This finding agrees with the cryoreduction study (7), with one difference. By pulse radiolysis, we find quantitative conversion of CYP101 to Cpd 0, whereas the reported yield of Cpd 0 by cryoreduction was ∼50% (7), which may reflect changes in conformation of CYP101[FeO2]2+ upon reduction at 4 °C that would not be possible at the much lower temperatures used in the cryoreduction studies.
Isotope effect
The observed kinetic deuterium isotope effect of 2 corroborates our assignment of the observed absorption band of 440 nm to Cpd 0, which becomes protonated after reduction according to the canonical cycle shown in Fig. 1. In contrast, the rate of decay of absorbance at 410 nm is essentially the same in D2O and H2O (Fig. 3C and S4b); the absence of an isotope effect fits with the hypothesis that any TyrO• formed would be reduced by other amino acids, with no isotope effect.
Cpd 1 does not accumulate
It is intriguing that, with camphor bound to CYP101, we find no indication for formation of Cpd 1, i.e. no absorbance increase near 370 or 690 nm, whereas Rittle and Green (12) found convincing support for production of such a species in the absence of substrate, after the reaction of CYP119 with chloroperbenzoate. Given the small absorptivity, 4 × 10³ m−1 cm−1 at 690 nm (29), it is unlikely that under our experimental conditions, we would observe any increase in absorbance at that wavelength, but an intermediate giving rise to a band at a wavelength lower than 400 nm should have been observable. Formation of Cpd 1 was also not observed in cryostudies (7). Without substrate bound, CYP101[FeO2]2+ is too unstable to be effectively reduced by pulse radiolysis.
Although we did not observe any accumulation of Cpd 1, we must infer from isotope studies at low temperature that Cpd 1 is involved in the mechanism (30): the hydrogen attached to camphor is retained in the hydroxylated form when the reaction is carried out with deuterated camphor (31). Furthermore, it would seem unlikely that Cpd 0, with electrode potential E°′ = +0.93 V (3), could rapidly oxidize Tyr, which would require a redox partner with E°′ = +0.97 V (32). Indeed, Cpd 1, with E°′ = +1.35 V (3), is a far more likely candidate.
Our results suggest that hydroxylation is rather fast, as inferred from the observation that at 4 °C, the conversion of Cpd 0 to CYP101Fe3+ takes 37 μs, calculated from the half-life of the decay at 440 nm, 7.4 μs, based on k440 nm = 9.6 × 10⁴ s−1, and multiplying the half-life by 5. Given this rate constant for the disappearance of Cpd 0 and under the assumption that Cpd 1 is formed, the Gibbs activation energy is about 45 kJ/mol (Fig. 5), as calculated via Equation 2,
| (Eq. 2) |
in which k is the rate constant, kB is Boltzmann's constant, h is Planck's constant, T is the temperature, ΔG‡ is the Gibbs energy of activation, and R is the gas constant. Because the next two steps, abstraction of a hydrogen from camphor and the rebound (33) step, are not observable, these reactions must have rates of ≥106 s−1 and thus activation energies of ≤39 kJ/mol. With radical clock experiments, it has been established that the rebound step is extremely fast, with rate constants on the order of 1010–1011 s−1 (34), values that imply activation energies much smaller than 39 kJ/mol, indeed, close to 0 kJ/mol. Taking into consideration that the experiments were carried out at 4 °C and using the value of 45 kJ/mol in Equation 2, we calculate that, at a physiological temperature of 37 °C, conversion of Cpd 0 to Cpd 1 is faster by a factor of 11. This factor implies that, at physiological temperatures, this process requires only 3.5 μs.
Figure 5.

Energetics of the hydroxylation of camphor. Cpd 0 ([FeOOH]2+), Cpd 1 (FeO2+, por•+), and Cpd 2 (FeO2+) with the camphor radical are isoenergetic, as explained in the supporting materials. The reaction is “pulled” by the very favorable final step, the formation of 5-hydroxycamphor and Fe3+ CYP101. Given the rate constant of the decay of Cpd 0, 105 s−1, and that Cpds 1 and 2 are not observed, we assume that the latter are formed and decay with rate constants of 106 s−1 or higher. These rate constants give rise to the Gibbs energies of the transition states of 45 and 39 kJ/mol; 39 kJ/mol is the upper limit for the transition states between Cpds 1 and 2 and Cpd 2 and Fe3+.
Further oxidation of 5-hydroxycamphor
In addition to the 5-hydroxycamphor, we observed formation of the further oxidized product 5-ketocamphor (Fig. 4A), production of which has also been reported from multiple turnovers of the enzyme (35, 36). The ketone product could also be formed by reaction with H2O2, which is a direct product of pulse radiolysis that can oxidize alcohols in the presence of Fe3+ (37). We concluded that the ≤20 μm of H2O2 generated during pulse radiolysis is unlikely to cause further oxidation of 5-hydroxycamphor, because even bulk addition of 1 mm H2O2 to a mixture of CYP101-Fe+3 and hydroxycamphor did not produce any 5-ketocamphor (Fig. S6a). The organic hydroperoxides (CH3)2C(OH)CH2OOH formed in small amounts from the scavenger molecule t-BuOH directly after irradiation could possibly react with 5-hydroxycamphor to form 5-ketocamphor via a yet undocumented reaction mechanism. Conversion of the primary alcohol product to a ketone may also be catalyzed during multiple turnovers of CYP101 (36); 5-hydroxycamphor remaining in the active site could be oxidized during a second reaction cycle initiated by transfer of electrons to the heme from aromatic residues, followed by binding of O2, etc. We observed the formation of very small amounts of 5-ketocamphor when 5-hydroxycamphor was added as a substrate to CYP101Fe2+, believed to have been stripped of camphor, either before irradiation in the presence of O2 or after irradiation as a negative control.
Energetics
The abstraction of H from camphor by Cpd 1 is, within the error of the estimates, thermoneutral (reaction S1), whereas the rebound step is very favorable, −241 kJ/mol, (Reaction S4). The energetics of the hydroxylation of camphor by CYP101 are shown in Fig. 5.
The value of E°(C•, H+/CH) = +1.7 V (see supporting materials), or +1.3 V at pH 7, in which CH represents camphor and C• represents the camphor radical, corresponds to a bond dissociation energy ΔBDEH° = 397 kJ/mol, which agrees very well with that calculated by in silico methods (38). Oxidation of methane or other small alkanes would require dissociation of a stronger C–H bond. For CH4, ΔBDEH° = 435 kJ/mol, which corresponds to an electrode potential of +2.0 V at pH 0, and +1.6 V at pH 7; slightly smaller numbers are obtained for other small alkanes. Compared with the E°′ of +1.3 V for the one-electron oxidation of camphor, the value of +1.6 V required for CH4 implies that the activation barrier for hydrogen abstraction is higher by ∼24 kJ/mol, making the reaction much slower, with an important consequence. A small alkane bound to the active site of cytochrome P450 would diffuse readily away, and hydroxylation is possible only when the substrate cannot escape, as has been achieved by the addition of perfluorocarboxylic acids that block the entrance of the active site of cytochrome P450 (39).
Tethering in silico to reality
In silico calculations yield energies larger than those calculated by means of thermodynamic cycles. For example, the reaction Cpd 0 + H+ → Cpd 1 + H2O, is “either almost thermoneutral or slightly exothermic, with a 'best' estimated reaction energy of −8 kcal/mol” (40). However, the value of −8 kcal/mol cannot be correct, because either Cpd 1 would not be sufficiently oxidizing to abstract H, or H2O2 would dissociate from Cpd 0, or both (3). Thus, “almost thermoneutral” must be correct. The activation enthalpy of the transition between Cpd 0 and Cpd 1 has been reported as ∼15 kcal/mol or 63 kJ/mol (38); the Gibbs energy would be higher. For this reaction, we estimate a Gibbs activation energy of only 45 kJ/mol (Fig. 5). If, at a minimum, the barrier were 63 kJ/mol, t½ would be 9 ms, and Cpd 0 should have been observed in stopped-flow experiments but was not. Thus, as no formation of Cpd 0 was detected, we question that the enthalpy could be as high as 63 kJ/mol. The third example is the energy for the release of O2˙̄ from CYP101[FeO2]2+, which has been reported as 19.5 kcal/mol (41). The value from a simple thermodynamic cycle, for which experimental values are used, is 34 kJ/mol (3) or 8.1 kcal/mol.
In silico calculations applied to complicated reactions have been questioned (42). It is possible and essential to make in silico calculations more quantitative by “tethering” them to semiempirical values and considerations of relatively simple thermodynamic cycles.
Conclusions
We demonstrate that it is possible to mimic the natural catalytic cycle of CYP101 by using pulse radiolysis to rapidly supply electrons to the protein. This rapid electron delivery allowed us to visualize the steps following the reduction of substrate bound CYP101[FeO2]2+ on the microsecond timescale. We found that, as soon as Cpd 0 is formed, the rest of the cycle is completed within 40 μs at 4 °C. We found no spectral evidence that Cpd 1 accumulates. We demonstrate that product formation is quantitative once CYP101[FeO2]2+ is reduced by one electron. Further, reduction of the enzyme by this method does not damage the enzyme, as is demonstrated by the complete recovery of enzyme activity and of Fe3+ after pulse radiolysis.
Experimental procedures
Protein preparation
CYP101 was expressed and purified as previously described, with slight modifications (41) (see supporting text and Fig. S7 for details). The ratio A392/A280 was 1.62.
Pulse radiolysis
Pulse radiolysis produces ionizing radiation that leads to the formation of primary species from water with the following yields: G(HO•) = 2.65, G(eaq−) = 2.65, G(H•) = 0.54, G(H2O2) = 0.54, where G = 1.0 refers to 0.1036 μm species generated per 1 J/kg energy absorbed. Experiments were performed with a 2 MeV Febetron 705 accelerator (Titan Systems Corp., presently L-3 Communications, San Leandro, CA), with <50-ns pulses of 80 Gy and a custom-built 6-cm quartz irradiation cell (Hellma, Mülhausen, Germany) with a volume of 180 μl. Dosimetry was carried out with KSCN (43). Absorbance maxima of 380–450 nm were measured by means of a 300 mm Czerny–Turner type monochromator equipped with a grating of 150 grooves/mm with 300 nm blazing and a photomultiplier for detection; for wavelengths ≥ 450 nm, a grating of 150 grooves/mm with 500 nm blazing was used. The monochromator slit width was set to 0.4 mm.
Sample preparation for reaction of hydrated electrons with [FeO2]2+CYP101
All experiments were carried out at 4 °C. CYP101Fe3+ in the presence of camphor was reduced with a slight excess of S2O42− inside a N2-filled glove box and loaded into a 10-ml gas-tight syringe (Hamilton Sample Lock). A second gas-tight syringe contained a solution of 100 μm O2 in 10 mm pH 7.4 potassium phosphate buffer, 10 μm camphor with 2 mm t-BuOH. t-BuOH was used to scavenge HO•. The two air-tight syringes were placed in a syringe pump prior to pulse irradiation. To maintain the temperature at 4 °C before mixing, the capillaries from the syringes to the mixer were kept on ice. Irradiation took place within 30 s after mixing, such that CYP101[FeO2]2+ did not decay significantly before irradiation. The buffer used in pulse radiolysis, UV-visible, GC-MS, and stopped-flow experiments was 10 mm potassium phosphate buffer, pH 7.4, containing 2 equivalents of camphor relative to CYP101, or as otherwise specified.
Product analysis
A solution of 100 μm reduced CYP101 containing 100 μm of camphor was mixed with air-saturated buffer prior to irradiation. The applied dose was 200 Gy in a single pulse. A total of ∼1 ml of irradiated solution was collected. Substrate and products were extracted with chloroform (1:1 v/v) containing 1 mm decane as an external standard; the organic layer was concentrated by evaporation under a stream of N2 and analyzed by GC-MS or GC-FID. Peaks were assigned by GC-MS and quantified by peak integration of the GC-FID traces and comparison with standard curves of the substrate and product. The product 5-hydroxycamphor was synthesized enzymatically as described previously (41).
Author contributions
H. E. performed the majority of the experiments. T. N. guided and assisted with the pulse radiolysis experiments. H. E., A. V., and P. L. B. were involved in the preparation and purification of CYP 101. H. E. and A. V. performed the product analysis and quantification studies. W. H. K. directed the experiments and introduced the energetics in the discussion. All authors contributed to the writing.
Supplementary Material
Acknowledgments
We thank Dr. I. Schlichting (Max Planck Institute for Medical Research, Heidelberg, Germany), Prof. M. Green (Pennsylvania State University, University Park, Pennsylvania), and Dr. R. Kissner (ETH Zürich, Zurich Switzerland) for helpful discussions.
This work was supported by the ETH Zurich, Grant ETH-38 10-3. The authors declare that they have no conflicts of interest with the contents of this article.
This article contains supporting text and equations, Table S1, and Figs. S1–S7.
- CYP
- cytochrome P450
- CYP101Fe3+
- cytochrome P450cam
- Cpd 0
- compound 0, or [FeOOH]2+
- Cpd 1
- compound 1, or [FeO2+por•+]
- Cpd 2
- compound 2, or [FeO]2+
- eaq−
- hydrated electron
- Gy
- Gray
- FID
- flame ionization detection
- PR
- pulse radiolysis.
References
- 1. Denisov I. G., and Sligar S. G. (2015) Activation of molecular oxygen in cytochromes P450. In Cytochrome P450: Structure, Mechanism and Biochemistry (Ortiz de Montellano P. R., ed) pp. 69–109, Springer, Berlin, Germany [Google Scholar]
- 2. Gunsalus I. C., and Wagner G. C. (1978) Bacterial P-450cam methylene monooxygenase components: cytochrome m, putidaredoxin, and putidaredoxin reductase. In Methods Enzymol. Biomembranes: Part C. Biological Oxidations (Fleischer S., and Packer L., eds) pp. 166–188, Academic Press, Orlando, FL: [DOI] [PubMed] [Google Scholar]
- 3. Koppenol W. H. (2007) Oxygen activation by cytochrome P450: a thermodynamic analysis. J. Am. Chem. Soc. 129, 9686–9690 [DOI] [PubMed] [Google Scholar]
- 4. Lipscomb J. D. (1980) Electron paramagneitc resonance detectable states of cytochrome P450cam. Biochemistry 19, 3590–3599 [DOI] [PubMed] [Google Scholar]
- 5. Poulos T. L., Finzel B. C., and Howard A. J. (1986) Crystal structure of substrate-free Pseudomonas putida cytochrome P-450. Biochemistry 25, 5314–5322 [DOI] [PubMed] [Google Scholar]
- 6. Nagano S., and Poulos T. L. (2005) Crystallographic study on the dioxygen complex of wild-type and mutant cytochrome P450cam. Implications for the dioxygen activation mechanism. J. Biol. Chem. 280, 31659–31663 [DOI] [PubMed] [Google Scholar]
- 7. Davydov R., Makris T. M., Kofman V., Werst D. E., Sligar S. G., and Hoffman B. M. (2001) Hydroxylation of camphor by reduced oxy-cytochrome P450cam: mechanistic implications of EPR and ENDOR studies of catalytic intermediates in native and mutant enyzmes. J. Am. Chem. Soc. 123, 1403–1415 [DOI] [PubMed] [Google Scholar]
- 8. George P. (1952) Chemical nature of the secondary hydrogen peroxide compound formed by cytochrome-c peroxidase and horseradish peroxidase. Nature 169, 612–613 [DOI] [PubMed] [Google Scholar]
- 9. Egawa T., Shimada H., and Ishimura Y. (1994) Evidence for compound I formation in the reaction of cytochrome-P450cam with m-chloroperbenzoic acid. Biochem. Biophys. Res. Commun. 201, 1464–1469 [DOI] [PubMed] [Google Scholar]
- 10. Spolitak T., Dawson J. H., and Ballou D. P. (2005) Reaction of ferric cytochrome P450cam with peracids: kinetic characterization of intermediates on the reaction pathway. J. Biol. Chem. 280, 20300–20309 [DOI] [PubMed] [Google Scholar]
- 11. Yuan X., Wang Q., Horner J. H., Sheng X., and Newcomb M. (2009) Kinetics and activation parameters for oxidations of styrene by compounds I from the cytochrome P450BM-3 (CYP102A1) heme domain and from CYP119. Biochemistry 48, 9140–9146 [DOI] [PMC free article] [PubMed] [Google Scholar]
- 12. Rittle J., and Green M. T. (2010) Cytochrome P450 compound I: capture, characterization, and C-H bond activation kinetics. Science 330, 933–937 [DOI] [PubMed] [Google Scholar]
- 13. Franke A., and van Eldik R. (2015) Spectroscopic and kinetic evidence for the crucial role of compound 0 in the P450cam-catalyzed hydroxylation of camphor by hydrogen peroxide. Chemistry 21, 15201–15210 [DOI] [PubMed] [Google Scholar]
- 14. Hsieh C. H., Huang X., Amaya J. A., Rutland C. D., Keys C. L., Groves J. T., Austin R. N., and Makris T. M. (2017) The enigmatic P450 decarboxylase OleT Is capable of, but evolved to frustrate, oxygen rebound chemistry. Biochemistry 56, 3347–3357 [DOI] [PMC free article] [PubMed] [Google Scholar]
- 15. Kuznetsov V. Y., Poulos T. L., and Sevrioukova I. F. (2006) Putidaredoxin-to-cytochrome P450cam electron transfer: differences between the two reductive steps required for catalysis. Biochemistry 45, 11934–11944 [DOI] [PMC free article] [PubMed] [Google Scholar]
- 16. Debey P., Land E. J., Santus R., and Swallow A. J. (1979) Electron transfer from pyridinyl radicals, hydrated electrons, carbon dioxide radical and superoxide radical to bacterial cytochrome P450. Biochem. Biophys. Res. Commun. 86, 953–960 [DOI] [PubMed] [Google Scholar]
- 17. Hasinoff B. B. (1985) Quantitative structure–activity relationships for the reaction of hydrated electrons with heme proteins. Biochim. Biophys. Acta 829, 1–5 [Google Scholar]
- 18. Kobayashi K., Amano M., Kanbara Y., and Hayashi K. (1987) One-electron reduction of the oxyform of 2,4-diacetyldeuterocytochrome P-450cam. J. Biol. Chem. 262, 5445–5447 [PubMed] [Google Scholar]
- 19. Peterson J. A., Ishimura Y., and Griffin B. W. (1972) Pseudomonas putida cytochrome P-450: characterization of an oxygenated form of the hemoprotein. Arch. Biochem. Biophys. 149, 197–208 [DOI] [PubMed] [Google Scholar]
- 20. Atkins W. M., and Sligar S. G. (1988) Deuterium isotope effects in norcamphor metabolism by cytochrome P-450cam: kinetic evidence for the two-electron reduction of a high-valent iron-oxo intermediate. Biochemistry 27, 1610–1616 [DOI] [PubMed] [Google Scholar]
- 21. Braams R. (1966) Rate constants of hydrated electron reactions with amino acids. Radiat. Res. 27, 319–329 [PubMed] [Google Scholar]
- 22. Getoff N. (1992) Pulse radiolysis of aromatic amino acids: state of the art. Amino Acids 2, 195–214 [DOI] [PubMed] [Google Scholar]
- 23. Denisov I. G., Makris T. M., and Sligar S. G. (2001) Cryotrapped reaction intermediates of cytochrome P450 studied by radiolytic reduction with phosphorus-32. J. Biol. Chem. 276, 11648–11652 [DOI] [PubMed] [Google Scholar]
- 24. Bielski B. H. J., Cabelli D. E., Arudi R. L., and Ross A. B. (1985) Reactivity of HO2/O2− radicals in aqueous solution. J. Phys. Chem. Ref. Data 14, 1041–1100 [Google Scholar]
- 25. Spolitak T., Dawson J. H., and Ballou D. P. (2006) Rapid kinetics investigations of peracid oxidation of ferric cytochrome P450cam: nature and possible function of compound ES. J. Inorg. Biochem. 100, 2034–2044 [DOI] [PubMed] [Google Scholar]
- 26. Collins D. P., Spolitak T., Ballou D. P., and Dawson J. H. (2010) 28 The generation and characterization of the compounds I and ES states of cytochrome P450 using rapid mixing methods. In Handbook of Porphyrin Science, pp. 299–329, World Scientific Publishing Company, Hackensack, NJ [Google Scholar]
- 27. Schünemann V., Jung C., Trautwein A. X., Mandon D., and Weiss R. (2000) Intermediates in the reaction of substrate-free cyrochrome P450cam with peroxy acetic acid. FEBS Lett. 179, 149–154 [DOI] [PubMed] [Google Scholar]
- 28. Griffin B. W., and Peterson J. A. (1972) Camphor binding of Pseudomonas putida cytochrome P-450: kinetics and thermodynamics of the reaction. Biochemistry 11, 4740–4746 [DOI] [PubMed] [Google Scholar]
- 29. Kellner D. G., Hung S. C., Weiss K. E., and Sligar S. G. (2002) Kinetic characterization of compound I formation in the thermostable cytochrome P450 CYP119. J. Biol. Chem. 277, 9641–9644 [DOI] [PubMed] [Google Scholar]
- 30. Denisov I. G., Makris T. M., Sligar S. G., and Schlichting I. (2005) Structure and chemistry of cytochrome P450. Chem. Rev. 105, 2253–2277 [DOI] [PubMed] [Google Scholar]
- 31. Davydov R., Dawson J. H., Perera R., and Hoffman B. M. (2013) The use of deuterated camphor as a substrate in 1H ENDOR studies of hydroxylation by cryoreduced oxy P450cam provides new evidence of the involvement of compound I. Biochemistry 52, 667–671 [DOI] [PMC free article] [PubMed] [Google Scholar]
- 32. Mahmoudi L., Kissner R., Nauser T., and Koppenol W. H. (2016) Electrode potentials of l-tryptophan, l- tyrosine, 3-nitro-l-tyrosine, 2,3-difluoro-l-tyrosine, and 2,3,5-trifluoro-l-tyrosine. Biochemistry 55, 2849–2856 [DOI] [PubMed] [Google Scholar]
- 33. Groves J. T., and McClusky G. A. (1978) Aliphatic hydroxylation by highly purified liver microsomal cytochrome P-450: evidence for a carbon radical intermediate. Biochem. Biophys. Res. Commun. 81, 154–160 [DOI] [PubMed] [Google Scholar]
- 34. Ortiz de Montellano P. R. (2010) Hydrocarbon hydroxylation by cytochrome P450 enzymes. Chem. Rev. 110, 932–948 [DOI] [PMC free article] [PubMed] [Google Scholar]
- 35. Harada K., Sakurai K., Ikemura K., Ogura T., Hirota S., Shimada H., and Hayashi T. (2008) Evaluation of the functional role of the heme-6-propionate side chain in cytochrome P450cam. J. Am. Chem. Soc. 130, 432–433 [DOI] [PubMed] [Google Scholar]
- 36. Prasad B., Mah D. J., Lewis A. R., and Plettner E. (2013) Water oxidation by a cytochrome p450: mechanism and function of the reaction. PLoS One 8, e61897. [DOI] [PMC free article] [PubMed] [Google Scholar]
- 37. Masoudian S., and Yahyaei H. (2011) Oxidation of alcohols with hydrogen peroxide catalyzed by supported Fe(III) porphyrins. Indian J. Chem. 50A, 1002–1005 [Google Scholar]
- 38. de Visser S. P., Kumar D., Cohen S., Shacham R., and Shaik S. (2004) A predictive pattern of computed barriers for C-H hydroxylation by compound I of cytochrome P450. J. Am. Chem. Soc. 126, 8362–8363 [DOI] [PubMed] [Google Scholar]
- 39. Kawakami N., Cong Z., Shoji O., and Watanabe Y. (2015) Highly efficient hydroxylation of gaseous alkanes at reduced temperature catalyzed by cytochrome P450BM3 assisted by decoy molecules. J. Porphyrins Phthalocyanines 19, 329–334 [Google Scholar]
- 40. Shaik S., Cohen S., Wang Y., Chen H., Kumar D., and Thiel W. (2010) P450 enzymes: their structure. reactivity, and selectivity—modeled by QM/MM calculations. Chem. Rev. 110, 949–1017 [DOI] [PubMed] [Google Scholar]
- 41. Vandemeulebroucke A., Aldag C., Stiebritz M. T., Reiher M., and Hilvert D. (2015) Kinetic consequences of introducing a proximal selenocysteine ligand into cytochrome P450cam. Biochemistry 54, 6692–6703 [DOI] [PubMed] [Google Scholar]
- 42. Plata R. E., and Singleton D. A. (2015) A case study of the mechanism of alcohol-mediated Morita Baylis-Hillman reactions: the importance of experimental observations. J. Am. Chem. Soc. 137, 3811–3826 [DOI] [PMC free article] [PubMed] [Google Scholar]
- 43. Schuler R. H., Patterson L. K., and Janata E. (1980) Yield for the scavenging of hydroxyl radicals in the radiolysis of nitrous oxide-saturated aqueous solutions. J. Phys. Chem. 84, 2088–2089 [Google Scholar]
Associated Data
This section collects any data citations, data availability statements, or supplementary materials included in this article.