

Abstract
Purpose
We investigated the genomic DNA methylation profile of prostate cancer in transgenic adenocarcinoma of the mouse prostate (TRAMP) cancer model and to analyze the crosstalk among targeted genes and the related functional pathways.
Methods
Prostate DNA samples from 24-week-old TRAMP and C57BL/6 male mice were isolated. The DNA methylation profiles were analyzed by methylated DNA immunoprecipitation (MeDIP) followed by next-generation sequencing (MeDIP-seq). Canonical pathways, diseases and function and network analyses of the different samples were then performed using the Ingenuity® Pathway Analysis (IPA) software. Some target genes with significant difference in methylation were selected for validation using methylation specific primers (MSP) and qPCR.
Results
TRAMP mice undergo extensive aberrant CpG hyper- and hypo-methylation. There were 2147 genes with a significant (log2-change ≥ 2) change in CpG methylation between the two groups, as mapped by the IPA software. Among these genes, the methylation of 1105 and 1042 genes was significantly decreased and increased, respectively, in TRAMP prostate tumors. The top associated disease identified by IPA was adenocarcinoma; however, the cAMP response element-binding protein (CREB)-, histone deacetylase 2 (HDAC2)-, glutathione S-transferase pi (GSTP1)- and polyubiquitin-C (UBC)-related pathways showed significantly altered methylation profiles based on the canonical pathway and network analyses. MSP and qPCR results of genes of interests corroborated with MeDIP-seq findings.
Conclusions
This is the first MeDIP-seq with IPA analysis of the TRAMP model to provide novel insight into the genome-wide methylation profile of prostate cancer. Studies on epigenetics, such as DNA methylation, will potentially provide novel avenues and strategies for further development of biomarkers targeted for treatment and prevention approaches for prostate cancer.
Keywords: MeDIP-seq, Epigenetics, DNA methylation, TRAMP, Prostate cancer
Background
Prostate cancer is the second leading male cancer (accounts for 13.8% of all male cancers) and its prevalence ranking number five among all cancers [1]. In the United States, prostate cancer is the most common male cancer subtype, apart from non-melanoma skin cancer [2]. Prostate cancer is a clinically heterogeneous disease with marked variability in patient outcomes [3]. Early detection, accurate prediction and successful management of prostate cancer represent some of the most challenging and controversial issues [4]. Interestingly, epigenetic changes are hallmarks of prostate cancer, among which DNA methylation is the most frequently studied [5].
Epigenetic changes include DNA methylation, histone modification, and posttranslational gene regulation by micro-RNAs (miRNAs) [6]. Among these, DNA methylation has been well studied, and aberrant DNA methylation patterns are a characteristic feature of cancer [7–9]. The first reported epigenetic changes in human cancer were DNA methylation losses. Since then, genomic hypomethylation has been found to be associated with multiple cancer types [10, 11]. In addition, hypermethylation of CpG islands (CGIs) at promoters of tumor suppressor genes, homeobox genes and other sequences are other consistent epigenetic features of cancer [12, 13]. CpG island methylator-phenotype (CIMP) tumors have been identified in many cancers, including oral cancer, colorectal cancer [14] and colon cancer [15]. Therefore, it is worthwhile to profile the global DNA methylation changes between cancer models and controls to elucidate the mechanisms of carcinogenesis.
The transgenic adenocarcinoma of the mouse prostate (TRAMP) model closely represents the pathogenesis of human prostate cancer because male TRAMP mice spontaneously develop autochthonous prostate tumors following the onset of puberty [16] and it specifically induces transgene expression in the prostate, displays distant organ metastases and it has castration-resistant properties [17]. DNA methylation in the TRAMP model has been widely studied in vitro and in vivo, resulting in the discovery of the methylated markers Nuclear factor (erythroid-derived 2)-like 2(NRF2) [18], O6-alkylguanine DNA alkyltransferase (MGMT) [19], glutathione S-transferase pi (GSTP1) [20], 14-3-3σ [21], and Krueppel-like factor 6 (KLF6) [22].
However, only Shannon et al. have compared global methylation alteration among TRAMP and wild type (WT) mice [23]. Systemic comparisons and analyses of the genomic methylation status of prostate cancer models and normal controls are needed to determine the underlying interactions between these target genes and to discover new biomarkers. We are the first to perform methylated DNA immunoprecipitation (MeDIP) coupled with next-generation sequencing (MeDIP-seq) followed by Ingenuity® Pathway Analysis (IPA) studies to investigate the crosstalk among important genes and to analyze overlapping functional pathways by comparing the whole genomic DNA methylation patterns between the TRAMP model and controls.
Methods
Genomic DNA extraction from TRAMP and C57BL/6 male mice
The breeding of TRAMP mice was same as for our previous studies [24, 25]. Briefly, female hemizygous C57BL/TGN TRAMP mice, line PB Tag 8247NG (Jackson Laboratory, Bar Harbor, ME), were bred with the same genetic background male C57BL/6 mice (Jackson Laboratory, Bar Harbor, ME). Identity of transgenic mice was established by PCR-based DNA genotyping using the primers suggested by The Jackson Laboratory as we previously described [24, 25]. F1 (first generation from cross breeding) or F2 (second generation from cross breeding) male TRAMP mice were used for the studies. Mice were housed in cages containing wood-chip bedding in a temperature-controlled room (20–22 °C) with a 12-h-light/dark cycle and a relative humidity of 45–55% at Rutgers Animal Care Facility. All animals received water and food ad libitum until sacrifice (24 weeks of age) by carbon dioxide euthanasia. The study was performed using an IACUC-approved protocol (01-016) at Rutgers University. Mice were weighed and evaluated in the overall health twice weekly throughout the study. Presences of palpable tumor, metastases, genitourinary (GU) apparatus weight were evaluated upon necropsy and prostate intraepithelial neoplasia lesions (evaluated by H&E staining) were monitored in the TRAMP group (data not shown). Prostate samples from three 24-week-old TRAMP and three 24 weeks old C57BL/6 mice (maintained under similar conditions) were randomly selected out. A DNeasy Kit (Qiagen, Valencia, CA, USA) was used to extract the genomic DNA (gDNA) from whole prostate samples of three 24-week-old male TRAMP mice and three age-matched C57BL/6 male mice following the kit’s protocol. After extraction and purification, the gDNA samples were electrophoresed on an agarose gel, and the OD ratios were measured to confirm the purity and concentrations of the gDNA prior to fragmentation by Covaris (Covaris, Inc., Woburn, MA USA). The fragmented gDNA was then evaluated for size distribution and concentration using an Agilent Bioanalyzer 2100 and a NanoDrop spectrophotometer.
MeDIP-seq measurement
Following the manufacturer’s instructions, MeDIP was performed to analyze genome-wide methylation using the MagMeDIP Kit from Diagenode (Diagenode Inc., Denville, NJ, USA). Methylated DNA was separated from unmethylated fragments by immunoprecipitation with a 5-methylcytidine monoclonal antibody from Eurogentec (Eurogentec S.A., Seraing, Belgium). Illumina libraries were then created from the captured gDNA using NEBNext reagents (New England Biolabs, Ipswich, MA, USA). Enriched libraries were evaluated for size distribution and concentration using an Agilent Bioanalyzer 2100, and the samples were then sequenced on an Illumina HiSeq2000 machine, which generated paired-end reads of 90 or 100 nucleotides (nt). The results were analyzed for data quality and exome coverage using the platform provided by DNAnexus (DNAnexus, Inc., Mountain View, CA, USA). The samples were sent to Otogenetics Corp. (Norcross, GA) for Illumina sequencing and alignment with the reference mouse genome. The resulting BAM files were downloaded for analysis.
Modified from the Trapnell method, the MeDIP alignments were compared with control sample alignments using Cuffdiff 2.0.2 with no length correction [26]. A list of overlapping regions of sequence alignment that were common to both the immunoprecipitated and control samples was created and used to determine the quantitative enrichment of the MeDIP samples over the control samples using Cuffdiff; statistically significant peaks (reads) at a 5% false discovery rate (FDR) and a minimum fourfold difference, as calculated using the Cummerbund package in R, were selected [26]. Sequencing reads were matched with the adjacent annotated genes using ChIPpeakAnno [27], and the uniquely mapped reads were used to compare the differences between TRAMP and wild-type mice.
The reads were visualized and individual genes examined using Integrative Genomics Viewer (IGV) [28]. IGV allows users to explore aligned reads at any level of details by changing resolution, scrolling through and searching for specific chromosomes, genes or regions [29]. We specifically examined genes that produced differences in methylation between the TRAMP and control groups of fourfold or more (log2 difference ≥ 2). IGV provided more in-depth understanding of these differences by graphing distributions of reads against the reference genome. Heat maps were used to graphically represent methylation levels in genes and to compare the methylation of the two groups. We used green color to signify positive differences in methylation and the red color for the negative differences (TRAMP minus control). Brighter shades correspond to more extreme values, i.e. larger fold-changes.
Canonical pathways, diseases and function and network analysis by IPA
Genes selected from the MeDIP-seq experiment based on significantly increased or decreased fold changes (log2-fold change ≥ 2) in methylation were analyzed (based on the p values; TRAMP vs control) using IPA 4.0 When using IPA (IPA 4.0, ingenuity systems, http://www.ingenuity.com), the pathway enrichment p value is calculated using the right-tailed Fisher’s exact test. A smaller p value indicated that the association was less likely to be random and more likely to be significant. In general, values of 0.05 (for p value) or 1.30 (for − log10p) were set as the thresholds. p values less than 0.05 or − log10p more than 1.30 were considered to be statistically significant, non-random associations. IPA utilized gene symbols to identify neighboring enriched methylation peaks using ChIPpeakAnno for all of the analyses. Using IPA, 2147 genes from TRAMP group that showed a log2-fold change ≥ 2 compared with the control group were mapped. Based on these fold changes, IPA identified the canonical pathways, biological functions/related diseases and networks that were closely related to the TRAMP model.
MeDIP-seq data validation via methylation-specific PCR (MSP)
Genomic DNA was extracted and purified from six prostate samples (three from TRAMP mice and three from normal C57BL/6 mice) using the AllPrep DNA/RNA/Protein Mini Kit (Qiagen, Valencia, CA, USA). Then 500 ng genomic DNA was underwent bisulfite conversion with an EZ DNA Methylation-Gold Kit (Zymo Research Corp., Orange, CA) following the kit’s protocol as described previously [30]. The converted DNA was amplified by PCR using EpiTaq HS DNA polymerase (Clontech Laboratories Inc, Mountain View, CA 94043, USA). According to MeDIP-seq results, four target genes (two with increased methylation and two with decreased methylation), dynein cytoplasmic 1 intermediate chain 1 (DYNC1I1), solute carrier family 1 member 4 (SLC1A4), XRCC6-binding protein 1 (Xrcc6bp1) and transthyretin (TTR), were selected for MSP validation. The primers’ sequences for the methylated reactions (MF and MR) and for the unmethylated reactions (UF and UR) and band size of products are listed in Table 1. By running agarose gel electrophoresis, the amplification product bands were isolated and were semi-quantitated by densitometry using ImageJ (Version 1.48d; NIH, Bethesda, Maryland, USA).
Table 1.
Primer sequences used in MSP
| Gene name | Primer name | Primer sequence | Band size (bp) |
|---|---|---|---|
| Dync1i1 | Dync1i1-MF | TATGAAGAAAAATATAGTAAGATACGG | 232 |
| Dync1i1-MR | ACGAACATTTCACATTTCGAA | ||
| Dync1i1-UF | TTTATGAAGAAAAATATAGTAAGATATGG | 235 | |
| Dync1i1-UR | CACAAACATTTCACATTTCAAA | ||
| Slc1a4 | Slc1a4-MF | ATAAATTATTTTTTTTATGTTACGG | 216 |
| Slc1a4-MR | TTAATAATACATACCTATAATCCGAC | ||
| Slc1a4-UF | ATAAATTATTTTTTTTATGTTATGG | 216 | |
| Slc1a4-UR | TTAATAATACATACCTATAATCCAAC | ||
| Xrcc6bp1 | Xrcc6bp1-MF | GTTAATGTGAGAGTTAGAATAGTATAGGAC | 110 |
| Xrcc6bp1-MR | AATTAATACAATATTTCGATACCGAT | ||
| Xrcc6bp1-UF | GTTAATGTGAGAGTTAGAATAGTATAGGAT | 110 | |
| Xrcc6bp1-UR | AATTAATACAATATTTCAATACCAAT | ||
| TTR | TTR-MF | GGAATTTAAGATACGGTTTATATCGA | 106 |
| TTR-MR | AACACTCTTTCGAACATACTCGAC | ||
| TTR-UF | AGGAATTTAAGATATGGTTTATATTGA | 108 | |
| TTR-UR | AAACACTCTTTCAAACATACTCAAC |
Primer sequences are started from 5′ (left) to 3′ (right)
MF forward primer sequence for the methylated reactions, MR reverse primer sequence for the methylated reactions, UF forward primer sequence for the unmethylated reactions, UR reverse primer sequence for the unmethylated reactions
Validation of selected gene expression by quantitative real-time RT-PCR
Total RNA was extracted and purified from six prostate samples (three from TRAMP mice and three from normal C57BL/6 mice) using the same kit above. cDNA was synthesized from total RNA using a SuperScript III First-Strand Synthesis System (Invitrogen, Grand Island, NY) following the kit’s instruction. mRNA levels were determined using quantitative real-time PCR (qPCR). Histamine N-methyltransferase (HNMT), Dync1i1, SLC1A4, crystallin zeta (CRYZ) and TTR were randomly selected to compare mRNA expression among WT and TRAMP mice prostate samples. The primers’ sequences for HNMT, DYNC1I1, SLC1A4, CRYZ, TTR and β-Actin are listed in Table 2.
Table 2.
Primer sequences used in qPCR
| Gene name | Primer name | Primer sequence |
|---|---|---|
| HNMT | Sense | 5′-GCTGCCAGTGCTAAAATTCTC-3′ |
| Antisense | 5′-CAGGTCATCCAGTATCTGCG-3′ | |
| DYNC1I1 | Sense | 5′-GTGTACGATGTCATGTGGTCC-3′ |
| Antisense | 5′-AACTCGGTTTAG GGCAGATG-3′ | |
| SLC1A4 | Sense | 5′-CCTCACAATTGCCATCATCTT G-3′ |
| Antisense | 5′-CATCCCCTTCCACATTCACC-3′ | |
| CRYZ | Sense | 5′-GCAGCCGATGACACTATCTAC-3′ |
| Antisense | 5′-GCCCCATGAACCAAAACG-3′ | |
| TTR | Sense | 5′-AATCGTACTGGAAGACACTTGG-3′ |
| Antisense | 5′-TGGTGCTGTAGGAGTATGG-3′ | |
| β-Actin | Sense | 5′-CGTTCAATACCCCAGCCATG-3′ |
| Antisense | 5′-ACCCCGTCACCAGAGTCC-3′ |
Results
MeDIP-seq results comparison
One of our main goals of this study was to screen and reveal aberrantly methylated genes to discover the related functions and pathways that might mediate the development of prostate cancer. To accomplish this goal in an unbiased manner, the MeDIP-seq results were analyzed using IPA. The first objective was to compare the total number of molecules with altered methylation in prostate samples of TRAMP mice to that of normal mice. Prostate samples were collected from the TRAMP and C57BL/6 mice, gDNA was isolated, and whole-genome DNA methylation analysis was performed using the described MeDIP-seq method. The results were analyzed in a paired manner, comparing the prostate tissue samples for each model. For the control, 16 509 344 (80.8%) mapped and 3 921 684 (19.2%) unmapped reads, for a total of 20 431 028 reads, were obtained. For the TRAMP mice, 12 097 771 (82.3%) mapped and 2 609 269 (17.7%) unmapped reads, for a total of 14 707 040 reads, were obtained (Fig. 1a). After identification and mapping to the library, the identified methylated regions (peaks) of the given genes were compared between the TRAMP and control mice, and IPA was used to identify the genes with significantly altered methylation in the TRAMP mice compared with the controls (p < 0.05 or − log10p > 1.30, and log2-fold change ≥ 2).
Fig. 1.
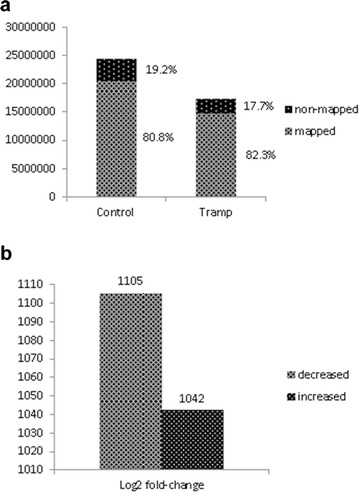
Total mapping reads in the control and TRAMP mice (a) and the total number of significantly (log2-fold change ≥ 2) increased and decreased methylated genes in the TRAMP mice compared with the control mice (b)
Genes were sorted in the order of differences in methylation. Genes with the change in methylation levels of fourfold or more (both, positive and negative) were then used as an input to the IPA software. According to the IPA setting, the p value for a given process annotation was calculated by considering (1) the number of focus genes that participated in the process and (2) the total number of genes that are known to be associated with that process in the selected reference set. The more focus genes that are involved, the more likely the association is not due to random chance, resulting in a more significant p value (larger − log10p value). Altogether, 2147 genes between the two groups showed a significant change (log2-fold change ≥ 2) in methylated peaks. Compared with the control, significantly decreased methylation of 1105 genes and significantly increased methylation of 1042 genes were observed in TRAMP (Fig. 1b). The top fifty genes with increased methylation (Table 3) or decreased methylation (Table 4) located in promoter region, gene body or downstream of the gene were highlighted according to the log2-fold change, ranking from the largest to the smallest change and with significant statistic difference (p < 0.05). We also plotted the top 100 decreased or increased (log2-fold change) methylated genes comparing with TRAMP to WT in different regions by MeDIP analysis, ranked by alphabet (Fig. 2).
Table 3.
Top 50 annotated genes with increased methylation, ranked by log2-fold change
| Rank | Symbol | Gene name | Log2-fold change (TRAMP/WT) | Location | Type(s) | Methylation region |
|---|---|---|---|---|---|---|
| 1 | FGD4 | FYVE, RhoGEF and PH domain containing 4 | 4.993 | Cytoplasm | Other | Promoter |
| 2 | MED13L | Mediator complex subunit 13-like | 4.993 | Nucleus | Other | Downstream |
| 3 | DYNC1I1 | Dynein, cytoplasmic 1, intermediate chain 1 | 4.926 | Cytoplasm | Other | Body |
| 4 | XK | X-linked Kx blood group | 4.781 | Plasma membrane | Transporter | Body |
| 5 | EAPP | E2F-associated phosphoprotein | 4.703 | Cytoplasm | Other | Body |
| 6 | TGFA | Transforming growth factor, alpha | 4.534 | Extracellular space | Growth factor | Promoter |
| 7 | BTG1 | B-cell translocation gene 1, anti-proliferative | 4.440 | Nucleus | Transcription regulator | Promoter |
| 8 | BARD1 | BRCA1 associated RING domain 1 | 4.341 | Nucleus | Transcription regulator | Promoter |
| 9 | GJA1 | Gap junction protein, alpha 1, 43 kDa | 4.341 | Plasma membrane | Transporter | Promoter |
| 10 | Zfp640 | Zinc finger protein 640 | 4.234 | Other | Other | Downstream |
| 11 | S100A5 | S100 calcium-binding protein A5 | 4.119 | Nucleus | Other | Promoter |
| 12 | SOX17 | SRY (sex-determining region Y)-box 17 | 4.119 | Nucleus | Transcription regulator | Downstream |
| 13 | PDGFRL | Platelet-derived growth factor receptor-like | 3.993 | Plasma membrane | Kinase | Body |
| 14 | ZKSCAN2 | Zinc finger with KRAB and SCAN domains 2 | 3.993 | Nucleus | Transcription regulator | Promoter |
| 15 | DMXL2 | Dmx-like 2 | 3.926 | Cytoplasm | Other | Body |
| 16 | LEPR | Leptin receptor | 3.926 | Plasma membrane | Transmembrane receptor | Body |
| 17 | AOAH | Acyloxyacyl hydrolase (neutrophil) | 3.855 | Extracellular space | Enzyme | Promoter |
| 18 | Apol7e | Apolipoprotein L 7e | 3.855 | Other | Other | Body |
| 19 | CACNG6 | Calcium channel, voltage-dependent, gamma subunit 6 | 3.855 | Plasma membrane | Ion channel | Promoter |
| 20 | CHCHD3 | Coiled-coil-helix-coiled-coil-helix domain containing 3 | 3.855 | Cytoplasm | Other | Body |
| 21 | FAM174B | Family with sequence similarity 174, member B | 3.855 | Other | Other | Body |
| 22 | GALNT13 | Polypeptide N-acetylgalactosaminyltransferase 13 | 3.855 | Cytoplasm | Enzyme | Body |
| 23 | GPR37 | G protein-coupled receptor 37 (endothelin receptor type B-like) | 3.855 | Plasma membrane | G-protein coupled receptor | Downstream |
| 24 | Mup1 | Major urinary protein 1 | 3.855 | Extracellular space | Other | Downstream |
| 25 | NGF | Nerve growth factor (beta polypeptide) | 3.855 | Extracellular space | Growth factor | Downstream |
| 26 | OLFM3 | Olfactomedin 3 | 3.855 | Cytoplasm | Other | Body |
| 27 | PCBP3 | Poly(rC)-binding protein 3 | 3.855 | Nucleus | Other | Body |
| 28 | RBMS3 | RNA-binding motif, single-stranded-interacting protein 3 | 3.855 | Other | Other | Body |
| 29 | TMX1 | Thioredoxin-related transmembrane protein 1 | 3.855 | Cytoplasm | Enzyme | Downstream |
| 30 | ZNF14 | Zinc finger protein 14 | 3.855 | Nucleus | Transcription regulator | Body |
| 31 | SLC1A4 | Solute carrier family 1 (glutamate/neutral amino acid transporter), member 4 | 3.807 | Plasma membrane | Transporter | Body |
| 32 | ZFAND3 | Zinc finger, AN1-type domain 3 | 3.717 | Other | Other | Body |
| 33 | C1orf162 | Chromosome 1 open reading frame 162 | 3.703 | Other | Transporter | Promoter |
| 34 | C9orf131 | Chromosome 9 open reading frame 131 | 3.703 | Other | Other | Body |
| 35 | CRYZ | Crystallin, zeta (quinone reductase) | 3.703 | Cytoplasm | Enzyme | Body |
| 36 | CYP2A6 | Cytochrome P450, family 2, subfamily A, polypeptide 6 | 3.703 | Cytoplasm | Enzyme | Body |
| 37 | CYP51A1 | Cytochrome P450, family 51, subfamily A, polypeptide 1 | 3.703 | Cytoplasm | Enzyme | Downstream |
| 38 | DSPP | Dentin sialophosphoprotein | 3.703 | Extracellular space | Other | Promoter |
| 39 | GALNT3 | Polypeptide N-acetylgalactosaminyltransferase 3 | 3.703 | Cytoplasm | Enzyme | Downstream |
| 40 | Gm4836 | Predicted gene 4836 | 3.703 | Nucleus | Other | Downstream |
| 41 | GRIP1 | Glutamate receptor-interacting protein 1 | 3.703 | Plasma membrane | Transcription regulator | Promoter |
| 42 | GUCY1A2 | Guanylate cyclase 1, soluble, alpha 2 | 3.703 | Cytoplasm | Enzyme | Body |
| 43 | HNMT | Histamine N-methyltransferase | 3.703 | Cytoplasm | Enzyme | Body |
| 44 | LRRC8B | Leucine-rich repeat containing 8 family, member B | 3.703 | Other | Other | Body |
| 45 | MEF2A | Myocyte enhancer factor 2A | 3.703 | Nucleus | Transcription regulator | Body |
| 46 | NRG3 | Neuregulin 3 | 3.703 | Extracellular space | Growth factor | Promoter |
| 47 | PCDH17 | Protocadherin 17 | 3.703 | Other | Other | Promoter |
| 48 | PDP2 | Pyruvate dehydrogenase phosphatase catalytic subunit 2 | 3.703 | Cytoplasm | Phosphatase | Promoter |
| 49 | SH2D4B | SH2 domain containing 4B | 3.703 | Other | Other | Body |
| 50 | Smok2b | Sperm motility kinase 2B | 3.703 | Other | Kinase | Body |
Table 4.
Top 50 annotated genes with decreased methylation, ranked by log2-fold change
| Rank | Symbol | Gene name | Log2 fold change (TRAMP/WT) | Location | Type(s) | Methylation region |
|---|---|---|---|---|---|---|
| 1 | Rrbp1 | Ribosome-binding protein 1 | − 5.824 | Cytoplasm | Transporter | Body |
| 2 | CISD2 | CDGSH iron sulfur domain 2 | − 4.373 | Cytoplasm | Other | Downstream |
| 3 | NR4A1 | Nuclear receptor subfamily 4, group A, member 1 | − 4.324 | Nucleus | Ligand-dependent nuclear receptor | Body |
| 4 | LCMT1 | Leucine carboxyl methyltransferase 1 | − 4.051 | Cytoplasm | Enzyme | Body |
| 5 | XRCC6BP1 | XRCC6 binding protein 1 | − 3.990 | Other | Kinase | Downstream |
| 6 | TTR | Transthyretin | − 3.926 | Extracellular space | Transporter | Promoter |
| 7 | ZNF536 | Zinc finger protein 536 | − 3.859 | Other | Other | Downstream |
| 8 | FARP1 | FERM, RhoGEF (ARHGEF) and pleckstrin domain protein 1 (chondrocyte-derived) | − 3.788 | Plasma membrane | Other | Body |
| 9 | TNRC18 | Trinucleotide repeat containing 18 | − 3.788 | Other | Other | Body |
| 10 | FOXL1 | Forkhead box L1 | − 3.714 | Nucleus | Transcription regulator | Downstream |
| 11 | ZMAT4 | Zinc finger, matrin-type 4 | − 3.714 | Nucleus | Other | Promoter |
| 12 | ABCC2 | ATP-binding cassette, sub-family C (CFTR/MRP), member 2 | − 3.636 | Plasma membrane | Transporter | Body |
| 13 | AMFR | Autocrine motility factor receptor, E3 ubiquitin protein ligase | − 3.636 | Plasma membrane | Transmembrane receptor | Downstream |
| 14 | ARSK | Arylsulfatase family, member K | − 3.636 | Extracellular space | enzyme | Body |
| 15 | GRM3 | Glutamate receptor, metabotropic 3 | − 3.636 | Plasma membrane | G-protein coupled receptor | Promoter |
| 16 | HTR1F | 5-hydroxytryptamine (serotonin) receptor 1F, G protein-coupled | − 3.636 | Plasma membrane | G-protein coupled receptor | Body |
| 17 | CC2D2A | Coiled-coil and C2 domain containing 2A | − 3.554 | Other | Other | Promoter |
| 18 | CSMD1 | CUB and Sushi multiple domains 1 | − 3.554 | Plasma membrane | Other | Body |
| 19 | HIBCH | 3-Hydroxyisobutyryl-CoA hydrolase | − 3.554 | Cytoplasm | Enzyme | Body |
| 20 | NMT2 | N-Myristoyltransferase 2 | − 3.554 | Cytoplasm | Enzyme | Promoter |
| 21 | PCDH20 | Protocadherin 20 | − 3.554 | Other | Other | Promoter |
| 22 | PDCD1 | Programmed cell death 1 | − 3.554 | Plasma membrane | Phosphatase | Promoter |
| 23 | QRFP | Pyroglutamylated RFamide peptide | − 3.554 | Extracellular space | Other | Downstream |
| 24 | REG3G | Regenerating islet-derived 3 gamma | − 3.554 | Extracellular space | Other | Downstream |
| 25 | TLR4 | Toll-like receptor 4 | − 3.554 | Plasma membrane | Transmembrane receptor | Downstream |
| 26 | TNRC6B | Trinucleotide repeat containing 6B | − 3.554 | Other | Other | Body |
| 27 | CCR3 | Chemokine (C–C motif) receptor 3 | − 3.466 | Plasma membrane | G-protein coupled receptor | Promoter |
| 28 | Cngb1 | Cyclic nucleotide gated channel beta 1 | − 3.466 | Other | Other | Body |
| 29 | CNTNAP5 | Contactin associated protein-like 5 | − 3.466 | Other | Other | Body |
| 30 | Cox7c | Cytochrome c oxidase subunit VIIc | − 3.466 | Cytoplasm | Other | Promoter |
| 31 | EIF4EBP1 | Eukaryotic translation initiation Factor 4E binding protein 1 | − 3.466 | Cytoplasm | Translation regulator | Downstream |
| 32 | FGF10 | Fibroblast growth factor 10 | − 3.466 | Extracellular space | Growth factor | Downstream |
| 33 | GNAI1 | Guanine nucleotide-binding protein (G protein), alpha inhibiting activity polypeptide 1 | − 3.466 | Plasma membrane | Enzyme | Promoter |
| 34 | Ins1 | Insulin I | − 3.466 | Extracellular space | Other | Promoter |
| 35 | ITGA8 | Integrin, alpha 8 | − 3.466 | Plasma membrane | Other | Body |
| 36 | JAG1 | Jagged 1 | − 3.466 | Extracellular space | Growth factor | Promoter |
| 37 | Pcdh10 | Protocadherin 10 | − 3.466 | Other | Other | Promoter |
| 38 | PPP1R17 | Protein phosphatase 1, regulatory subunit 17 | − 3.466 | Cytoplasm | Other | Downstream |
| 39 | Serbp1 | Serpine1 mRNA-binding protein 1 | − 3.466 | Cytoplasm | Other | Promoter |
| 40 | Wasl | Wiskott-Aldrich syndrome-like (human) | − 3.466 | Cytoplasm | Other | Promoter |
| 41 | ABAT | 4-Aminobutyrate aminotransferase | − 3.373 | Cytoplasm | Enzyme | Body |
| 42 | ANKMY2 | Ankyrin repeat and MYND domain containing 2 | − 3.373 | Plasma membrane | Other | Downstream |
| 43 | Card11 | Caspase recruitment domain family, member 11 | − 3.373 | Other | Other | Body |
| 44 | CDK5R1 | Cyclin-dependent kinase 5, regulatory subunit 1 (p35) | − 3.373 | Nucleus | Kinase | Downstream |
| 45 | DACH1 | Dachshund family transcription factor 1 | − 3.373 | Nucleus | Transcription regulator | Downstream |
| 46 | FGGY | FGGY carbohydrate kinase domain containing | − 3.373 | Other | Other | Body |
| 47 | GADD45G | Growth arrest and DNA-damage-inducible, gamma | − 3.373 | Nucleus | Other | Downstream |
| 48 | GLRB | Glycine receptor, beta | − 3.373 | Plasma membrane | Ion channel | Body |
| 49 | LRRTM1 | Leucine-rich repeat transmembrane neuronal 1 | − 3.373 | Plasma membrane | Other | Downstream |
| 50 | NEDD4L | Neural precursor cell expressed, developmentally down-regulated 4-like, E3 ubiquitin protein ligase | − 3.373 | Cytoplasm | Enzyme | Body |
Fig. 2.
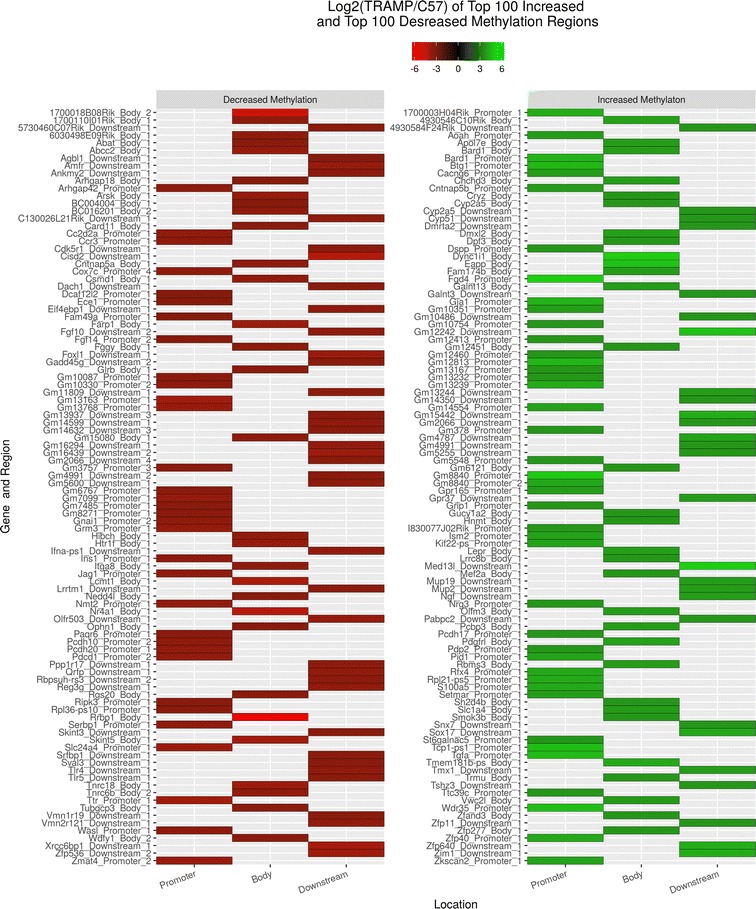
Heat-map of top 100 decreased or increased (log2-fold change) methylated genes comparing with TRAMP to WT in different regions by MeDIP analysis, ranked by alphabetic
Four genes of interest, DYNC1I1, SLC1A4, XRCC6BP1 and TTR were analyzed by IGV (Fig. 3), which provides more in-depth understanding of these differences between TRAMP and control mice. The IGV results are in accordance with the MeDIP-seq finding. In TRAMP mice, the methylation ratio of DYNC1I1 and SLC1A4 were increased, whereas the methylation ratio of TTR and XRCC6BP1 were decreased. The methylation results have been validated by MSP.
Fig. 3.
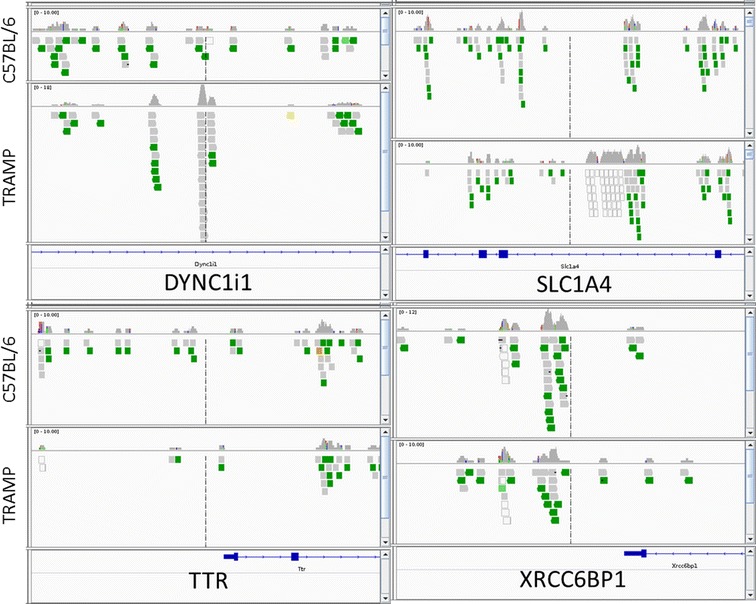
integrative genomics viewer visualization of the aligned reads’ distribution against reference genome for four targeted genes: DYNC1i1, SLC1A4, TTR and XRCC6BP1
These results demonstrate a fundamental difference in the global pattern of gene methylation between the TRAMP prostate tumor and control prostate tissue. The potential impact of this difference was further assessed using IPA by analyzing the canonical pathways, diseases and functions, and networks related to these methylation changes.
MeDIP-seq data validation by MSP
According to the MeDIP-seq results, four interesting genes, two with increased methylation (TRAMP vs WT), DYNC1I1 and SLC1A4, and two with decreased methylation (TRAMP vs WT), XRCC6BP1 and TTR were selected to carry out MSP to validate the MeDIP-seq data. MSP results indicated a similar trend in agreement with the MeDIP-seq results.
The results showed, in Dync1i1 and Slc1a4 genes, the relative density of M-MSP (methylated MSP) to that of U-MSP (unmethylated MSP) in TRAMP group were increased, which indicated that the CpG sites of these genes were hypermethylated in TRAMP mice (Fig. 4). Similarly, in Xrcc6bp1 and TTR, the relative density of M-MSP to that of U-MSP in TRAMP group was decreased, which indicated that the CpG sites of these genes were hypomethylated in TRAMP mice (Fig. 4).
Fig. 4.
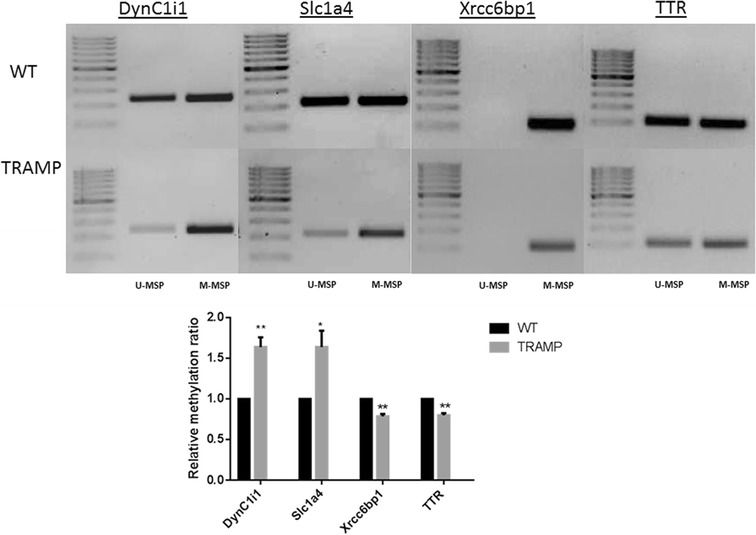
Medip-Seq Validation by methylation-specific PCR (MSP). Representative electrophoretogram is presented in the top panel. M-MSP: methylated reaction of MSP, U-MSP: unmethylated reaction of MSP. The relative intensity of the methylated and unmethylated band was measured by ImageJ and presented in the bottom panel. All of the data are presented as the mean ± SD. *p < 0.05 vs the control WT group
qPCR validation of selected gene expression
When mRNA levels were measured by qPCR, the relative expression levels of CRYZ, DYNC1I1, HNMT, SLC1A4 and TTR in TRAMP group were 0.62, 1.90, 0.15, 0.15 and 9.05 fold compared with WT (Fig. 5). Among these, TTR expression was increased by 9.05-fold over WT, which agreed with results reported by Wang et al. [31] that expression levels of TTR were significantly higher in prostate cancer tissue than in normal and benign prostate hyperplasia tissue. When comparing mRNA expression and Methylation validation results, reciprocal relationships were found in TTR in TRAMP, which indicated decreased methylation in promoter region but increased gene expression when comparing with WT. In contrast, DNA methylation in the gene body or downstream may or may not follow a reciprocal relationship with gene expression as described in the findings of Jiang et al. [32]. It is expected that individual genes may be differentially affected by CpG methylation and that only global analysis would be expected to reveal overall patterns likely to emerge.
Fig. 5.
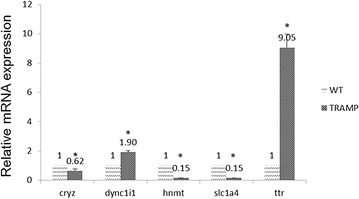
Comparison of mRNA expression of CRYZ, DYNC1I1, HNMT, SLC1A4 and TTR among WT and TRAMP mice prostate samples. Total mRNA was isolated and analyzed using quantitative real-time PCR. The data are presented as the mean ± SD of three independent experiments. *p < 0.05 vs the control WT group
Canonical pathway, diseases and functions and network analyses by IPA
The 2147 genes with remarkable change in methylation (log2-fold change ≥ 2) were analyzed using the IPA software package. When using IPA, canonical pathways, which are based on the literature and are generated prior to data input, are the default settings. These pathways do not change upon data input and have a directionality-linked list of interconnected nodes. By contrast, networks are generated de novo based upon input data, lack directionality and contain molecules that are involved in a variety of canonical pathways.
The genes within the canonical pathways were ranked by the possibility parameter, i.e., the –log10(p) value in the corresponding pathway, and are presented in Table 5. The CREB1 gene, which is involved the neuropathic pain signaling pathway, was ranked first. The top networks ranked based on their ratios of methylated gene/total gene are listed in Table 6. Of the networks, HDAC2-related, tissue morphology, embryonic development, and organ development network was ranked first (Table 6). Among the networks, the cancer-related networks accounted for the majority (15/25) (Table 6), which indicates that the great difference between the TRAMP and control lies in organ development and cancer development.
Table 5.
Top ten altered canonical pathways, sorted by − log10 (p) value via IPA
| Pathways | − Log10 (p value) | Involved molecules |
|---|---|---|
| Neuropathic pain signaling in dorsal horn neurons | 3.01 | TACR1, GRM7, KCNN3, CAMK1D, MAPK1, GPR37, BDNF, GRM3, GRIA1, CREB1, TAC1, GRIN3A |
| Cardiomyocyte differentiation via BMP receptors | 3.01 | NKX2-5, MAP3K7, SMAD6, MEF2C, BMP10 |
| cAMP-mediated signaling | 2.75 | ENPP6, ADCY2, RGS18, MAPK1, CAMK1D, PTGER3, GRM3, DUSP6, GNAI1, CHRM3, Cngb1, GRM7, FSHR, RGS10, CREB1, HTR1F, DRD3, PTGER4, PPP3CA |
| Estrogen biosynthesis | 2.64 | CYP4F8, CYP3A5, HSD17B7, CYP2C9, CYP2A6 (includes others), CYP51A1, CYP2C8 |
| PXR/RXR activation | 2.63 | CYP3A5, ABCC2, INS, CYP2C9, CYP2A6 (includes others), INSR, PAPSS2, Ins1, CYP2C8 |
| Wnt/β-catenin signaling | 2.43 | CDKN2A, GJA1, WNT3, APPL2, APC, SOX17, SOX2, FZD8, PPP2R1A, WNT7A, RARB, TLE4, MAP3K7, NR5A2, GSK3B |
| BMP signaling pathway | 2.43 | MAP2K4, NKX2-5, MAPK1, BMP8A, CREB1, MAP3K7, SMAD6, GREM1, BMP10 |
| Factors promoting cardiogenesis in vertebrates | 2.41 | FZD8, SMAD2, NKX2-5, WNT3, BMP8A, MAP3K7, MEF2C, GSK3B, BMP10, APC |
| Glutamate receptor signaling | 2.40 | GRM7, SLC1A4, GRM3, GRIA1, SLC38A1, GRIP1, GRIK2, GRIN3A |
| Human embryonic stem cell pluripotency | 2.39 | SOX2, FZD8, SMAD2, WNT7A, WNT3, BDNF, BMP8A, SMAD6, GSK3B, NGF, APC, INHBA, BMP10 |
| LPS/IL-1 mediated inhibition of RXR function | 2.37 | MAP2K4, GAL3ST2, ABCC2, CYP2C9, APOC2, NDST4, PAPSS2, IL1R2, TLR4, UST, CYP3A5, Sult1c2 (includes others), MAP3K7, NR5A2, CYP2A6 (includes others), GSTP1, MAOA, CYP2C8 |
Table 6.
Top networks analyzed by IPA
| Rank | Top diseases and functions | Score |
|---|---|---|
| 1 | Tissue morphology, embryonic development, organ development | 38 |
| 2 | Cell-to-cell signaling and interaction, cell signaling, cellular function and maintenance | 38 |
| 3 | Cell death and survival, cancer, cell morphology | 37 |
| 4 | Cancer, gastrointestinal disease, cell death and survival | 35 |
| 5 | Cancer, carbohydrate metabolism, small molecule biochemistry | 33 |
| 6 | Cancer, cell death and survival, cellular response to therapeutics | 33 |
| 7 | Lymphoid tissue structure and development, organ morphology, organismal development | 30 |
| 8 | Cancer, gastrointestinal disease, post-translational modification | 29 |
| 9 | Cancer, dermatological diseases and conditions, gastrointestinal disease | 29 |
| 10 | Cell morphology, digestive system development and function, nervous system development and function | 28 |
| 11 | Cancer, gastrointestinal disease, cell death and survival | 26 |
| 12 | Cancer, drug metabolism, energy production | 26 |
| 13 | Cell-to-cell signaling and interaction, nervous system development and function, cellular development | 26 |
| 14 | Cellular movement, cellular development, skeletal and muscular system development and function | 24 |
| 15 | Cell death and survival, cancer, cellular development | 24 |
| 16 | Hereditary disorder, inflammatory response, metabolic Disease | 22 |
| 17 | Cell morphology, nervous system development and function, tissue morphology | 21 |
| 18 | Cancer, organismal injury and abnormalities, reproductive system disease | 21 |
| 19 | Cellular compromise, cancer, cardiovascular disease | 19 |
| 20 | Cell-to-cell signaling and interaction, tissue development, hematological system development and function | 17 |
| 21 | Cancer, organismal survival, organismal injury and abnormalities | 16 |
| 22 | Cellular assembly and organization, cellular function and maintenance, embryonic development | 16 |
| 23 | Cancer, organismal injury and abnormalities, reproductive system disease | 16 |
| 24 | Cell cycle, cellular movement, cancer | 16 |
| 25 | Cancer, developmental disorder, hereditary disorder | 16 |
Diseases and functions refer to the most likely linked diseases or functions based on statistics. Similar to the network analysis, for the most associated disease based on the ranking of − log10p, cancer, gastrointestinal disease, organismal abnormalities, reproductive system disease and dermatological diseases were ranked within the top five (Fig. 6a). Of all cancer subtypes, adenocarcinoma ranked first (Fig. 6b), which was consistent with the TRAMP model, which is a model for prostate adenocarcinoma.
Fig. 6.
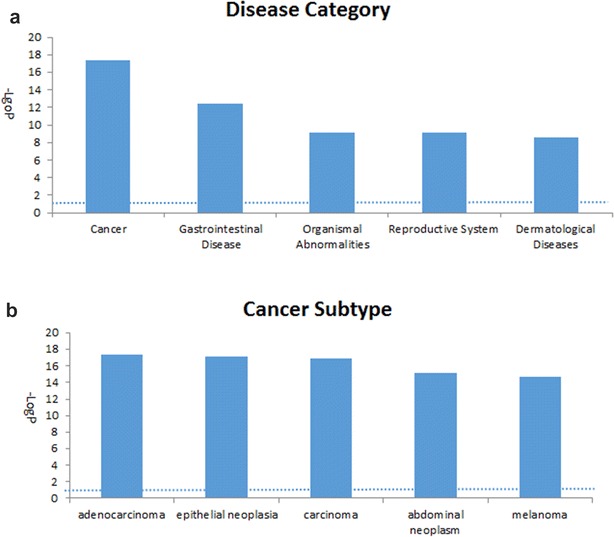
Top five associated disease categories (a) and top five cancer subtypes (b) analyzed by IPA
Discussion
Analysis of canonical pathway would provide further understanding of disease and information for the development of new therapeutic targets
As shown in Fig. 7, the genes with significantly altered methylation in the top canonical pathway was the neuropathic pain signaling pathway, as mapped by IPA. This finding is consistent with Chiaverotti’s finding indicating that the most common malignancy in TRAMP is of neuroendocrine origin [33]. Table 7 lists the genes involved in this pathway that exhibited modified methylation. Among these, methylation of the CREB1 gene was found to be decreased by 2.274-fold (log2) by MeDIP-seq in TRAMP.
Fig. 7.
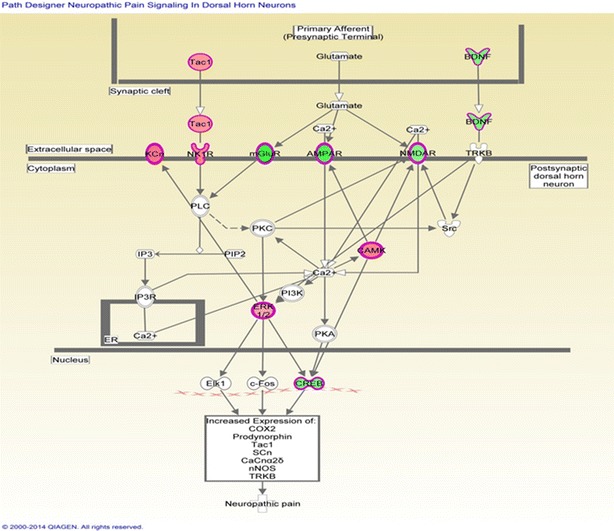
Genes mapped to the canonical neuropathic pain signaling pathway by IPA. Red, increased methylation; green, decreased methylation (for interpretation of the references to color in the figure legend, please refer to the online version of this article)
Table 7.
Altered methylation genes mapped to the neuropathic pain signaling pathway by IPA
| Symbol | Gene name | Log2-fold change | Type(s) |
|---|---|---|---|
| GRM3 | Glutamate receptor, metabotropic 3 | − 3.636 | G-protein-coupled receptor |
| GRIA1 | Glutamate receptor, ionotropic, AMPA 1 | − 3.167 | Ion channel |
| BDNF | Brain-derived neurotrophic factor | − 2.373 | Growth factor |
| CREB1 | cAMP-responsive element-binding protein 1 | − 2.274 | Transcription regulator |
| GRM7 | Glutamate receptor, metabotropic 7 | − 2.274 | G-protein-coupled receptor |
| GRIN3A | Glutamate receptor, ionotropic, N-methyl-D-aspartate 3A | − 2.129 | Ion channel |
| MAPK1 | Mitogen-activated protein kinase 1 | 2.048 | Kinase |
| TAC1 | Tachykinin, precursor 1 | 2.408 | Other |
| CAMK1D | Calcium/calmodulin-dependent protein kinase ID | 2.855 | Kinase |
| TACR1 | Tachykinin receptor 1 | 2.855 | G-protein-coupled receptor |
| KCNN3 | Potassium intermediate/small conductance calcium-activated channel, subfamily N, member 3 | 3.119 | Ion channel |
| GPR37 | G protein-coupled receptor 37 (endothelin receptor type B-like) | 3.855 | G-protein-coupled receptor |
CREB was first found to be closely related to cellular proliferation, differentiation and adaptive responses in the neuronal system [34, 35]. Subsequently, increasing evidence revealed that CREB is directly involved in the oncogenesis of a variety of cancers by regulating the immortalization and transformation of cancer cells [36, 37].
CREB is also found to modulate other carcinogenesis pathways. S100 calcium binding protein P (S100P) is a calcium-binding protein that is associated with cancer, and functional analysis of the S100P promoter identified SMAD, signal transducer and activator of transcription (STAT)/CREB and SP/KLF binding sites as key regulatory elements in the transcriptional activation of the S100P gene in cancer cells [38]. Homo sapiens lactate dehydrogenase c (hLdhc) was reported to be expressed in a wide spectrum of tumors, including prostate cancers, and this expression was shown to be regulated by transcription factor Sp1 and CREB as well as promoter CpG island (CGI) methylation [39, 40]. Decreased prostate tumorigenicity was found to be correlated with decreased expression of CREB and its targets, including Bcl-2 and cyclin A1.
Clinically, upregulation of CREB was found in various human cancer samples including prostate cancer, breast cancer, non-small-cell lung cancer and acute leukemia, whereas down-regulation of this gene manifested inhibition of some cancer cells [41].
All of these data indicate that CREB is highly associated with cancer therapy. Our study demonstrated that CREB gene methylation is significantly decreased in the TRAMP model, which suggests a new approach to prostate cancer prevention and therapy.
Novel networks involving the methylation of target genes could provide new insights for prostate cancer
Compared with the canonical pathways, networks are generated de novo based upon input data and are able to more flexibly reveal the interactions of altered genes and functions. As it is impossible to analyze all networks listed in Table 6, four interesting networks were elaborated below (the higher the score is, the more genes with altered methylation are involved in the network). Among all these networks, many genes are known to be highly associated with tumor onset and progression, however, our insight into their methylation status alteration would reveal novel biomarkers for prostate tumorigenesis.
HDAC2-related network (score = 38)
The top network identified by IPA, was the HDAC2-related tissue morphology, embryonic development and organ development network (Table 6, Fig. 8a). In this network, the HDAC2 gene, a key member of HDAC, exhibited 3.274-fold (log2) decreased methylation in TRAMP. HDACs are responsible for the removal of acetyl groups from histones and play important roles in modulating the epigenetic process by influencing the expression of genes encoded by DNA bound to a histone molecule [42]. HDAC inhibitors have also been shown to reduce colonic inflammation [43], inhibit cell proliferation, and stimulate apoptosis, and these inhibitors represent a novel class of therapeutic agents with antitumor activity that are currently in clinical development [44, 45]. By upregulating histone H3 acetylation and p21 gene expression, long-term treatment with MS-275, an HDAC inhibitor, attenuated the progression of prostate cancer in vitro and in vivo [46]. Another HDAC inhibitor, OSU-HDAC42, also showed a chemoprevention effect on prostate tumor progression in the TRAMP model [47]. Our data suggest that the altered methylation of HDAC (3.274 log2-fold decrease) might be a novel, interesting target for prostate cancer treatment. Based on our MeDIP-seq results, HNMT in this network was increased by 3.703-fold (log2). In addition, based on our qPCR analysis, HNMT gene expression was reduced by 6.67-fold, which supports the likelihood of a role of HNMT in prostate cancer. However, although HNMT has been demonstrated to be associated with breast cancer [48] and liver cancer [49], little is known about its potential role in prostate cancer, making it another potential novel marker.
Fig. 8.
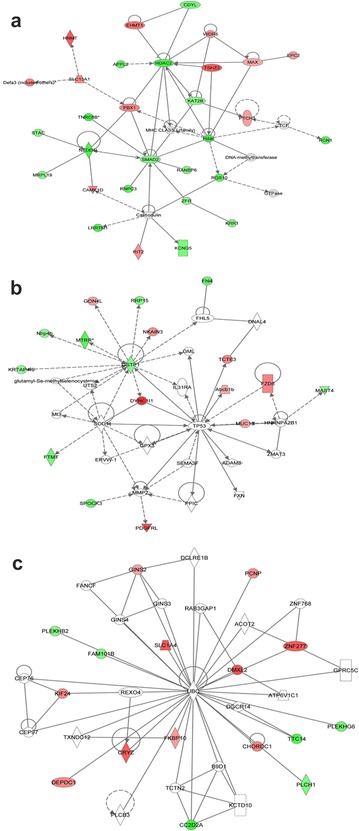
HDAC2 network (score = 38) (a), GSTP1 network (score = 16) (b), and UBC network (score = 16) (c), as determined by IPA. Red, increased methylation; green, decreased methylation (for interpretation of the references to color in the figure legend, please refer to the online version of this article)
GSTP1-related network (score = 16)
GSTP1 expression is inactivated in prostate cancers [50–52], and this inactivation is associated with hypermethylation of GSTP1 CpG islands [51, 52]. Clinically, higher GSTP1 promoter methylation was found to be independently associated with the risk of prostate cancer [53]; therefore, the detection of hypermethylated GSTP1 in urine and semen samples can be a diagnostic marker of prostate cancer [54]. We also found that methylation of GSTP1 was an important factor involved in prostate cancer development. Interestingly, based on our data, the methylation of the GSTP1 gene was decreased 2.274-fold (log2) in TRAMP. Figure 8b demonstrates the decreased methylation of GSTP1. Based on comparisons of prostate samples from TRAMP and strain-matched WT mice, Mavis et al. [20] showed that promoter DNA hypermethylation does not appear to drive GST gene repression in TRAMP primary tumors. The above results support our finding that the methylation status of GSTP1 may differ in humans. DYNC1I1, which was also in the network, exhibited a 4.926-fold (log2) increase in methylation. In qPCR analysis, it indicates a 1.9-fold increase in gene expression. Although DYNC1I1 is significantly up-regulated in liver tumors [55] but not in prostate tumors, our findings suggest that it may be the next useful prostate cancer biomarker.
UBC-related network (score = 16)
Another interesting network was found surrounding the UBC gene (Fig. 8c); however, UBC itself was not identified by MeDIP-seq. The methylation of solute carrier family 1 member 4 (SLC1A4) and CRYZ was highly up-regulated (3.807 and 3.703 log2-fold increased, respectively). According to qPCR results, the expressions of SLC1A4 and CRYZ in TRAMP group were only 0.15- and 0.62-fold of WT group. SLC1A4 was found to be associated with human hepatocellular carcinoma [56], and CRYZ was proven to be involved in B-cell lymphoma 2 (BCL-2) overexpression in T-cell acute lymphocytic leukemia [57]. Although an association with prostate cancer was not found, our MeDIP–seq findings in the TRAMP model suggest that this association is possible.
Merged networks overlaid with IPA settings could even predict the direction of the relationship
When merging the two interesting networks HDAC2 and GSTP1 and overlaying the molecular activity predictor of IPA (Fig. 9), tumor protein 53 (TP53) was found to be located in the center of the novel network, indicating the potential important modulating function of TP53 on HDAC2 and GSTP1. TP53 is encoded by p53, a tumor suppressor gene located on chromosome 17p13, which is one of the most frequently mutated genes in multiple cancers [58–60]. TP53 acts as a transcription factor that mediates the response to various cellular stresses, most importantly, the DNA damage response [61]. TP53 has also been proven to play a crucial role in prostate cancer development and progression [62–64].
Fig. 9.
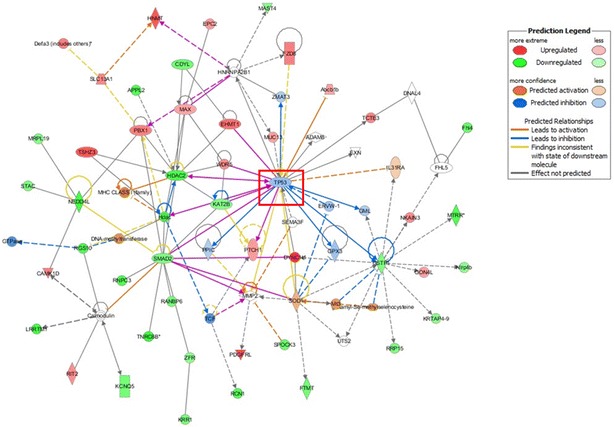
Merged network of the HDAC2 and GSTP1 networks, as determined by IPA. Red, increased methylation; green, decreased methylation (for interpretation of the references to color in the figure legend, please refer to the online version of this article)
The interactions between GSTP1, HDAC and TP53 have been studied in prostate disease models. In prostatectomy specimens of 30 benign prostatic hyperplasia patients, the increase in TP53 expression at the same site was accompanied by an increase in GSTP1 expression [65]. In the 3 human prostate cancer cell lines DU-145, PC-3 and LNCaP, As2O3 was found to increase TP53 expression only in LNCap cells (without GSTP1 expression) but not in DU-145 and PC-3 cells (both cells expressed GSTP1) [66]. In LNCaP cells, the acetylation of human TP53 increased the binding of promoter fragments of the human P21 gene that contained a p53 response element and of the human HDAC2 protein [67].
Although the relationships between TP53 and HDAC2 as well as GSTP1 in prostate cancer have been elucidated, these relationships in the TRAMP model remain unknown. Our predicated interactions among these proteins in TRAMP suggest the possibility that TP53 influences the methylation of GSTP1 and HDAC2, which is a potential direction of future research.
Conclusions
To the best of our knowledge, this is the first MeDIP-seq study to analyze the DNA methylation differences of prostate cancer by comparing TRAMP mice, an adenocarcinoma prostate cancer model, with wild-type C57BL/6 mice. Cancer, especially adenocarcinoma, is the most commonly associated disease. MSP and qPCR have been used to validate the findings of MeDIP-seq. Using this MeDIP-seq and IPA analysis, comparisons between the TRAMP and control samples reveal profound differences in gene methylation. The analysis of canonical pathways and networks has identified important biological functions and molecular pathways that may mediate the development of adenocarcinoma prostate cancer. CREB-, HDAC2-, GSTP1- and UBC-related pathways showed significantly altered methylation profiles based on the canonical pathway and network analyses. Studies on epigenetics, such as DNA methylation, suggest novel avenues and strategies for the further development of biomarkers targeted for treatment and prevention approaches for prostate cancer.
Authors’ contributions
WL designed the experiments. WL, YH and DS performed the experiments and acquired the data. All authors prepared the manuscript. All authors read and approved the final manuscript.
Acknowledgements
The authors express sincere gratitude to all of the members of Dr. Tony Kong’s laboratory for their helpful discussions.
Competing interests
The authors declare that they have no competing interests.
Availability of data and materials
The data is freely shared and available for other investigators who need to use them.
Consent for publication
Not applicable.
Ethics approval and consent to participate
Animal care and use in this study was performed in accordance with Rutgers University Institutional Animal Care and Use Committee (IACUC) standards (Approval Number 01-016).
Funding
This work was supported in part by institutional funds and by R01-AT009152 from the National Center for Complementary and Integrative Health (NCCIH).
Publisher’s Note
Springer Nature remains neutral with regard to jurisdictional claims in published maps and institutional affiliations.
Abbreviations
- TRAMP
transgenic adenocarcinoma of the mouse prostate
- MeDIP
methylated DNA immunoprecipitation
- IPA
Ingenuity® Pathway Analysis
- CREB1
cyclic AMP (cAMP) response element-binding protein 1
- HDAC2
histone deacetyltransferase 2
- GSTP1
glutathione S-transferase 1
- UBC
polyubiquitin-C
- NRF2
nuclear factor (erythroid-derived 2)-like 2
- MGMT
O6-alkylguanine DNA alkyltransferase
- KLF6
Krueppel-like factor 6
- DYNC1I1
dynein cytoplasmic 1 intermediate chain 1
- SLC1A4
solute carrier family 1 member 4
- Xrcc6bp1
XRCC6-binding protein 1
- TTR
transthyretin
- HNMT
histamine N-methyltransferase
- CRYZ
crystallin zeta
Footnotes
Wenji Li and Ying Huang equally contributed to this work
Contributor Information
Wenji Li, Email: wl365@scarletmail.rutgers.edu.
Ying Huang, Email: huangyingms@gmail.com.
Davit Sargsyan, Email: sargdavid@gmail.com.
Tin Oo Khor, Email: t2khor@gmail.com.
Yue Guo, Email: guoyue1990@gmail.com.
Limin Shu, Email: lmnshu@gmail.com.
Anne Yuqing Yang, Email: anney2011@gmail.com.
Chengyue Zhang, Email: chengyue.zhang@gmail.com.
Ximena Paredes-Gonzalez, Email: xiparedes@gmail.com.
Michael Verzi, Email: Verzi@dls.rutgers.edu.
Ronald P. Hart, Email: rhart@rutgers.edu
Ah-Ng Kong, Phone: 848-445-6369/8, Email: kongt@pharmacy.rutgers.edu.
References
- 1.Ferlay J, Shin HR, Bray F, Forman D, Mathers C, Parkin DM. Estimates of worldwide burden of cancer in 2008: GLOBOCAN 2008. Int J Cancer. 2010;127:2893–2917. doi: 10.1002/ijc.25516. [DOI] [PubMed] [Google Scholar]
- 2.U.S. Cancer Statistics Working Group. United States Cancer Statistics: 1999–2014 Incidence and Mortality Web-based Report. Atlanta: U.S. Department of Health and Human Services, Centers for Disease Control and Prevention and National Cancer Institute; 2017. http://www.cdc.gov/uscs. Accessed 9 Jan 2018.
- 3.Barbieri CE, Bangma CH, Bjartell A, Catto JW, Culig Z, Gronberg H, Luo J, Visakorpi T, Rubin MA. The mutational landscape of prostate cancer. Eur Urol. 2013;64:567–576. doi: 10.1016/j.eururo.2013.05.029. [DOI] [PMC free article] [PubMed] [Google Scholar]
- 4.Cuzick J, Thorat MA, Andriole G, Brawley OW, Brown PH, Culig Z, Eeles RA, Ford LG, Hamdy FC, Holmberg L, et al. Prevention and early detection of prostate cancer. Lancet Oncol. 2014;15:e484–e492. doi: 10.1016/S1470-2045(14)70211-6. [DOI] [PMC free article] [PubMed] [Google Scholar]
- 5.Strand SH, Orntoft TF, Sorensen KD. Prognostic DNA methylation markers for prostate cancer. Int J Mol Sci. 2014;15:16544–16576. doi: 10.3390/ijms150916544. [DOI] [PMC free article] [PubMed] [Google Scholar]
- 6.Matei DE, Nephew KP. Epigenetic therapies for chemoresensitization of epithelial ovarian cancer. Gynecol Oncol. 2010;116:195–201. doi: 10.1016/j.ygyno.2009.09.043. [DOI] [PMC free article] [PubMed] [Google Scholar]
- 7.Jeong M, Goodell MA. New answers to old questions from genome-wide maps of DNA methylation in hematopoietic cells. Exp Hematol. 2014;42:609–617. doi: 10.1016/j.exphem.2014.04.008. [DOI] [PMC free article] [PubMed] [Google Scholar]
- 8.Ushijima T, Watanabe N, Okochi E, Kaneda A, Sugimura T, Miyamoto K. Fidelity of the methylation pattern and its variation in the genome. Genome Res. 2003;13:868–874. doi: 10.1101/gr.969603. [DOI] [PMC free article] [PubMed] [Google Scholar]
- 9.Gama-Sosa MA, Slagel VA, Trewyn RW, Oxenhandler R, Kuo KC, Gehrke CW, Ehrlich M. The 5-methylcytosine content of DNA from human tumors. Nucleic Acids Res. 1983;11:6883–6894. doi: 10.1093/nar/11.19.6883. [DOI] [PMC free article] [PubMed] [Google Scholar]
- 10.Brothman AR, Swanson G, Maxwell TM, Cui J, Murphy KJ, Herrick J, Speights VO, Isaac J, Rohr LR. Global hypomethylation is common in prostate cancer cells: a quantitative predictor for clinical outcome? Cancer Genet Cytogenet. 2005;156:31–36. doi: 10.1016/j.cancergencyto.2004.04.004. [DOI] [PubMed] [Google Scholar]
- 11.Seifert HH, Schmiemann V, Mueller M, Kazimirek M, Onofre F, Neuhausen A, Florl AR, Ackermann R, Boecking A, Schulz WA, Grote HJ. In situ detection of global DNA hypomethylation in exfoliative urine cytology of patients with suspected bladder cancer. Exp Mol Pathol. 2007;82:292–297. doi: 10.1016/j.yexmp.2006.08.002. [DOI] [PubMed] [Google Scholar]
- 12.Issa JP. CpG island methylator phenotype in cancer. Nat Rev Cancer. 2004;4:988–993. doi: 10.1038/nrc1507. [DOI] [PubMed] [Google Scholar]
- 13.Shaw RJ, Hall GL, Lowe D, Bowers NL, Liloglou T, Field JK, Woolgar JA, Risk JM. CpG island methylation phenotype (CIMP) in oral cancer: associated with a marked inflammatory response and less aggressive tumour biology. Oral Oncol. 2007;43:878–886. doi: 10.1016/j.oraloncology.2006.10.006. [DOI] [PubMed] [Google Scholar]
- 14.Nazemalhosseini Mojarad E, Kuppen PJ, Aghdaei HA, Zali MR. The CpG island methylator phenotype (CIMP) in colorectal cancer. Gastroenterol Hepatol Bed Bench. 2013;6:120–128. [PMC free article] [PubMed] [Google Scholar]
- 15.Berg M, Hagland HR, Soreide K. Comparison of CpG island methylator phenotype (CIMP) frequency in colon cancer using different probe- and gene-specific scoring alternatives on recommended multi-gene panels. PLoS ONE. 2014;9:e86657. doi: 10.1371/journal.pone.0086657. [DOI] [PMC free article] [PubMed] [Google Scholar]
- 16.Hurwitz AA, Foster BA, Allison JP, Greenberg NM, Kwon ED: The TRAMP mouse as a model for prostate cancer. Curr Protoc Immunol 2001, Chapter 20:Unit 20 25. [DOI] [PubMed]
- 17.Valkenburg KC, Williams BO. Mouse models of prostate cancer. Prostate Cancer. 2011;2011:895238. doi: 10.1155/2011/895238. [DOI] [PMC free article] [PubMed] [Google Scholar]
- 18.Yu S, Khor TO, Cheung KL, Li W, Wu TY, Huang Y, Foster BA, Kan YW, Kong AN. Nrf2 expression is regulated by epigenetic mechanisms in prostate cancer of TRAMP mice. PLoS ONE. 2010;5:e8579. doi: 10.1371/journal.pone.0008579. [DOI] [PMC free article] [PubMed] [Google Scholar]
- 19.McCabe MT, Low JA, Daignault S, Imperiale MJ, Wojno KJ, Day ML. Inhibition of DNA methyltransferase activity prevents tumorigenesis in a mouse model of prostate cancer. Cancer Res. 2006;66:385–392. doi: 10.1158/0008-5472.CAN-05-2020. [DOI] [PubMed] [Google Scholar]
- 20.Mavis CK, Morey Kinney SR, Foster BA, Karpf AR. Expression level and DNA methylation status of glutathione-S-transferase genes in normal murine prostate and TRAMP tumors. Prostate. 2009;69:1312–1324. doi: 10.1002/pros.20976. [DOI] [PMC free article] [PubMed] [Google Scholar]
- 21.Pulukuri SM, Rao JS. CpG island promoter methylation and silencing of 14-3-3sigma gene expression in LNCaP and Tramp-C1 prostate cancer cell lines is associated with methyl-CpG-binding protein MBD2. Oncogene. 2006;25:4559–4572. doi: 10.1038/sj.onc.1209462. [DOI] [PMC free article] [PubMed] [Google Scholar]
- 22.Chiam K, Ryan NK, Ricciardelli C, Day TK, Buchanan G, Ochnik AM, Murti K, Selth LA, Australian Prostate Cancer B, Butler LM, et al. Characterization of the prostate cancer susceptibility gene KLF6 in human and mouse prostate cancers. Prostate. 2013;73:182–193. doi: 10.1002/pros.22554. [DOI] [PubMed] [Google Scholar]
- 23.Morey Kinney SR, Zhang W, Pascual M, Greally JM, Gillard BM, Karasik E, Foster BA, Karpf AR. Lack of evidence for green tea polyphenols as DNA methylation inhibitors in murine prostate. Cancer Prev Res (Phila) 2009;2:1065–1075. doi: 10.1158/1940-6207.CAPR-09-0010. [DOI] [PMC free article] [PubMed] [Google Scholar]
- 24.Wu TY, Khor TO, Su ZY, Saw CL, Shu L, Cheung KL, Huang Y, Yu S, Kong AN. Epigenetic modifications of Nrf2 by 3,3′-diindolylmethane in vitro in TRAMP C1 cell line and in vivo TRAMP prostate tumors. AAPS J. 2013;15:864–874. doi: 10.1208/s12248-013-9493-3. [DOI] [PMC free article] [PubMed] [Google Scholar]
- 25.Khor TO, Yu S, Barve A, Hao X, Hong JL, Lin W, Foster B, Huang MT, Newmark HL, Kong AN. Dietary feeding of dibenzoylmethane inhibits prostate cancer in transgenic adenocarcinoma of the mouse prostate model. Cancer Res. 2009;69:7096–7102. doi: 10.1158/0008-5472.CAN-09-0597. [DOI] [PubMed] [Google Scholar]
- 26.Trapnell C, Roberts A, Goff L, Pertea G, Kim D, Kelley DR, Pimentel H, Salzberg SL, Rinn JL, Pachter L. Differential gene and transcript expression analysis of RNA-seq experiments with TopHat and Cufflinks. Nat Protoc. 2012;7:562–578. doi: 10.1038/nprot.2012.016. [DOI] [PMC free article] [PubMed] [Google Scholar]
- 27.Zhu LJ, Gazin C, Lawson ND, Pages H, Lin SM, Lapointe DS, Green MR. ChIPpeakAnno: a bioconductor package to annotate ChIP-seq and ChIP-chip data. BMC Bioinform. 2010;11:237. doi: 10.1186/1471-2105-11-237. [DOI] [PMC free article] [PubMed] [Google Scholar]
- 28.Thorvaldsdottir H, Robinson JT, Mesirov JP. Integrative genomics viewer (IGV): high-performance genomics data visualization and exploration. Brief Bioinform. 2013;14:178–192. doi: 10.1093/bib/bbs017. [DOI] [PMC free article] [PubMed] [Google Scholar]
- 29.Robinson JT, Thorvaldsdottir H, Winckler W, Guttman M, Lander ES, Getz G, Mesirov JP. Integrative genomics viewer. Nat Biotechnol. 2011;29:24–26. doi: 10.1038/nbt.1754. [DOI] [PMC free article] [PubMed] [Google Scholar]
- 30.Khor TO, Huang Y, Wu TY, Shu L, Lee J, Kong AN. Pharmacodynamics of curcumin as DNA hypomethylation agent in restoring the expression of Nrf2 via promoter CpGs demethylation. Biochem Pharmacol. 2011;82:1073–1078. doi: 10.1016/j.bcp.2011.07.065. [DOI] [PubMed] [Google Scholar]
- 31.Wang D, Liang H, Mao X, Liu W, Li M, Qiu S. Changes of transthyretin and clusterin after androgen ablation therapy and correlation with prostate cancer malignancy. Transl Oncol. 2012;5:124–132. doi: 10.1593/tlo.11259. [DOI] [PMC free article] [PubMed] [Google Scholar]
- 32.Jiang YZ, Manduchi E, Stoeckert CJ, Jr, Davies PF. Arterial endothelial methylome: differential DNA methylation in athero-susceptible disturbed flow regions in vivo. BMC Genom. 2015;16:506. doi: 10.1186/s12864-015-1656-4. [DOI] [PMC free article] [PubMed] [Google Scholar]
- 33.Chiaverotti T, Couto SS, Donjacour A, Mao JH, Nagase H, Cardiff RD, Cunha GR, Balmain A. Dissociation of epithelial and neuroendocrine carcinoma lineages in the transgenic adenocarcinoma of mouse prostate model of prostate cancer. Am J Pathol. 2008;172:236–246. doi: 10.2353/ajpath.2008.070602. [DOI] [PMC free article] [PubMed] [Google Scholar]
- 34.Mayr B, Montminy M. Transcriptional regulation by the phosphorylation-dependent factor CREB. Nat Rev Mol Cell Biol. 2001;2:599–609. doi: 10.1038/35085068. [DOI] [PubMed] [Google Scholar]
- 35.Shaywitz AJ, Greenberg ME. CREB: a stimulus-induced transcription factor activated by a diverse array of extracellular signals. Annu Rev Biochem. 1999;68:821–861. doi: 10.1146/annurev.biochem.68.1.821. [DOI] [PubMed] [Google Scholar]
- 36.Sakamoto KM, Frank DA. CREB in the pathophysiology of cancer: implications for targeting transcription factors for cancer therapy. Clin Cancer Res. 2009;15:2583–2587. doi: 10.1158/1078-0432.CCR-08-1137. [DOI] [PMC free article] [PubMed] [Google Scholar]
- 37.Conkright MD, Montminy M. CREB: the unindicted cancer co-conspirator. Trends Cell Biol. 2005;15:457–459. doi: 10.1016/j.tcb.2005.07.007. [DOI] [PubMed] [Google Scholar]
- 38.Gibadulinova A, Tothova V, Pastorek J, Pastorekova S. Transcriptional regulation and functional implication of S100P in cancer. Amino Acids. 2011;41:885–892. doi: 10.1007/s00726-010-0495-5. [DOI] [PubMed] [Google Scholar]
- 39.Tang H, Goldberg E. Homo sapiens lactate dehydrogenase c (Ldhc) gene expression in cancer cells is regulated by transcription factor Sp1, CREB, and CpG island methylation. J Androl. 2009;30:157–167. doi: 10.2164/jandrol.108.005785. [DOI] [PubMed] [Google Scholar]
- 40.Park MH, Lee HS, Lee CS, You ST, Kim DJ, Park BH, Kang MJ, Heo WD, Shin EY, Schwartz MA, Kim EG. p21-Activated kinase 4 promotes prostate cancer progression through CREB. Oncogene. 2013;32:2475–2482. doi: 10.1038/onc.2012.255. [DOI] [PubMed] [Google Scholar]
- 41.Xiao X, Li BX, Mitton B, Ikeda A, Sakamoto KM. Targeting CREB for cancer therapy: friend or foe. Curr Cancer Drug Targets. 2010;10:384–391. doi: 10.2174/156800910791208535. [DOI] [PMC free article] [PubMed] [Google Scholar]
- 42.Bassett SA, Barnett MP. The role of dietary histone deacetylases (HDACs) inhibitors in health and disease. Nutrients. 2014;6:4273–4301. doi: 10.3390/nu6104273. [DOI] [PMC free article] [PubMed] [Google Scholar]
- 43.Glauben R, Batra A, Stroh T, Erben U, Fedke I, Lehr HA, Leoni F, Mascagni P, Dinarello CA, Zeitz M, Siegmund B. Histone deacetylases: novel targets for prevention of colitis-associated cancer in mice. Gut. 2008;57:613–622. doi: 10.1136/gut.2007.134650. [DOI] [PubMed] [Google Scholar]
- 44.Giannini G, Cabri W, Fattorusso C, Rodriquez M. Histone deacetylase inhibitors in the treatment of cancer: overview and perspectives. Future Med Chem. 2012;4:1439–1460. doi: 10.4155/fmc.12.80. [DOI] [PubMed] [Google Scholar]
- 45.Kim HJ, Bae SC. Histone deacetylase inhibitors: molecular mechanisms of action and clinical trials as anti-cancer drugs. Am J Transl Res. 2011;3:166–179. [PMC free article] [PubMed] [Google Scholar]
- 46.Qian DZ, Wei YF, Wang X, Kato Y, Cheng L, Pili R. Antitumor activity of the histone deacetylase inhibitor MS-275 in prostate cancer models. Prostate. 2007;67:1182–1193. doi: 10.1002/pros.20611. [DOI] [PubMed] [Google Scholar]
- 47.Sargeant AM, Rengel RC, Kulp SK, Klein RD, Clinton SK, Wang YC, Chen CS. OSU-HDAC42, a histone deacetylase inhibitor, blocks prostate tumor progression in the transgenic adenocarcinoma of the mouse prostate model. Cancer Res. 2008;68:3999–4009. doi: 10.1158/0008-5472.CAN-08-0203. [DOI] [PubMed] [Google Scholar]
- 48.He GH, Lin JJ, Cai WK, Xu WM, Yu ZP, Yin SJ, Zhao CH, Xu GL. Associations of polymorphisms in histidine decarboxylase, histamine N-methyltransferase and histamine receptor H3 genes with breast cancer. PLoS ONE. 2014;9:e97728. doi: 10.1371/journal.pone.0097728. [DOI] [PMC free article] [PubMed] [Google Scholar]
- 49.Roh T, Kwak MY, Kwak EH, Kim DH, Han EY, Bae JY, du Bang Y, Lim DS, Ahn IY, Jang DE, et al. Chemopreventive mechanisms of methionine on inhibition of benzo(a)pyrene-DNA adducts formation in human hepatocellular carcinoma HepG2 cells. Toxicol Lett. 2012;208:232–238. doi: 10.1016/j.toxlet.2011.11.013. [DOI] [PubMed] [Google Scholar]
- 50.Nelson WG, De Marzo AM, DeWeese TL, Isaacs WB. The role of inflammation in the pathogenesis of prostate cancer. J Urol. 2004;172:S6–S11. doi: 10.1097/01.ju.0000142058.99614.ff. [DOI] [PubMed] [Google Scholar]
- 51.Lin X, Tascilar M, Lee WH, Vles WJ, Lee BH, Veeraswamy R, Asgari K, Freije D, van Rees B, Gage WR, et al. GSTP1 CpG island hypermethylation is responsible for the absence of GSTP1 expression in human prostate cancer cells. Am J Pathol. 2001;159:1815–1826. doi: 10.1016/S0002-9440(10)63028-3. [DOI] [PMC free article] [PubMed] [Google Scholar]
- 52.Nelson CP, Kidd LC, Sauvageot J, Isaacs WB, De Marzo AM, Groopman JD, Nelson WG, Kensler TW. Protection against 2-hydroxyamino-1-methyl-6-phenylimidazo[4,5-b]pyridine cytotoxicity and DNA adduct formation in human prostate by glutathione S-transferase P1. Cancer Res. 2001;61:103–109. [PubMed] [Google Scholar]
- 53.Maldonado L, Brait M, Loyo M, Sullenberger L, Wang K, Peskoe SB, Rosenbaum E, Howard R, Toubaji A, Albadine R, et al. GSTP1 promoter methylation is associated with recurrence in early stage prostate cancer. J Urol. 2014;192:1542–1548. doi: 10.1016/j.juro.2014.04.082. [DOI] [PMC free article] [PubMed] [Google Scholar]
- 54.Bryzgunova OE, Morozkin ES, Yarmoschuk SV, Vlassov VV, Laktionov PP. Methylation-specific sequencing of GSTP1 gene promoter in circulating/extracellular DNA from blood and urine of healthy donors and prostate cancer patients. Ann N Y Acad Sci. 2008;1137:222–225. doi: 10.1196/annals.1448.039. [DOI] [PubMed] [Google Scholar]
- 55.Dong H, Zhang H, Liang J, Yan H, Chen Y, Shen Y, Kong Y, Wang S, Zhao G, Jin W. Digital karyotyping reveals probable target genes at 7q21.3 locus in hepatocellular carcinoma. BMC Med Genom. 2011;4:60. doi: 10.1186/1755-8794-4-60. [DOI] [PMC free article] [PubMed] [Google Scholar]
- 56.Marshall A, Lukk M, Kutter C, Davies S, Alexander G, Odom DT. Global gene expression profiling reveals SPINK1 as a potential hepatocellular carcinoma marker. PLoS ONE. 2013;8:e59459. doi: 10.1371/journal.pone.0059459. [DOI] [PMC free article] [PubMed] [Google Scholar]
- 57.Lapucci A, Lulli M, Amedei A, Papucci L, Witort E, Di Gesualdo F, Bertolini F, Brewer G, Nicolin A, Bevilacqua A, et al. zeta-Crystallin is a bcl-2 mRNA binding protein involved in bcl-2 overexpression in T-cell acute lymphocytic leukemia. FASEB J. 2010;24:1852–1865. doi: 10.1096/fj.09-140459. [DOI] [PMC free article] [PubMed] [Google Scholar]
- 58.Wang X, Zhang X, He P, Fang Y. Sensitive detection of p53 tumor suppressor gene using an enzyme-based solid-state electrochemiluminescence sensing platform. Biosens Bioelectron. 2011;26:3608–3613. doi: 10.1016/j.bios.2011.02.012. [DOI] [PubMed] [Google Scholar]
- 59.Parkinson EK. Senescence as a modulator of oral squamous cell carcinoma development. Oral Oncol. 2010;46:840–853. doi: 10.1016/j.oraloncology.2009.09.009. [DOI] [PubMed] [Google Scholar]
- 60.Hickman JA, Potten CS, Merritt AJ, Fisher TC. Apoptosis and cancer chemotherapy. Philos Trans R Soc Lond B Biol Sci. 1994;345:319–325. doi: 10.1098/rstb.1994.0112. [DOI] [PubMed] [Google Scholar]
- 61.Rokavec M, Li H, Jiang L, Hermeking H. The p53/microRNA connection in gastrointestinal cancer. Clin Exp Gastroenterol. 2014;7:395–413. doi: 10.2147/CEG.S43738. [DOI] [PMC free article] [PubMed] [Google Scholar]
- 62.Thomas P, Pang Y, Dong J, Berg AH. Identification and characterization of membrane androgen receptors in the ZIP9 zinc transporter subfamily: II. Role of human ZIP9 in testosterone-induced prostate and breast cancer cell apoptosis. Endocrinology. 2014;155:4250–4265. doi: 10.1210/en.2014-1201. [DOI] [PMC free article] [PubMed] [Google Scholar]
- 63.Lin VC, Huang CY, Lee YC, Yu CC, Chang TY, Lu TL, Huang SP, Bao BY. Genetic variations in TP53 binding sites are predictors of clinical outcomes in prostate cancer patients. Arch Toxicol. 2014;88:901–911. doi: 10.1007/s00204-014-1196-8. [DOI] [PubMed] [Google Scholar]
- 64.Antonarakis ES, Keizman D, Zhang Z, Gurel B, Lotan TL, Hicks JL, Fedor HL, Carducci MA, De Marzo AM, Eisenberger MA. An immunohistochemical signature comprising PTEN, MYC, and Ki67 predicts progression in prostate cancer patients receiving adjuvant docetaxel after prostatectomy. Cancer. 2012;118:6063–6071. doi: 10.1002/cncr.27689. [DOI] [PMC free article] [PubMed] [Google Scholar]
- 65.Wang W, Bergh A, Damber JE. Increased p53 immunoreactivity in proliferative inflammatory atrophy of prostate is related to focal acute inflammation. APMIS. 2009;117:185–195. doi: 10.1111/j.1600-0463.2008.00006.x. [DOI] [PubMed] [Google Scholar]
- 66.Lu M, Xia L, Luo D, Waxman S, Jing Y. Dual effects of glutathione-S-transferase pi on As2O3 action in prostate cancer cells: enhancement of growth inhibition and inhibition of apoptosis. Oncogene. 2004;23:3945–3952. doi: 10.1038/sj.onc.1207500. [DOI] [PubMed] [Google Scholar]
- 67.Roy S, Tenniswood M. Site-specific acetylation of p53 directs selective transcription complex assembly. J Biol Chem. 2007;282:4765–4771. doi: 10.1074/jbc.M609588200. [DOI] [PubMed] [Google Scholar]
Associated Data
This section collects any data citations, data availability statements, or supplementary materials included in this article.
Data Availability Statement
The data is freely shared and available for other investigators who need to use them.