

Abstract
Background
Various patient reported quality-of-life indicators are independently prognostic for survival in metastatic breast cancer and other cancers. The same measures recorded at first diagnosis of early breast cancer carry no corresponding prognostic information. The present study aims to assess at what time in the disease evolution the prognostic association appears.
Methods
Among 8024 patients enrolled in one of seven randomized controlled trials in early-stage breast cancer 3247 had a breast cancer relapse after a median follow-up of 12.1 years. Of these 677 had completed QL indicator assessments within defined windows 1, 2 or 3 months prior to relapse. We performed Cox regression analyses using these assessments and using identical instruments after relapse. All analyses were stratified by trial and adjusted for baseline clinicopathologic factors.
Results
QL indicators in the months before relapse were not significantly prognostic for subsequent survival with the possibly chance exception of mood at the second month before relapse. After relapse, physical well-being was statistically significantly associated with survival (P < 0.001). This prognostic significance increased in later post-relapse assessments. Similar findings were observed using patient-reported indicators for nausea and vomiting, appetite, coping effort, and health perception.
Conclusions
Before cancer relapse, QL indicators were not generally prognostic for subsequent survival. After relapse, QL indicators substantially predicted OS, with a stronger association later in the course of relapsed disease. Simple patient perception of disease burden seems unlikely to explain this sudden change: rather the patient’s awareness of disease relapse must contribute.
Keywords: Breast cancer, Quality of life, Patient reported outcomes, Linear analog self-assessment, Prognostic factors, Survival
Background
Previous studies have shown that various patient-reported quality-of-life (QL) indicators independently predict survival outcomes in metastatic breast cancer [1–5] and other cancer types [5–8]. By contrast, in studies of early-stage breast cancer, no clear relationship between QL indicators and survival has been reported [9–11], though small studies have reported associations with appetite loss [12], future perspective [13], social wellbeing [14] and with physical and functional impairment [15], while a decrease in depression was reported to be associated with longer survival [16]. The reason for this discrepancy is uncertain. If the prognostic associations in advanced disease reflect patients’ perceptions of underlying disease severity, it may well be that at initial diagnosis of early-stage disease there are no such symptoms to perceive. The timing of the emergence of prognostic association of patient-reported QL indicators is therefore important because it might illuminate the mechanism for the association of such indicators with subsequent survival. The present study uses available individual-patient data from seven International Breast Cancer Study Group (IBCSG) adjuvant therapy trials that included QL assessments. We hypothesized that there may be a lead time prior to cancer relapse during QL indicators were prognostic for subsequent survival duration. Our primary objective was to examine the association between survival and QL indicators recorded at time points shortly before each patient’s date of disease relapse, and as a secondary aim to document the time course of the prognostic significance of the same QL indicators recorded at various intervals after relapse.
Patients and methods
Between 1986 and 2000, seven IBCSG trials randomised a total of 8024 women with operable breast cancer to different systemic treatment comparisons. Trial VI randomised premenopausal women with node-positive cancer and investigated the optimal duration and timing of adjuvant chemotherapy [17]. Trial VII [18] and trial IX [19] investigated the value of adding chemotherapy to tamoxifen to treatment for postmenopausal women with node-positive and node-negative tumors, respectively. Trial VIII investigated the role of treatment with chemotherapy, endocrine therapy comprising ovarian suppression with goserelin, and the sequential use of these modalities in premenopausal and perimenopausal women with node-negative tumors [20]. Trial 13–93 examined the introduction of a treatment gap and the value of adding tamoxifen to chemotherapy in premenopausal women [21], while Trial 14–93 investigated the role of a treatment-free gap in postmenopausal women [22]. Trial 15–95 investigated dose-intensive chemotherapy in women with high-risk, node-positive breast cancer [23].
In all of these trials, QL was measured using validated single-item linear analog self-assessment (LASA) indicators of components of QL (physical wellbeing, mood, coping, and perceived health status) shown to be affected by breast cancer, surgery, chemo- and endocrine therapy [24–27]. These were global indicators for physical well-being, mood, coping effort and perceived health status (utility). The specific indicators for side-effects were nausea/vomiting, appetite, flushing, and arm restriction. Mood and coping indicators are shown to be sensitive in identifying psychological distress, mood disorders and psychosocial dysfunction. The clinical relevance of global and specific LASA indicators has been confirmed in breast cancer trials that examined the impact of axillary clearance, chemo- and endocrine therapy, and by their association with performance status, tumor response, chemotherapy treatment benefit and toxicity, and survival duration. Each LASA indicator consisted of a 100-mm line, with scores ranged from 0 (best) to 100 (worst). The schedule of QL assessments was essentially similar in all trials, with regular early measures then additional assessment following relapse.
Statistical methods
Only patients with documented breast cancer relapse were considered. In these patients, we examined the relationship of each QL indicator with OS using Cox regression models. All our models were stratified by trial enrolment. The hazard ratio (HR) was calculated using the estimated parameter from these models and represents the risk for a 1 point increase of the 100 point QL scale (that is, as the QL indicator worsens, the HR increases).
Our primary analysis sought any association between QL indicators and subsequent OS before cancer relapse. Survival times were measured from the landmark times before cancer relapse to the date of death (from any cause) or date of last follow-up. Three arbitrary time periods were chosen: 1, 2, and 3 months before the date of each patient’s documented relapse. QL indicators recorded within a window of 2 weeks around each of these times were analysed. In our primary analysis, all types of breast cancer relapses were considered. Multivariable analyses were performed to adjust for baseline factors at initial diagnosis (age, tumor size, estrogen receptor, performance status and axillary nodal status (node-negative vs 1–3 positive nodes vs 1–3 v 4or more positive nodes). We further performed a sensitivity analysis in which only cases with distant metastasis to skeletal, viscera, distant nodes and / or soft tissues were examined.
In our secondary analysis, we examined for the association between QL indicators at and after cancer relapse and subsequent survival. Survival times were measured from the dates of the first, second, and third QL indicator readings after relapse to the date of death (from any cause) or the date of last follow-up. The relationships between 1st, 2nd, and 3rd post-relapse QL indicators and survival from the time of relapse were tested singly using univariable Cox regression analyses stratified by trial. Multivariable analyses jointly explored first and second, and first, second, and third post-relapse QL indicators. In these multivariable analyses, survival times were measured (landmarked) from the dates of the latest QL indicator readings after relapse to the date of death. There was no adjustment for multiple comparisons. All analyses were two sided, and P < 0.05 was considered significant.
Results
Of a total of 8024 patients, 3834 (47.8%) had a protocol-defined DFS event (first occurrence of breast cancer recurrence at local, regional, or distant site, contralateral breast cancer, second malignancy or death prior to a cancer event) during a median follow-up period of 12.1 years (range 0 to 21.5 years).. The patient and disease characteristics at trial entry, and QL data availability, are summarized in Table 1. Because we wanted to focus only on breast cancer relapse, we excluded 346 patients with a non-breast second primary malignancy, 223 who died without disease recurrence and 18 the nature of whose DFS event was unknown, leaving 3247 who had disease relapse in the main analytic cohort. Of these, 1243 (38%) had a relapse involving local or regional sites or contralateral breast and the remaining 2004 (62%) distant metastatic disease (Table 4 in Appendix 3).
Table 1.
Patient and disease characteristics at trial entry, and quality of life data availability, in those with breast cancer related relapse
| Overall | Trial VI | Trial VII | Trial VIII | Trial IX | Trial 13 | Trial 14 | Trial 15 | |
|---|---|---|---|---|---|---|---|---|
| Patients enrolled | 8024 | 1475 | 1212 | 1109 | 1669 | 1246 | 969 | 344 |
| Patients who relapsed (analytic cohort) | 3247 | 848 | 656 | 281 | 339 | 511 | 417 | 195 |
| Characteristics in analytic cohort | ||||||||
| Age, median | 50 | 44 | 60 | 44 | 61 | 43 | 58 | 46 |
| Range | 23–79 | 24–57 | 38–79 | 29–56 | 34–76 | 23–57 | 40–70 | 25–65 |
| Menopausal, n (%) | 1475 (45.4) | 0 (0) | 656 (100) | 2 (0.7) | 339 (100) | 4 (0.8) | 413 (99.0) | 61 (31.3) |
| Tumor >2 cm, n (%) | 1998 (62.8) | 523 (63.2) | 4 s24 (65.3) | 120 (43.2) | 182 (53.9) | 338 (68.2) | 270 (67.3) | 141 (72.7) |
| 1–3 involved axillary lymph nodes, n (%) | 1189 (36.6) | 454 (53.5) | 338 (51.5) | 0 (0) | 1 (0.3) | 250 (48.9) | 146 (35.0) | 0 (0) |
| ≥ 4 involved axillary lymph nodes, n (%) | 1438 (44.3) | 394 (46.5) | 318 (48.5) | 0 (0) | 0 (0) | 261 (51.1) | 270 (64.8) | 195 (100) |
| Estrogen receptor positive, n (%) | 2154 (66.5) | 585 (69.0) | 485 (73.9) | 211 (75.4) | 256 (76.7) | 297 (58.1) | 245 (58.8) | 75 (38.7) |
| Mastectomy, n (%) | 2258 (69.5) | 637 (75.1) | 543 (82.8) | 130 (46.3) | 182 (53.7) | 327 (64.0) | 291 (69.8) | 148 (75.9) |
| Radiotherapy, n (%) | 979 (30.2) | 201 (23.7) | 106 (16.2) | 121 (43.1) | 128 (37.8) | 184 (36.0) | 128 (30.7) | 111 (56.9) |
| QL data availability at 1, 2 or 3 months before relapsea, n (%) | 677 (20.9) | 187 (22.1) | 130 (19.8) | 59 (21.0) | 50 (14.7) | 106 (20.7) | 91 (21.8) | 54 (27.7) |
| 1 month | 199 | 39 | 34 | 17 | 15 | 36 | 31 | 27 |
| 2 months | 163 | 40 | 30 | 16 | 10 | 30 | 27 | 10 |
| 3 months | 315 | 108 | 66 | 26 | 25 | 40 | 33 | 17 |
| QL data availability at or after relapseb, n (%) | 1309 (40.3) | 354 (41.7) | 262 (39.9) | 96 (34.2) | 102 (30.1) | 233 (45.6) | 170 (40.8) | 92 (47.2) |
| First post-relapse reading | 1309 | 354 | 262 | 96 | 102 | 233 | 170 | 92 |
| Second post-relapse reading | 661 | 188 | 135 | 57 | 45 | 125 | 70 | 41 |
| Third post-relapse reading | 202 | 25 | 25 | 29 | 22 | 57 | 31 | 13 |
QL quality of life
aat each time point before relapse, patients did not complete more than one QL assessments
bat each time point after relapse, patients could complete one or more QL (non-protocol) assessments
Prognostic relevance of QL indicators measured before cancer relapse
Since the date of relapse could not be known prospectively, available QL forms in arbitrary 2-week time windows 1, 2 and 3 months prior to each patient’s data of relapse were used. Amongst 3247 patients who had disease relapse, QL forms were completed by 677 (20.9%) in one of these windows: no patient had data in more than one window (Table 1). Table 2 in Appendix 1 summarizes the distribution of QL indicators at different landmark times before and after breast cancer relapse. Table 3 in Appendix 2 shows the distribution of the different sites / types of breast cancer relapse and other DFS events.
At 1 month and 3 months before disease relapse, none of the QL indicators showed a statistically significant relationship with subsequent OS. The results did not change significantly with adjustment for baseline factors. At 2 months before disease relapse, none of the QL indicators, except mood (HR for a 1-point change 1.008, 95% confidence interval (CI) 1.001 to 1.015, uncorrected P = 0.03), showed a statistically significant relationship with OS. We regard this association with mood at a single time point as a statistical artefact without biological significance. When adjusted for baseline prognostic factors, none of the QL indicators, including mood, were associated with survival (Fig. 1).
Fig. 1.
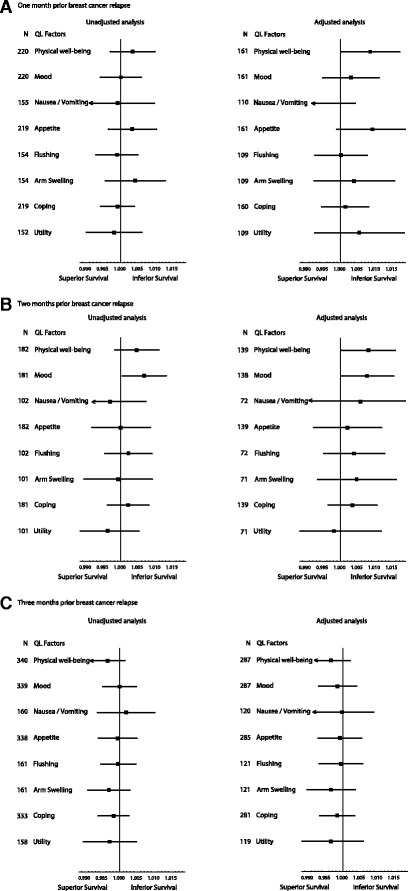
Unadjusted and adjusted hazard ratios for overall survival for 1 point scale worsening of each quality-of-life (QL) indicator at (A) 1 month, (B) 2 months, and (C) 3 months before breast cancer relapse. Hazard ratios for each QL indicators are represented by the squares, and the horizontal line crossing the square represents the 95% confidence interval
Prognostic relevance of QL indicators measured at and beyond cancer relapse
The median survival time after disease relapse was 2.5 years (range 0 to 19.7 years). At or after disease relapse, QL forms were completed at least once by 1309 patients (40.3%) in the study cohort (Table 1). With a median time of 1.2 months after cancer relapse (first post-relapse QL indicators), physical well-being (HR per 1-point change 1.006, 95% CI 1.004 to 1.008, P < 0.001), was statistically significantly associated with OS. At the second post-relapse (median time 6.8 months), the corresponding HR was 1.008 (95% CI 1.005 to 1.011, P < 0.001) and at the third post-relapse (median time 17.8 months), 1.013 (95% CI 1.07 to 1.018, P < 0.001). QL indicators for nausea and vomiting, appetite, coping effort and utility taken at these time-points after cancer relapse also showed patterns similar to those for physical well-being (Fig. 2).
Fig. 2.
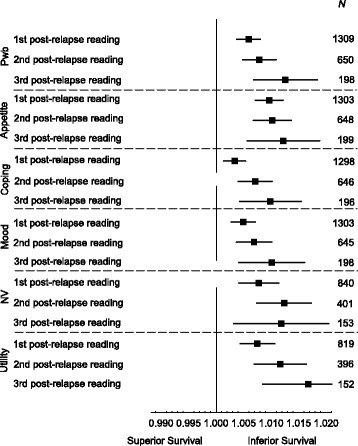
Unadjusted and adjusted hazard ratios for overall survival for 1 point scale worsening of each quality-of-life (QL) indicator after cancer relapse. PWB = physical well-being; NV = nausea and vomiting
When the second post-relapse QL indicators for physical well-being was adjusted for the first post-relapse QL indicators in a multivariable model, the HR for the second post-relapse QL indicators was 1.008 (95% CI 1.005 to 1.011, P < 0.001) while the first post-relapse QL indicators was no longer statistically significant (P = 0.85). The same pattern was observed among the small group who reported third post-relapse QL indicators adjusted for first and second post-relapse scores in a multivariable model (Fig. 3). These results imply that the physical well-being measured later in the evolution of recurrent disease has a stronger association with OS than earlier measurements. Similar results were observed for nausea and vomiting, appetite, coping effort, and utility (results not shown).
Fig. 3.
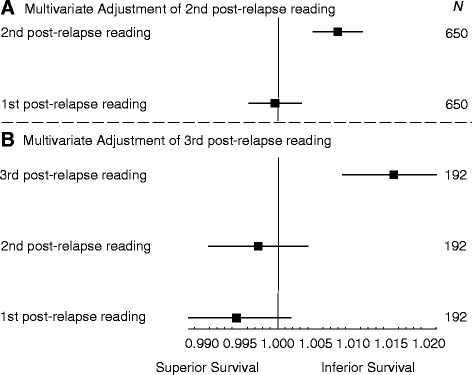
Hazard ratios for overall survival for 1 point scale worsening of physical well-being assessment when (a) the second post-relapse score for physical well-being was adjusted for the first post-relapse score, and (b) the third post-relapse score for physical well-being was adjusted for the first and second post-relapse score
Discussion
Interest in the psychological correlates of prognosis in cancer has been longstanding. Our own studies in metastatic breast cancer [28] and melanoma [29] found a consistent positive effect of “minimization” of concern. In this study, using established QL indicators which had proven prognostic in metastatic disease [2, 9] we could not demonstrate any lead-time effect, in that none of the QL indicators, (apart from the possibly chance finding of mood at 2 months), measured at 1, 2, and 3 months before cancer relapse had prognostic significance for subsequent survival. By contrast, and in keeping with prior observations, the same indicators recorded at and after cancer relapse substantially predicted subsequent survival, with stronger association for QL indicators measured later in the course of relapsed disease. The hazard ratios observed after relapse represent large effect size: every 10 points worsening of physical well-being, at the median time of 1.3 months after progression, was associated with 7% increase in hazard of death. At median times of 5.8 and 10.1 months after progression, the corresponding hazards of death were increased to 8% and 13%, respectively for every 10 points worsening of physical well-being.
This study has several strengths. It is based on individual patient QL indicator data prospectively collected in almost 4000 patients from seven adjuvant clinical trials. Among these, 22.9% had available QL indicator data falling in the period prior to the time of relapse and 40.3% had QL indicator data soon thereafter, enabling prognostic analyses to be performed at various stages of the disease trajectory around the event of disease relapse.
There are also several limitations of this study. The findings remain hypothesis-generating, as none of these clinical trials were originally designed to answer the research questions addressed in this paper. Patients were classified in these trials as having disease progression if they had local recurrence and / or more distant metastatic disease. Patient’s self-perception of the severity of the disease might differ between those who developed a local recurrence versus those with distant metastasis and hence might potentially impact on the results. However, our sensitivity analysis (Table 4 in Appendix 3) does not suggest major differences in the result of all types of relapse versus those with distant metastases only. For feasibility reasons, in these large-scale phase-III international studies where trials were conducted in different cultures with different local settings and resources, key indicators relevant to patients with breast cancer were selected as an alternative to a comprehensive QL assessment [24, 25]. Because the time of relapse could not be prospectively known, QL indicator data were only available from 22.9% of patients at the chosen time points 1, 2 or 3 months before relapse. Moreover, these data were generally from patients who relapsed early during or immediately after completion of adjuvant systemic treatments (when QL indicator assessments were scheduled) rather than those who relapsed later. We do not have detailed clinicopathologic information about the sites of relapse in these patients and have therefore not attempted to separately assess the prognostic relevance of QL indicators after relapse at various different sites. Our multivariable analyses only adjusted for baseline factors at diagnosis of early-stage breast cancer. Thus, it is possible that QL indicator data might not be prognostic for survival after relapses confined, say, to soft tissues. We used QL indicators at various time points but did not examine for effects of change in the score. However, changes in QL indicator from baseline (at the commencement of adjuvant therapy) to before and during cancer relapse may be difficult to interpret because of the significant time gap for most of these patients, and the phenomenon of response shift [30–32].
Conclusion
In conclusion, QL indicators measured at various intervals before cancer relapse did not have prognostic significance for subsequent OS. At and after cancer relapse, QL indicators substantially predicted subsequent OS, with stronger association for QL indicators measured in the later course of relapsed disease. Patients’ self-perception of the severity of the underlying disease after relapse might be a reason for the reported QL indicators and thus contributes to their prognostic significance.
Acknowledgements
The authors thank Shari Gelber (International Breast Cancer Study Group Statistical Center) for data extraction and Rhana Pike (Clinical Trials Centre) for provision of editorial support. We thank the patients, investigators, and data managers who participated in the International Breast Cancer Study Group trials, and the IBCSG for providing the data used in this analysis.
Funding
This study had no specific funding. The work was partly funded by National Health and Medical Research Council program grant 1037786 to the Clinical Trials Centre. The coordination of the trials was funded by the International Breast Cancer Study Group.
Availability of data and materials
All authors have access to raw individual patient data of this study. The data on which these analyses are based form part of the clinical trials database of the International Breast Cancer Study Group. As such they are available for external research proposals subject to the Group’s standard scientific and ethical review.
Abbreviations
- CI
Confidence interval
- DFS
Disease-free survival
- HR
Hazard ratio
- IBCSG
International Breast Cancer Study Group
- LASA
Linear analog self-assessment
- OS
Overall survival
- QL
Quality-of-life
Appendix 1
Table 2.
Distribution of quality-of-life indicators at different landmark times before and after breast cancer relapse
| 1 month prior relapse | 2 months prior relapse | 3 months prior relapse | |||||||
|---|---|---|---|---|---|---|---|---|---|
| QL Indicators | N | Mediana | IQR | N | Mediana | IQR | N | Mediana | IQR |
| Physical well-being | 199 | 14.0 | 29.0 | 163 | 20.0 | 39.0 | 315 | 16.0 | 32.0 |
| Mood | 199 | 20.0 | 40.0 | 162 | 16.0 | 41.0 | 315 | 17.0 | 39.0 |
| Nausea / Vomiting | 140 | 3.0 | 7.0 | 90 | 3.0 | 7.0 | 143 | 3.0 | 13.0 |
| Appetite | 199 | 8.0 | 19.0 | 163 | 7.0 | 19.0 | 313 | 7.0 | 18.0 |
| Flushing | 139 | 22.0 | 58.0 | 90 | 27.0 | 70.0 | 144 | 17.5 | 62.0 |
| Arm swelling | 139 | 11.0 | 28.0 | 89 | 11.0 | 31.0 | 144 | 13.0 | 34.5 |
| Coping | 198 | 20.0 | 44.0 | 162 | 21.0 | 43.0 | 309 | 20.0 | 36.0 |
| Utility | 138 | 21.0 | 28.0 | 89 | 23.0 | 34.0 | 142 | 19.0 | 33.0 |
| 1st reading post-relapse | 2nd reading post-relapse | 3rd reading post-relapse | |||||||
| QL Indicators | N | Median | IQR | N | Median | IQR | N | Median | IQR |
| Physical well-being | 1309 | 26.0 | 46.0 | 650 | 24.0 | 45.0 | 198 | 27.0 | 45.0 |
| Mood | 1303 | 27.0 | 46.0 | 645 | 23.0 | 42.0 | 198 | 22.5 | 41.0 |
| Nausea / Vomiting | 840 | 3.0 | 14.0 | 401 | 4.0 | 15.0 | 153 | 2.0 | 7.0 |
| Appetite | 1303 | 9.0 | 32.0 | 648 | 10.0 | 37.5 | 199 | 11.0 | 34.0 |
| Flushing | 838 | 19.5 | 49.0 | 398 | 18.0 | 51.0 | 153 | 23.0 | 54.0 |
| Arm swelling | 834 | 11.0 | 36.0 | 398 | 13.0 | 41.0 | 154 | 13.0 | 41.0 |
| Coping | 1298 | 35.0 | 50.0 | 646 | 32.0 | 50.0 | 196 | 31.0 | 53.0 |
| Utility | 819 | 31.0 | 39.0 | 396 | 33.0 | 35.5 | 152 | 33.0 | 39.0 |
QL quality of life, IQR interquartile range
aEach linear analog self-assessment QL indicators consisted of a 100-mm line, with scores ranged from 0 (best) to 100 (worst)
Appendix 2
Table 3.
Number of patients with different types of breast cancer relapses for each trial
| Trial Number | VI | VII | VIII | IX | 13 | 14 | 15 | Total |
|---|---|---|---|---|---|---|---|---|
| N | ||||||||
| No relapse | 568 | 380 | 789 | 1118 | 704 | 495 | 136 | 4190 |
| Local recurrence | 167 | 102 | 88 | 84 | 92 | 72 | 20 | 625 |
| Contralateral breast cancer | 71 | 36 | 42 | 57 | 40 | 26 | 6 | 278 |
| Regional nodal metastasis | 106 | 81 | 16 | 18 | 59 | 42 | 18 | 340 |
| Distant soft tissue / nodal metastasis | 37 | 26 | 13 | 11 | 11 | 9 | 11 | 118 |
| Distant bone metastasis | 207 | 169 | 42 | 50 | 132 | 91 | 41 | 732 |
| Distant visceral metastasis | 260 | 242 | 80 | 119 | 177 | 177 | 99 | 1154 |
| Second breast cancer primary | 48 | 89 | 30 | 108 | 22 | 42 | 7 | 346 |
| Death without recurrence | 10 | 76 | 7 | 102 | 9 | 14 | 5 | 223 |
| Unknown | 1 | 11 | 2 | 2 | 0 | 1 | 1 | 18 |
| Total | 1475 | 1212 | 1109 | 1669 | 1246 | 969 | 344 | 8024 |
Appendix 3
Table 4.
Unadjusted analyses for (A) all types of relapses and (B) relapses limited to distant metastasis to skeletal, viscera and / or distant nodes
| (A) All types of relapses | (B) Distant relapses with skeletal, visceral and / or distant nodes | |||||||
|---|---|---|---|---|---|---|---|---|
| QL indictors | N | HR | 95% CI | N | HR | 95% CI | ||
| 1 month before documented relapse | ||||||||
| Physical well-being | 199 | 1.004 | 0.997 | 1.010 | 136 | 1.003 | 0.996 | 1.011 |
| Mood | 199 | 1.001 | 0.994 | 1.007 | 136 | 0.999 | 0.992 | 1.006 |
| Nausea / Vomiting | 140 | 0.999 | 0.988 | 1.010 | 96 | 0.999 | 0.985 | 1.014 |
| Appetite | 199 | 1.002 | 0.995 | 1.009 | 136 | 1.000 | 0.992 | 1.009 |
| Flushing | 139 | 1.000 | 0.994 | 1.007 | 96 | 1.002 | 0.994 | 1.010 |
| Arm swelling | 139 | 1.005 | 0.997 | 1.014 | 95 | 1.010 | 1.000 | 1.020 |
| Coping | 198 | 1.000 | 0.994 | 1.005 | 135 | 1.000 | 0.993 | 1.006 |
| Utility | 138 | 0.998 | 0.989 | 1.007 | 94 | 0.998 | 0.987 | 1.008 |
| 2 months before documented relapse | ||||||||
| Physical well-being | 163 | 1.005 | 0.998 | 1.011 | 117 | 1.003 | 0.995 | 1.010 |
| Mood | 162 | 1.008 | 1.001 | 1.015 | 117 | 1.008 | 1.000 | 1.016 |
| Nausea / Vomiting | 90 | 0.994 | 0.983 | 1.005 | 66 | 0.993 | 0.981 | 1.005 |
| Appetite | 163 | 0.998 | 0.989 | 1.008 | 117 | 1.001 | 0.991 | 1.012 |
| Flushing | 90 | 1.003 | 0.995 | 1.010 | 66 | 1.003 | 0.994 | 1.011 |
| Arm swelling | 89 | 0.998 | 0.988 | 1.009 | 66 | 0.994 | 0.981 | 1.008 |
| Coping | 162 | 1.003 | 0.997 | 1.009 | 117 | 1.004 | 0.997 | 1.012 |
| Utility | 89 | 0.995 | 0.986 | 1.005 | 66 | 0.998 | 0.986 | 1.011 |
| 3 months before documented relapse | ||||||||
| Physical well-being | 315 | 0.996 | 0.991 | 1.002 | 189 | 0.994 | 0.988 | 1.001 |
| Mood | 315 | 0.999 | 0.994 | 1.004 | 189 | 0.997 | 0.991 | 1.003 |
| Nausea / Vomiting | 143 | 1.000 | 0.992 | 1.009 | 89 | 1.002 | 0.991 | 1.013 |
| Appetite | 313 | 0.999 | 0.993 | 1.005 | 187 | 0.998 | 0.990 | 1.006 |
| Flushing | 144 | 1.000 | 0.994 | 1.005 | 90 | 1.000 | 0.993 | 1.007 |
| Arm swelling | 144 | 0.998 | 0.991 | 1.004 | 90 | 0.998 | 0.991 | 1.005 |
| Coping | 309 | 0.998 | 0.994 | 1.003 | 184 | 0.996 | 0.990 | 1.002 |
| Utility | 142 | 0.996 | 0.989 | 1.004 | 88 | 0.995 | 0.986 | 1.005 |
QL quality-of-life, HR hazard ratio, CI confidence interval
Authors’ contributions
All authors contributed to the study concept, participated in its design and coordination and in drafting the manuscript. All authors have approved the final version of the manuscript.
Ethics approval and consent to participate
Each of the clinical trials from which these data are derived was approved by the International Breast Cancer Study Group Ethics Committee and by the Ethics Committees of all participating institutions. All patients who participated provided written consents to undergo treatment in the included trials. QL indicator assessments were reviewed and approved by relevant ethics committees.
Consent for publication
No individually identifiable data are included. General consent to publish was granted by patients as part of initial trial participation.
Competing interests
All authors declare no competing interests.
Publisher’s Note
Springer Nature remains neutral with regard to jurisdictional claims in published maps and institutional affiliations.
References
- 1.Coates AS, Gebski V, Bishop JF, Jeal PN, Woods RL, Snyder R, et al. Improving the quality of life in advanced breast cancer. A comparison of continuous and intermittent treatment strategies. N Engl J Med. 1987;317:1490–1495. doi: 10.1056/NEJM198712103172402. [DOI] [PubMed] [Google Scholar]
- 2.Coates AS, Gebski V, Signorini D, Murray P, McNeil D, Byrne M, et al. Prognostic value of quality-of-life scores during chemotherapy for advanced breast cancer. Australian New Zealand breast cancer trials group [see comments] J Clin Oncol. 1992;10:1833–1838. doi: 10.1200/JCO.1992.10.12.1833. [DOI] [PubMed] [Google Scholar]
- 3.Lee CK, Stockler MR, Coates AS, Gebski V, Lord SJ, Simes RJ. Self-reported health-related quality of life is an independent predictor of chemotherapy treatment benefit and toxicity in women with advanced breast cancer. Br J Cancer. 2010;102:1341–1347. doi: 10.1038/sj.bjc.6605649. [DOI] [PMC free article] [PubMed] [Google Scholar]
- 4.Smyth EN, Shen W, Bowman L, Peterson P, John W, Melemed A, et al. Patient-reported pain and other quality of life domains as prognostic factors for survival in a phase III clinical trial of patients with advanced breast cancer. Health Qual Life Outcomes. 2016;14:52–64. doi: 10.1186/s12955-016-0449-z. [DOI] [PMC free article] [PubMed] [Google Scholar]
- 5.Quinten C, Martinelli F, Coens C, Sprangers MA, Ringash J, Gotay C, et al. A global analysis of multitrial data investigating quality of life and symptoms as prognostic factors for survival in different tumor sites. Cancer. 2014;120:302–311. doi: 10.1002/cncr.28382. [DOI] [PubMed] [Google Scholar]
- 6.Coates AS, Thomson D, McLeod GR, Hersey P, Gill PG, Olver IN, et al. Prognostic value of quality of life scores in a trial of chemotherapy with or without interferon in patients with metastatic melanoma. Eur J Cancer. 1993;29A:1731–1734. doi: 10.1016/0959-8049(93)90115-V. [DOI] [PubMed] [Google Scholar]
- 7.Coates AS, Porzsolt F, Osoba D. Quality of life in oncology practice: prognostic value of EORTC QLQ-C30 scores in patients with advanced malignancy. Eur J Cancer. 1997;33:1025–1030. doi: 10.1016/S0959-8049(97)00049-X. [DOI] [PubMed] [Google Scholar]
- 8.Montazeri A. Quality of life data as prognostic indicators of survival in cancer patients: an overview of the literature from 1982 to 2008. Health Qual Life Outcomes. 2009;7:102. doi: 10.1186/1477-7525-7-102. [DOI] [PMC free article] [PubMed] [Google Scholar]
- 9.Coates AS, Hurny C, Peterson HF, Bernhard J, Castiglione-Gertsch M, Gelber RD, et al. Quality-of-life scores predict outcome in metastatic but not early breast cancer. J Clin Oncol. 2000;18:3768–3774. doi: 10.1200/JCO.2000.18.22.3768. [DOI] [PubMed] [Google Scholar]
- 10.Goodwin PJ, Ennis M, Bordeleau LJ, Pritchard KI, Trudeau ME, Koo J, et al. Health-related quality of life and psychosocial status in breast cancer prognosis: analysis of multiple variables. J Clin Oncol. 2004;22:4184–4192. doi: 10.1200/JCO.2004.12.091. [DOI] [PubMed] [Google Scholar]
- 11.Efficace F, Therasse P, Piccart MJ, Coens C, Van Steen K, Welnicka-Jaskiewicz M, et al. Health-related quality of life parameters as prognostic factors in a nonmetastatic breast cancer population: an international multicenter study. J Clin Oncol. 2004;22:3381–3388. doi: 10.1200/JCO.2004.02.060. [DOI] [PubMed] [Google Scholar]
- 12.Bredal IS, Sandvik L, Karesen R, Ekeberg O. Prognostic value of health-related quality-of-life parameters in early-stage breast cancer: an 8-year follow-up study. Psychooncology. 2011;20:1102–1107. doi: 10.1002/pon.1822. [DOI] [PubMed] [Google Scholar]
- 13.De Aguiar SS, Bergmann A, Mattos IE. Quality of life as a predictor of overall survival after breast cancer treatment. Qual Life Res. 2014;23:627–637. doi: 10.1007/s11136-013-0476-8. [DOI] [PubMed] [Google Scholar]
- 14.Epplein M, Zheng Y, Zheng W, Chen Z, Gu K, Penson D, et al. Quality of life after breast cancer diagnosis and survival. J Clin Oncol. 2011;29:406–412. doi: 10.1200/JCO.2010.30.6951. [DOI] [PMC free article] [PubMed] [Google Scholar]
- 15.DiSipio T, Hayes S, Battistutta D, Newman B, Janda M. Patterns, correlates, and prognostic significance of quality of life following breast cancer. Psychooncology. 2011;20:1084–1091. doi: 10.1002/pon.1816. [DOI] [PubMed] [Google Scholar]
- 16.Giese-Davis J, Collie K, Rancourt KM, Neri E, Kraemer HC, Spiegel D. Decrease in depression symptoms is associated with longer survival in patients with metastatic breast cancer: a secondary analysis. J Clin Oncol. 2011;29:413–420. doi: 10.1200/JCO.2010.28.4455. [DOI] [PMC free article] [PubMed] [Google Scholar]
- 17.International Breast Cancer Study Group Duration and reintroduction of adjuvant chemotherapy for node-positive premenopausal breast cancer patients. J Clin Oncol. 1996;14:1885–1893. doi: 10.1200/JCO.1996.14.6.1885. [DOI] [PubMed] [Google Scholar]
- 18.International Breast Cancer Study Group Effectiveness of adjuvant chemotherapy in combination with tamoxifen for node-positive postmenopausal breast cancer patients. J Clin Oncol. 1997;15:1385–1394. doi: 10.1200/JCO.1997.15.4.1385. [DOI] [PubMed] [Google Scholar]
- 19.International Breast Cancer Study Group Endocrine responsiveness and tailoring adjuvant therapy for postmenopausal lymph node-negative breast cancer: a randomized trial. J Natl Cancer Inst. 2002;94:1054–1065. doi: 10.1093/jnci/94.14.1054. [DOI] [PubMed] [Google Scholar]
- 20.International Breast Cancer Study Group Adjuvant chemotherapy followed by Goserelin versus either modality alone for premenopausal lymph node-negative breast cancer: a randomized trial. J NatlCancer Inst. 2003;95:1833–1846. doi: 10.1093/jnci/djg119. [DOI] [PubMed] [Google Scholar]
- 21.International Breast Cancer Study Group Tamoxifen after adjuvant chemotherapy for premenopausal women with lymph node-positive breast cancer: international breast cancer study group trial 13-93. J Clin Oncol. 2006;24:1332–1341. doi: 10.1200/JCO.2005.03.0783. [DOI] [PubMed] [Google Scholar]
- 22.Colleoni M, Gelber S, Simoncini E, Pagani O, Gelber RD, Price KN, et al. Effects of a treatment gap during adjuvant chemotherapy in node-positive breast cancer: results of international breast cancer study group (IBCSG) trials 13-93 and 14-93. Ann Oncol. 2007;18:1177–1184. doi: 10.1093/annonc/mdm268. [DOI] [PubMed] [Google Scholar]
- 23.Basser RL, O'Neill A, Martinelli G, Green MD, Peccatori F, Cinieri S, et al. Multicycle dose-intensive chemotherapy for women with high-risk primary breast cancer: results of international breast cancer study group trial 15-95. J Clin Oncol. 2006;24:370–378. doi: 10.1200/JCO.2005.03.5196. [DOI] [PubMed] [Google Scholar]
- 24.Bernhard J, Hürny C, Coates AS, Peterson HF, Castiglione-Gertsch M, Gelber RD, et al. Quality of life assessment in patients receiving adjuvant therapy for breast cancer: the IBCSG approach. The international breast cancer study group. Ann Oncol. 1997;8:825–835. doi: 10.1023/A:1008269715091. [DOI] [PubMed] [Google Scholar]
- 25.Bernhard J, Sullivan M, Hurny C, Coates AS, Rudenstam CM. Clinical relevance of single item quality of life indicators in cancer clinical trials. Br J Cancer. 2001;84:1156–1165. doi: 10.1054/bjoc.2001.1785. [DOI] [PMC free article] [PubMed] [Google Scholar]
- 26.Butow PN, Coates AS, Dunn S, Bernhard J, Hürny C. On the receiving end. IV: validation of quality of life indicators. Ann Oncol. 1991;2:597–603. doi: 10.1093/oxfordjournals.annonc.a058027. [DOI] [PubMed] [Google Scholar]
- 27.Hürny C, Bernhard J, Bacchi M, van Wegberg B, Tomamichel M, Spek U, et al. The perceived adjustment to chronic illness scale (PACIS): a global indicator of coping for operable breast cancer patients in clinical trials. Support Care Cancer. 1993;1:200–208. doi: 10.1007/BF00366447. [DOI] [PubMed] [Google Scholar]
- 28.Butow PN, Coates AS, Dunn SM. Psychosocial predictors of survival: metastatic breast cancer. Ann Oncol. 2000;11:469–474. doi: 10.1023/A:1008396330433. [DOI] [PubMed] [Google Scholar]
- 29.Butow PN, Coates AS, Dunn SM. Psychosocial predictors of survival in metastatic melanoma. J Clin Oncol. 1999;17:2256–2263. doi: 10.1200/JCO.1999.17.7.2256. [DOI] [PubMed] [Google Scholar]
- 30.Ring L, Hofer S, Heuston F, Harris D, O'Boyle CA. Response shift masks the treatment impact on patient reported outcomes (PROs): the example of individual quality of life in edentulous patients. Health Qual Life Outcomes. 2005;3:55. doi: 10.1186/1477-7525-3-55. [DOI] [PMC free article] [PubMed] [Google Scholar]
- 31.Rees J, Clarke MG, Waldron D, O'Boyle C, Ewings P, MacDonagh RP. The measurement of response shift in patients with advanced prostate cancer and their partners. Health Qual Life Outcomes. 2005;3:21. doi: 10.1186/1477-7525-3-21. [DOI] [PMC free article] [PubMed] [Google Scholar]
- 32.McPhail S, Haines T. Response shift, recall bias and their effect on measuring change in health-related quality of life amongst older hospital patients. Health Qual Life Outcomes. 2010;8:65. doi: 10.1186/1477-7525-8-65. [DOI] [PMC free article] [PubMed] [Google Scholar]
Associated Data
This section collects any data citations, data availability statements, or supplementary materials included in this article.
Data Availability Statement
All authors have access to raw individual patient data of this study. The data on which these analyses are based form part of the clinical trials database of the International Breast Cancer Study Group. As such they are available for external research proposals subject to the Group’s standard scientific and ethical review.