

Abstract
Polymeric systems for the immobilization and delivery of proteins have been extensively used for therapeutic and catalytic applications. While most devices have been created via solution based methods, hot melt extrusion (HME) has emerged as an alternative due to the high encapsulation efficiencies and solvent-free nature of the process. HME requires high temperatures and mechanical stresses that can result in protein aggregation and denaturation, but additives and chemical modifications have been explored to mitigate these effects. This study explores the use of solid-state ball milling to decrease protein particle size before encapsulation within poly (lactic-co-glycolic acid) (PLGA) via HME. The impact of milling on particle dispersion, retained enzymatic activity, secondary structure stability, and release was explored for lysozyme, glucose oxidase, and the virus-like particle derived from Qβ to fully understand the impact of milling on protein systems with different sizes and complexities. The results of this study describe the utility of milling to further increase the stability of protein/polymer systems prepared via HME.
Keywords: Melt extrusion, Proteins, PLGA, Ball milling, Stability
1. Introduction
Hot melt extrusion (HME) has been widely used to encapsulate active pharmaceutical ingredients within polymer matrices to create stable delivery systems for oral and parenteral administration (Ghebre-Selassie and Martin, 2003; Maniruzzaman et al., 2012; Wilson et al., 2012). This method is typically used to encapsulate small molecule drugs, however it has also been utilized to encapsulate proteinaceous material to form sustained release delivery systems (Stanković et al., 2014, 2013). HME for protein/polymer composites has largely consisted of processing solid, lyophilized proteins with poly(lactic-co-glycolic acid) (Ghalanbor et al., 2012). The processing method serves as an alternative to typical solvent based emulsion encapsulation methods, which can suffer from low encapsulation efficiences and protein denaturation (Blanco-Príeto et al., 1997; Fan et al., 2011; Wang et al., 2010). While HME produced polymer/protein materials have been successfully created and utilized for catalytic and immunoresponsive applications, the high temperatures (60–100 °C) and stresses imposed during HME can result in the aggregation and denaturation of the proteins despite the enhanced thermal stability of proteins in the solid state (Ghalanbor et al., 2010).
In our previous work, we determined the aggregation state of lysozyme within PLGA after HME and found that the retained enzymatic activity of lysozyme was directly related to the size of protein aggregates observed within the matrix (Lee et al., 2015), indicating that the retained activity is dependent on protein dispersion. Furthermore, the aggregation state directly correlated to the release profile of lysozyme from the HME prepared materials. The typical biphasic release profile of protein from PLGA under in vitro conditions was also reduced in correlation with the reduction of the aggregation state. Studies done utilizing bovine serum albumin (BSA) melt-processed with PLGA have also shown a dependency of the aggregation state within the matrix on release properties (Ghalanbor et al., 2013, 2012). Chemical modification of BSA with a fluorescein isothiocyanate (FITC) dye resulted in an increased qualitative dispersion after HME, leading to a higher total amount released from the PLGA matrix compared to unmodified BSA (Cossé et al., 2017).
These studies have clearly shown that one of the major factors in controlling the release profile and retained activity of protein samples subjected to HME is the protein aggregates that form inside of the matrix during processing. This effect can be mitigated via chemical modification of the protein, for example the covalent attachment of a hydrophobic dye or the polymer polyethylene glycol (PEG) (Lee et al., 2015). However, the reaction products can be difficult to separate, require extensive filtration or chromatography to remove unreacted components, and result in substantial purification loss (Freitas and Abrahão-Neto, 2010; Lee et al., 2003). One of the advantages of utilizing HME as an alternative to solvent based encapsulation methods is the increased encapsulation efficiency, scale-up potential, and solventless nature (Maniruzzaman et al., 2012; Repka et al., 2012).
An alternative to chemical modification is decreasing the particle size of the solid protein before HME, making it easier to fully disperse the proteins throughout the matrix and decrease the probability that protein particles will come into contact with each other and form higher order aggregates. Several methods have been utilized to decrease the particle size of proteins prior to further processing, including sieving, superfine grinding, atomization, and ball milling. Sieving is the simplest method and fractionates different particle sizes based on the ability to pass through mesh filters with defined sizes. However, sieving can have extensive loss depending on the distribution of particle sizes in the sample and the desired final size (Liu et al., 2009; Onwulata et al., 2004). Sieving also requires cleaning and changing of the sieves between batches to prevent clogging. Superfine grinding involves the grinding of powder between two discs and is effective at dramatic reduction in particle size (Muttakin et al., 2015). Studies with superfine grinding of protein samples has shown the shift of protein structure from α-helices to β-sheets after superfine grinding, indicating the process may not be suitable to more sensitive, predominately α-helical proteins for therapeutic or catalytic applications (Sun et al., 2016, 2015). Atomization through spray freeze-drying has been used to reduce protein particle size before incorporation into polymeric devices as well. The method involves forcing a solution of protein through a fine nozzle to form small droplets and subsequent lyophilization of the droplets (Wanning et al., 2015). While this method is currently used in approved pharmaceutical formulations, it can result in secondary structure disruption and is a solution based method that can have batch-to-batch variability depending on variations in liquid and gas feed rates into nozzle (Costantino et al., 2000; Johnson et al., 1997). Lastly, ball milling is a process where powders are ground between one or more typically metal balls in a grinding bowl. This process has been widely used in the food industry to reduce protein powders prior to processing (Monder and Ramstad, 1953; Roa et al., 2014).
The effect of ball milling on the dispersion of BSA within PLGA has previously been explored (Ghalanbor et al., 2012). Ball milling of the solid BSA powder before HME also resulted in increased dispersion throughout the cross-section of the cylindrical extrudate as determined via energy dispersive x-ray spectroscopy-scanning electron microscopy (EDS-SEM) (Ghalanbor et al., 2012). The milled sample release profile had less burst-release characteristics relative to the unmilled samples, exhibiting a similar influence of aggregation within the matrix on the release profiles. However, this study only correlated the aggregated states to the release profile and did not explore the effect of milling on the retained secondary structure of BSA. Ball milling has also been used with silk proteins to create microparticles via a solvent free method, and the results indicated that aggressive milling conditions can result in the loss of secondary structure (Rajkhowa et al., 2012). This result was not detrimental to the study and the protein was not subjected to HME, but it does show that care must be taken in milling solid proteins to maintain conformational stability.
The goal of this study is to explore the effect of ball milling on solid proteins before and after HME with PLGA. The 3 protein systems explored were lysozyme, glucose oxidase (GOx), and the virus-like particle derived from bacteriophage Qβ. Lysozyme and glucose oxidase were chosen as they can be aquired in solid-state quantities suitable for HME, have well defined enzymatic activities, known secondary structures, and are representative of proteins utilized in polymeric delivery systems. Lysozyme is a single sub-unit protein, 14.3 kDa in size, with no glycosylation; representative of growth factors and cytokines that have been incorporated into polymeric devices. These proteins, for example epidermal growth factor, granulocyte stimulating factor, and basic fibroblast growth factor, are all in the size range of 8–20 kDa, exist as monomeric species, and are produced recombinantly as non-glycosylated forms in E. coli making lysozyme a suitable model for their response to milling and HME (Lee et al., 2002; Michalska et al., 2010; Mirdailami et al., 2014; Wu et al., 2011; Zhang et al., 2011). GOx is ∼160 kDa in size, consists of two dimers, two flavin adenine dinucleotide (FAD) and iron cofactors, and is heavily glycosylated, representing more complex multimeric and/or cofactor dependent proteins (Bankar et al., 2009). Lastly, the virus-like particle Qβ is a 30 nm multimeric protein assembly that has been extensively researched as a drug delivery, imaging, and immunotherapy platform (Pokorski et al., 2011; Spohn et al., 2008; Zhang et al., 2017). Our previous study utilized unmilled Qβ/PLGA HME formulations to serve as single-administration vaccine devices in vivo. This work analyzes the effect of mild and aggressive ball milling of the model proteins on particle size, retained secondary structure and enzymatic activity after HME, aggregation state within the PLGA matrix, and release properties to fully understand the factors that yield optimal protein/polymer systems manufactured via HME.
2. Materials and methods
2.1. Ball milling of protein samples
Powder protein samples were milled using a Fritsch Laboratory Mini Grinder PULVERISETTE 23 equipped with a PTFE grinding bowl at 26 °C. 35–40 mg of protein powder was added to the bowl, along with one 10 mm stainless steel grinding ball. The samples were milled at either 25 or 50 Hz for 40 min and recovered. The temperature increase during milling was measured using a Minolta Land Cyclops 330S infrared thermometer and the temperature of the inside of the grinding bowl was measured directly after the 40 min of milling.
2.2. Scanning electron microscopy of protein samples
Powder samples of protein were spread onto sample holders covered with carbon tape and sputtercoated with a 5 nm thick layer of palladium. Scanning electron microscopy images were collected using a JEOL-6510LV scanning electron microscope at 1 kV. The particle size in the micrographs was determined using ImageJ software and at least 50 particles were measured from 3 images per sample. Histograms were statistically transformed to a relative percentage plot using a bin number of 10 and 100 total bins (Schneider et al., 2012).
2.3. Preparation of PLGA/Protein implants
Poly(lactic-co-glycolic acid) (PLGA) was ground manually multiple times with a mortar and pestle into a fine powder. The particle size was analyzed from SEM micrographs collected using a JEOL-6510LV scanning electron microscope at 1 kV. Sizes were determined using ImageJ software and 140 particles were measured from 3 images. Histograms were stastically transformed to a relative percentage plot using a bin number of 10 and 100 total bins. was mixed with the 10%w/w of lysozyme or glucose oxidase powder sample, or 1%w/w of Qβ powder sample, and mixed via repeated vortexing in a 2 mL Eppendorf tube. A custom built aluminum syringe scale ram extruder fitting a polypropylene 1 mL Norm-Ject syringe was used for melt processing of the blends to minimize material input. The syringe ram extruder system consisted of a cylinder with a circular 1 mm exit diameter that was wrapped with heating tape combined with a digital control element to provide a constant temperature. Roughly 200 mg of the PLGA/protein blends were heated at 95 °C for 10 min. The melted PLGA/protein blend was then pushed through the die using a syringe pump with a velocity of 3 mm s−1 (∼2.35 mm3 s−1 volumetric flow rate) and the resulting cylindrical implants had diameters ranging from 1.0–1.3 mm.
2.4. EDS-SEM
The distribution of proteins in the implant cross section was determined by mapping the characteristic X-ray peak of nitrogen utilizing energy dispersive x-ray spectroscopy coupled with scanning electron microscropy (EDS-SEM). Samples were fractured and sputter coated with a 50 nm thick layer of palladium. EDS-SEM imaging was performed using a Helios Nanolab 650 SEM combined with an Oxford X-Max 80 mm2 Silicon Drift Detector XEDS system. SEM images were collected at 2 kV, 0.2 nA, and a working distance of 4.2 mm. Elemental spectra were collected at 5 kV, 1.6 nA for 1,000,000 counts. Images were subjected to signal thresholding using ImageJ to reduce noise and highlight aggregated regions using the Intermodes method of thresholding (Prewitt and Mendelsohn, 1966).
2.5. Protein recovery from implants
In order to characterize the total protein population in the extruded samples, recovery from implants was performed by dissolving ∼50 mg of protein/PLGA sample in 1 mL of ethyl acetate for 30 min. This was followed by centrifugation for 5 min at 5000 rpm using an Eppendorf 5810 R centrifuge with a fixed angle rotor, based on a previously established protocol for organic extraction of active lysozyme (Ghalanbor et al., 2010). The supernatant was decanted and the process was repeated two more times. The remaining solids were dried under vacuum at room temperature for 24 h and solid protein recovered was re-suspended in PBS for 24 h at 4 °C. PLGA was effectively removed via this process as determined by the lack of a carbonyl signal from PLGA at 1744 cm−1 in the FTIR spectra of the recovered proteins. Proteins were typically recovered at 85–90% of the calculated maximum that could be recovered based on the weight percent loading level. The protein loss was likely due to small variations in loading level and incidental removal of solid protein during ethyl acetate decantation.
2.6. Release studies
Release studies were conducted on samples of the melt processed implants (15–18 mg, ∼1.5 cm long, n = 3) for all samples. Samples were placed into 2 mL Eppendorf tubes with 0.2 mL of Gibco 1X phosphate buffered saline (pH 7.4, 0.01 M phosphate, 0.137 M NaCl, 0.0027 M KCl) with 0.01 wt% sodium azide and incubated at 37 °C, 90% relative humidity. Aliquots of 0.175 mL were removed at each time point and replaced with fresh buffer. The concentration of lysozyme and glucose oxidase released was quantified via 280 nm absorbance. The Qβ concentration at each time point was determined via Bradford assay with comparison to a freshly prepared bovine serum albumin standard curve. Qβ released over the first 10 days from samples prepared with 25 Hz milled Qβ was pooled and concentrated using 3 kDa MWCO centrifugal filters and analyzed via DLS and FPLC. The release studies were stopped when the implants were small fragments and unable to be separated from the release medium.
3. Results and discussion
3.1. Ball-milling of protein powders
Dry powders of lysozyme, GOx, and Qβ were initially milled using a miniature ball-mill to break-up and decrease the particle size. Lysozyme and GOx were used as received after drying and Qβ was used as a lyophilized powder after expression and purification. Milling of lysozyme and GOx was carried out at 25 and 50 Hz for 40 min to represent mild and aggressive milling conditions. A previous study milling recombinant granulocyte colony stimulating factor utilized a frequency of 30 s−1, thus 25 and 50 Hz were chosen to explore the effects of lower and higher intensity forces in the milling process (Etzl et al., 2014). Milling at 25 Hz yielded a fluffy powder for both proteins, while increasing the frequency to 50 Hz resulted in solid large flakes of protein (Fig. A1). Analysis of the temperature rise inside of the grinding bowl after milling for 40 min utilizing an infrared thermometer indicated a slight temperature rise from 21.1 °C to 25.5 °C at 25 Hz, and a large rise in temperature from 21.1 °C to 42.1 °C at 50 Hz. The larger temperature rise at 50 Hz combined with increased mechanical stresses is likely the reason for the formation and coalescence of protein particles into larger flakes.
Differential scanning calorimetry (DSC) of lysozyme and GOx indicated strong melting endotherms at 196.5 and 202.8 °C respectively (Fig. A2 (A) and (B)), which we have previously assigned to total denaturation of the protein secondary structure (Lee et al., 2015). In order to analyze whether exposure to higher temperatures over time causes thermal denaturation, we incubated lysozyme and GOx in the DSC at 42 °C for 40 min (Fig. A2(C) and (D)). No noticeable thermal transitions or fluctuations were observed, thus both the thermal energy increase and higher mechanical stresses are necessary to cause macroscopic protein aggregation and flake formation during the milling process.
3.2. SEM size and morphology analysis of milled proteins
The morphology and particle size of the unmilled, 25 Hz milled, and 50 Hz samples of lysozyme and GOx were analyzed via scanning electron microscopy (SEM). Prior to milling, lysozyme consisted of spheres in the size range of 9.8–71.9 μm, with an average size of 27.6 ± 14.5 μm (Fig. 1(A)). After milling at 25 Hz, the spheres were reduced particles in the size range of 11.5–61 μm, with and average size of 25.9 ± 12.3 μm (Fig. 1(B)). Unmilled GOx consisted of flakes with lengths in the range of 21.5–206 μm with an average length of 71.5 ± 39.1 μm and a typical width of 2–5 μm (Fig. 1(E)). Milling of GOx at 25 Hz yielded small particles in the range of 6.7–45.6 μm with an average size of 15 ± 6 μm (Fig. 1(F)). Histogram analysis of the size measurements indicate a shift in population to smaller sizes after milling at 25 Hz for both lysozyme and GOx, indicating that the milling conditions were suitable for breaking up particulates that can be more easily dispersed during melt-encapsulation (Fig. 1(D) and (H)). However, milling at 50 Hz yielded large macroscopic flakes for both lysozyme and GOx. Analysis via SEM also indicated the consolidation of particles into flakes after milling at 50 Hz (Fig. 1(C) and (G)). This result is likely due to the temperature rise previously mentioned and increased mechanical stresses, resulting in protein aggregation and denaturing during milling. Based on this initial result, the milling of Qβ was only carried out at 25 Hz to avoid the increased temperatures at 50 Hz.
Fig. 1.

SEM micrographs of (A.) unmilled lysozyme, (B.) 25 Hz milled lysozyme, and (C.) 50 Hz milled lysozyme. (D.) Relative percentage plot of lysozyme particle sizes for unmilled and 25 Hz milled lysozyme determined from the SEM micrographs. SEM micrographs of (E.) Unmilled GOx, (F.) 25 Hz milled GOx, and (G.) 50 Hz milled GOx. (H.) Relative percentage plot of GOx particle sizes for unmilled and 25 Hz milled GOx determined from the SEM micrographs Unmilled GOx was represented in the relative percentage plot as flake length, while 25 Hz milled GOx was represented as the diameter of particle.
Milling of lyophilized Qβ at 25 Hz yielded a white powder with no large flakes noticeable. SEM analysis of the unmilled lyophilized Qβ indicated a small 1–25 μm sized particulate morphology that formed larger clusters (Fig. 2(A)). Milling at 25 Hz resulted in the consolidation of the small particulates into 25–100 μm sized flakes and an overall increase in particle size (Fig. 2(B) and (C)). The appearance of flakes after milling of Qβ at 25 Hz indicated that even mild milling conditions may have a negative effect on lyophilized Qβ, potentially due to the increased size and rigidity of the protein virus-like particle when compared to lysozyme and GOx.
Fig. 2.

SEM micrographs of (A.) lyophilized unmilled Qβ and (B.) 25 Hz milled Qβ. (C.) Relative percentage plot of Qβ particle sizes for unmilled and 25 Hz milled Qβ determined from the SEM micrographs Unmilled Qβ was represented in the relative percentage plot as the diameter of particles, while 25 Hz milled Qβ was represented as the flake length.
3.3. Spectroscopic analysis of milled lysozyme and GOx
In order to investigate the effect of milling on the secondary structure of lysozyme and GOx, circular dichroism (CD) spectroscopy and fluorescence spectroscopy were carried out on the soluble protein fraction and Fourier transform-infrared (FTIR) spectroscopy was carried out on the milled powders. CD spectroscopy of the lysozyme samples indicated full retention of secondary structure for lysozyme milled at 25 Hz, but a 13.3% loss in alpha helicity signal at 208 nm after milling at 50 Hz (Fig. 3(A)). This loss in secondary structure for the soluble fraction was attributed to the macroscopic aggregation and flake morphology observed in the SEM. The formation of macroscopic flakes in response to thermal and mechanical stress was similar to free standing solid protein based films, where proteins reorganize to stabilize adjacent proteins via hydrogen bonding, electrostatic, and hydrophobic interactions (Hammann and Schmid, 2014). Effective stabilization of proteins into a film structure can cause protein denaturation as the proteins unfold to more efficiently stabilize the assembly. The hydrophobic nature of the Teflon grinding bowl may also induce further protein unfolding, as proteins at hydrophobic interfaces denature to minimize contact of hydrophilic residues with the surface (Wu et al., 1993). Furthermore, protein films have been shown to denature under similar temperatures and time scales present in the 50 Hz milling process (Tian et al., 2010).
Fig. 3.

(A.) CD spectra of lysozyme samples before and after milling. (B.) Tryptophan fluorescence spectra of lysozyme samples before and after milling (λex = 278 nm). (C.) CD spectra of GOx samples before and after milling. (D.) Tryptophan fluorescence spectra of GOx samples before and after milling (λex = 278 nm). The milled samples were the average and standard deviation of measurements from two batches of milled protein.
Fluorescence spectroscopy, which is indicative of the chemical environment of the lysozyme tryptophan residues, indicated a decrease in fluorescence by 12.8% relative to the native sample only after milling at 50 Hz in good agreement with the CD spectroscopy result (Fig. 3(B)). FTIR spectroscopy of the milled powders yielded similar results, with the amide I and II peaks largely preserved after milling, but with the appearance of two peaks at 1225 and 1150 cm−1 for the 50 Hz milled lysozyme (Fig. A3 (A)). These peaks can be attributed to an increase in random coil and are a further indication that the high mechanical and thermal stresses imposed at 50 Hz result in protein denaturation (Cai and Singh, 1999). The disorder in the secondary structure observerd in the solid-state FTIR spectra of lysozyme was not exhibited in the solubilized lysozyme samples analyzed via CD and fluorescence spectroscopy. This was likely due to refolding upon rehydration, as lysozyme exhibits reversible unfolding in solution over a temperature range of 20–64 °C (Meersman et al., 2010).
The CD spectra of GOx before and after milling indicated that milling at both 25 and 50 Hz resulted in loss of alpha helicity of the protein samples (Fig. 3(C)). GOx maintained most of the original secondary structure after milling at 25 Hz, with a loss of 4.2% alpha helicity signal. Milling at 50 Hz had a drastic decrease in alpha helicity signal, with a decrease by 59.7%. Compared to lysozyme, it was evident from the CD results that GOx was more sensitive to the mechanical and thermal energy imposed during the milling process. This may be due to the more complex assembly of two monomeric units forming one GOx unit, with destabilization of the β-sheet assembly that connects the dimers potentially resulting in disassembly and denaturation of the monomeric unit. Fluorescence spectroscopy of the tryptophan residues indicated minimal change after milling at 25 Hz, but a large decrease by 50.5% in fluorescence after 50 Hz milling consistent with the loss of secondary structure seen in the CD spectra (Fig. 3(D)). GOx also contains two flavin adenine dinucleotide (FAD) cofactors per protein that have a unique fluorescent signature when excited at 450 nm. The fluorescent signal of FAD is quenched when it resides in the active site of GOx, thus the fluorescence of FAD was used to probe whether the GOx retained the cofactor necessary for activity (Aliverti et al., 1999; Swoboda and Massey, 1966). Minimal fluorescent signal was observed for native GOx and GOx milled at 25 Hz had a small increase in fluorescent signal, indicating some loss of FAD for the 25 Hz milled sample (Fig. A4 (A)). GOx milled at 50 Hz had a 30-fold increase in FAD fluorescence, indicating significant disassociation of FAD from the milled GOx which is likely a consequence of the denaturation observed via CD and tryptophan fluorescence. Analysis of the GOx samples via FTIR did not indicate any significant changes in secondary structure via the amide I and II bands (Fig. A3(B)). The random coil band at 1225 cm−1 exhibited some broadening relative to the adjacent bands for 50 Hz milled GOx, however there was not a drastic increase compared to the result seen with 50 Hz lysozyme. This result indicated that the 50 Hz milled GOx did not disrupt secondary structure as much as 50 Hz lysozyme when analyzed in the solid state. However, upon rehydration there was an increase in denaturation potentially due to dimer disassociation upon rehydration and loss of FAD. The presence of the sugars on glycosylated GOx may shield the secondary structures from denaturation in the solid state, but the multimeric assembly denatured more readily once in the rehydrated state (Akhtar et al., 2002).
3.4. Enzymatic activity of milled lysozyme and GOx
To fully understand the impact of solid-state milling, the enzymatic activities of lysozyme and GOx were measured before and after milling. Protein denaturation results in loss of the active site conformation and a decrease in activity. While secondary structure is indicative of protein stability, it is not the only factor that can impact enzymatic activity. Mechanical and thermal stresses can cause chemical reactions to occur on or around the active site that can result in lower activity. The enzymatic lytic activity of lysozyme milled at 25 Hz and 50 Hz were 92.4 ± 1.9% and 67.1 ± 2.6% respectively relative to the activity of unmilled lysozyme (Fig. 4(A)). The activity of lysozyme milled at 25 Hz was ∼8% lower than native lysozyme, despite spectroscopic and fluorescence analysis that indicated full retention of secondary structure. Furthermore, the activity of 50 Hz milled lysozyme decreased by ∼30% but spectroscopic analysis only indicated a loss in structure by 13.3%. Thus, the resulting loss in activity is likely due to thermal and mechanical aggregation of lysozyme. The enzymatic reduction of glucose to glucolactone activity by GOx milled at 25 Hz and 50 Hz were 87.3 ± 5.91% and 48.0 ± 2.57% respectively relative to unmilled GOx (Fig. 4(B)). The activities of GOx correlated more directly to the loss of secondary structure measured via CD and the disassociation of FAD measured via fluorescence spectroscopy. This result suggests that the loss in activity of GOx is directly a result of denaturation and cofactor loss, instead of potential chemical modification of the protein. The glycosylation of GOx likely shielded GOx from reacting with other proteins during milling, as native and synthetic glycosylation of proteins has previously been shown to enhance protein chemical and physical stability (Krishnan et al., 2002; Mancini et al., 2012; Solá et al., 2006; Wang et al., 1996). This stabilization protected the active site from reaction, but the GOx assembly denatured and lost activity through loss of FAD and alpha helix disruption.
Fig. 4.

Enzymatic activity of (A.) lysozyme samples before and after milling and (B.) GOx samples before and after milling. All measurements were normalized to a percentage relative to the unmilled samples and reported as an average and standard deviation of 6 measurements. The milled samples were the average and standard deviation of measurements from two batches of milled protein. *p < 0.025 and determined via a two-tailed t-test.
3.5. Size characterization of milled Qβ
The virus-like particle Qβ was analyzed for particle aggregation and integrity before and after milling at 25 Hz via dynamic light scattering (DLS) and fast protein liquid chromatography (FPLC). Prior to milling, Qβ yielded a single peak with a hydrodynamic radius of 15.1 nm as measured via DLS and a single Gaussian peak in the FPLC chromatogram (Fig. 5(A) and (B)). Transmission electron microscopy (TEM) images also indicated virus-like particles of the correct shape and size (Fig. 5(C)). DLS of Qβ after milling at 25 Hz had a distribution skewed towards some larger species, with a mass average hydrodynamic radius of 17.6 nm (Fig. 5(D)). This result indicated that milling at 25 Hz causes lower-order aggregation of Qβ particles. This result is also verified via FPLC, with a slight broadening of the Gaussian peak towards lower elution volumes indicative of aggregated species (Fig. 5(E)), as well as broadening toward higher elution volumes suggesting the existence of partially disassembled particles. TEM of the particles after milling indicated a skewing of shape of the particles from icosahedral to elliptical, likely due to the imposition of mechanical stress on the particles during milling (Fig. 5(F)).
Fig. 5.

(A.) DLS mass percentage histogram, (B.) FPLC size-exclusion chromatogram, and (C.) TEM micrograph of unmilled Qβ (D.) DLS mass percentage histogram, (E.) FPLC size-exclusion chromatogram, and (F.) TEM micrograph of 25 Hz milled Qβ.
3.6. HME and EDS-SEM analysis of PLGA/protein blends
After full analysis of the effect of milling on the protein systems, all milled samples were subjected to melt-encapsulation with PLGA at 95 °C for 10 min utilizing an in-house built syringe-die ram extrusion device with a 1 mm cylindrical die. The PLGA used had a size of 60.6 ± 43.1 μm in average length as determined from SEM micrographs (Fig. A5). The size of the PLGA particles was up to 4 times larger than the protein particles, which may enhance some segregation and aggregation within the matrix. However, the PLGA melts into a relatively low viscosity melt at 95 °C (∼120 Pa s) and will easily flow around the protein particles during the heating and applied shear during melt-encapsulation. Thus, we expected protein aggregation to be dependent on the protein particle sizes and surface area available for molten PLGA encapsulation rather than the solid PLGA size. Lysozyme and GOx were extruded at 10%w/w and Qβ was extruded at 1%w/w with PLGA comprising the rest of the material. The conditions were chosen from previous studies with lysozyme and Qβ systems that yielded consistent cylindrical extrudates. All samples were successfully processed via this method, with unmilled and 25 Hz milled protein additives homogeneously dispersed throughout the length of the extrudate. Proteins milled at 50 Hz had inhomogeneity throughout the extrudate with some protein-rich areas identified visually. We speculate that protein in contact with the polymer melt does not readily interact with the hydrophobic polymer due to unfavorable thermodynamic interactions at the protein-polymer interface. However, proteins in contact with adjacent proteins would form protein aggregates that are insoluble and denatured, thus aggregated regions in the polymer matrix were assumed to be correlated to lowered protein stability (Rajagopal et al., 2013).
Energy dispersive x-ray spectroscopy coupled with scanning electron microscopy (EDS-SEM) was utilized to analyze the aggregation of proteins within the PLGA matrix after melt-encapsulation. EDS-SEM separates and maps distinct elemental signals throughout an SEM image and allows for the visualization of protein location throughout the cross-section of an extrudate. Mapping the nitrogen signal from lysozyme samples processed with PLGA yielded a direct relationship between particle sizing after milling and the aggregation within the PLGA matrix (Fig. 6 and A6). Large circular aggregates and areas devoid of protein signal were observable for the unmilled lysozyme, indicating that aggregation and segregation occured within the matrix. Milling at 25 Hz disrupted the formation of the circular aggregates and the protein became evenly dispersed throughout the cross-section. This is due to the break-up of the spherical particles into smaller particles though the milling process allowing for more efficient dispersion during HME. Lysozyme milled at 50 Hz had a large aggregated region, corresponding to the inefficient dispersion of the larger flake morphologies observed after milling (Fig. 6(C)). A similar trend was observed for the GOx samples subjected to HME, with unmilled GOx having flake structures within the matrix attributed to the flake morphology of the unmilled GOx before HME. The flake aggregates were not observable in the 25 Hz milled GOx samples and a more evenly dispersed protein population was evident in the EDS map. GOx milled at 50 Hz, exhibited similarly large aggregated region as 50 Hz milled lysozyme again due to the aggregated flake morphology seen in the SEM after milling. EDS maps with the aggregates highlighted through image thresholding are shown in Fig. A7.
Fig. 6.

EDS maps of the nitrogen peak for PLGA processed with 10%w/w of (A.) unmilled lysozyme, (B.) 25 Hz milled lysozyme, (C.) 50 Hz milled lysozyme, (D.) unmilled GOx, (E.) 25 Hz milled GOx, (F.) 50 Hz milled GOx. The nitrogen signal is shown in green.
EDS analysis of Qβ samples subjected to HME with PLGA was performed and both the nitrogen and sulfur signals were mapped due to the higher sulfur content of Qβ relative to lysozyme and GOx (Fig. 7 and A8). Unmilled Qβ did not exhibit pockets of aggregated protein, but did exhibit voids without protein present. Milling Qβ at 25 Hz prior to HME resulted in a completely dispersed protein distribution with no voids and aggregation.
Fig. 7.

EDS maps of the nitrogen peak for PLGA processed with 1%w/w of (A.) unmilled Qβ and (C.) 25 Hz milled Qβ. EDS maps of the sulfur peak for PLGA processed with 1%w/w of (B.) unmilled Qβ and (D.) 25 Hz milled Qβ. The nitrogen signal was shown in green and the sulfur signal in purple. (For interpretation of the references to colour in this figure legend, the reader is referred to the web version of this article.)
3.7. Aggregation analysis of Qβ after HME
The aggregation and integrity of Qβ after HME that were extracted and resuspended from the extrudates was assessed via DLS and FPLC. Unmilled Qβ exhibited some aggregated species in the DLS histogram, with a mass average peak at 117.5 nm corresponding to the aggregated species (Fig. 8(A)), as well as the peaks associated with single particles at 21.9 nm. The FPLC chromatogram also indicated aggregation with a sharp peak at the void volume of 9.5 mL (Fig. 8(B)). The appearance and degree of aggregation is consistent with previous results utilizing unmilled Qβ under these processing conditions. Analysis of unmilled Qβ via TEM after HME (Fig. 8(C)) also indicated intact particles of the correct size, again consistent with previous studies. Qβ milled at 25 Hz exhibited less aggregation behavior via the DLS histogram, but also had a larger percentage of signal in the lower nanometer range (Fig. 8(D)). The FPLC chromatogram further verified this, with a diminished aggregate peak at the void volume (Fig. 8(E)). The large peak at 21 mL corresponded to free coat protein dimers from the Qβ assembly and indicated that milling at 25 Hz results in extensive particle disassembly during HME. This phenomenon can be attributed to the partial disassembly induced by the initial milling at 25 Hz, as evidenced by the peak broadening towards higher elution volumes in the FPLC chromatogram. TEM analysis of the milled Qβ after HME indicated some intact particles, with a large degree of disassembled proteins heavily stained in the lower right corner of the micrograph (Fig. 8(F)). The negative effects of milling on Qβ may be attributed to the complexity and higher rigidity of the icosahedral assembly relative to lysozyme and GOx, with 180 copies of protein covalently assembled for Qβ versus monomeric and dimeric assemblies for lysozyme and GOx respectively. The increased rigidity would likely generate more friction during application of mechanical stress and dissipate energy poorly, leading to breakage and partial disassembly of the protein assembly. Thus, the enhanced dispersion observed for Qβ after milling in the EDS map is likely a function of the larger nanoparticle being broken down into more easily dispersed small proteins instead of reduced macroscopic particle size.
Fig. 8.
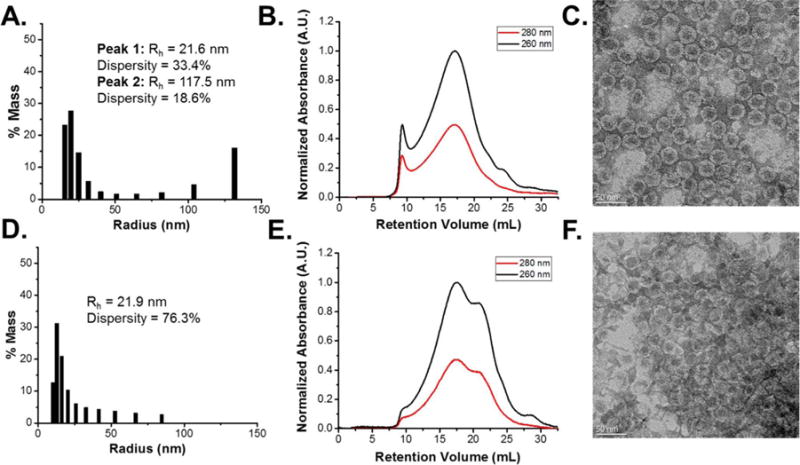
(A.) DLS mass percentage histogram, (B.) FPLC size-exclusion chromatogram, and (C.) TEM micrograph of Qβ recovered after HME with PLGA. (D.) DLS mass percentage histogram, (E.) FPLC size-exclusion chromatogram, and (F.) TEM micrograph of 25 Hz milled Qβ recovered after HME with PLGA.
3.8. Enzymatic activity of lysozyme and GOx after HME
We have previously found a direct correlation between the aggregation of lysozyme within PLGA with the retained enzymatic activity of the recovered protein (Lee et al., 2015). Therefore, lysozyme and GOx were extracted from the extrudates and the enzymatic activity was measured and compared to native protein (Fig. 9). After HME, unmilled lysozyme retained 54.0 ± 2.03% activity relative to native lysozyme. Milling at 25 Hz and 50 Hz prior to HME yielded lysozyme with 76.7 ± 1.94% and 53.8 ± 1.94% retained activity respectively relative to native lysozyme. Therefore, milling at 25 Hz increased the retained activity by ∼30% over unmilled lysozyme, which can be attributed to the decrease in particle size observed via SEM and the increased dispersion observed via EDS. Lysozyme milled at 50 Hz had no beneficial effects versus unmilled lysozyme. The activity assays of GOx after HME revealed a similar trend, with unmilled GOx retaining 36.1 ± 3.43% activity while 25 Hz and 50 Hz milled GOx retained 59.8 ± 2.56 and 18.0 ± 2.70% activity respectively relative to native GOx. The enhanced retained activity of GOx milled at 25 Hz was again correlated to the increased dispersion observed in the EDS map.
Fig. 9.
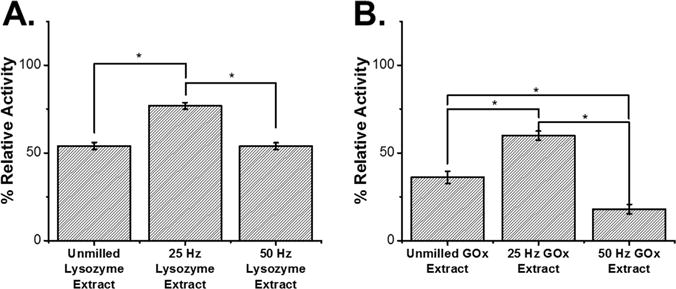
Enzymatic activity of (A.) lysozyme samples after recovery from PLGA samples prepared via HME and (B.) GOx samples after recovery from PLGA samples prepared via HME. All measurements were normalized to a percentage relative to the unmilled samples and reported as an average and standard deviation of 6 measurements. The unmilled extracts were the average and standard deviation of samples from two HME batches. The milled samples were the average and standard deviation of measurements from two batches of milled protein subjected to HME. *p < 0.01 determined via a two-tailed t-test and all samples had p < 0.01 relative to the native enzyme before processing.
3.9. Spectroscopic analysis of lysozyme and GOx after HME
To further explore the effect of milling and factors affecting the retained activity of lysozyme and GOx, the secondary structure and cofactor disassociation were again explored via CD, FTIR, and fluorescence spectroscopy. Both the unmilled and 50 Hz milled lysozyme extract exhibited similar CD spectra, with a loss of 26.3 and 38.3% of the alpha helix signal relative to native lysozyme (Fig. 10(A)). The tryptophan fluorescence signal losses were 5.4 and 15.9% for unmilled and 50 Hz milled lysozyme, respectively, indicating similar trends in unfolding around the active site as protein denaturation between the two samples (Fig. 10(B)). The FTIR spectra did not indicate a change in the amide peaks and the random coil peaks were maintained in the 50 Hz samples after HME (Fig. A9 (A)). The reason for no major changes in the solid state FTIR spectra is likely due to a lack of sensitivity in amide signal in the solid state that would allow to distinguish between alpha helix and beta sheet signals. The loss of active site conformation and secondary structure denaturation both contributed to the similar levels of retained activity exhibited by the lysozyme samples after HME. The 25 Hz milled samples exhibited a loss of 4.5% alpha helicity and a 8.3% loss in tryptophan fluorescence. The higher retention of secondary structure and active site conformation are the reason 25 Hz milled lysozyme retains 29% more activity than unmilled lysozyme, and the increased dispersion within the matrix for 25 Hz milled lysozyme decreased the contact between lysozyme particles and unfolding during aggregation. Both unmilled and 50 Hz milled lysozyme exhibited aggregated states in the matrix, causing protein unfolding and loss of activity.
Fig. 10.

(A.) CD spectra of lysozyme after recovery from PLGA samples prepared via HME. (B.) Tryptophan fluorescence spectra of lysozyme after recovery from PLGA samples prepared via HME (λex = 278 nm). (C.) CD spectra of GOx samples after recovery from PLGA samples prepared via HME. (D.) Tryptophan fluorescence spectra of GOx samples after recovery from PLGA samples prepared via HME (λex = 278 nm). The unmilled extracts were the average and standard deviation of samples from two HME batches. The milled samples were the average and standard deviation of measurements from two batches of milled protein subjected to HME.
The secondary structure and fluorescence spectroscopy of GOx exhibited similar results. Unmilled GOx subjected to HME lost 28.8% of the alpha helix signal, while 25 Hz milled GOx only lost 20.8% (Fig. 10(C)). GOx milled at 50 Hz and subjected to HME yielded a CD spectra that indicated almost complete random coil and denaturation of the protein (Zoldák et al., 2004). Tryptophan fluorescence yielded a 30 and 40% decrease in signal for unmilled and 50 Hz milled GOx respectively (Fig. 10(D)). There was no significant change in the 25 Hz milled GOx sample. The tryptophan fluorescence and CD results taken together indicate that, while there is some denaturation for 25 Hz milled GOx and extensive denaturation for unmilled and 50 Hz milled GOx, the decreases seen in secondary structure cannot alone account for all of the loss in activity seen in all samples. Fluorescence analysis of FAD disassociation further accounted for the loss in activity, with a 41, 7 and 137-fold increase in FAD fluorescence for unmilled, 25 Hz milled, and 50 Hz milled GOx, respectively (Fig. A4(B)). There was no significant difference in the FTIR spectra for all solid samples, due to factors previously described (Fig. A9(B)). Therefore, the factors affecting GOx stability during HME are a combination of the particle size prior to HME, the amount of denaturation induced by thermal aggregation within the matrix, and the amount of FAD disassociated during this process. Milling the flake particulates of native GOx into smaller particles under mild conditions at 25 Hz mitigated aggregation within the matrix, promoted secondary structure stability, and maintained the FAD cofactor binding to the active site.
3.10. Effect of milling on in vitro protein release
Lastly, the effects of milling on the release of all protein systems from the extrudates was investigated. Milling and protein particle size has previously been shown to decrease the burst release for BSA systems encapsulated with PLGA via HME (Ghalanbor et al., 2013, 2012). However, the effect on the full release profile has not been fully studied for proteins of different sizes and glycosylation states. The release profiles of lysozyme over the first 15 days showed a clear dependence of the milling on the diffusional release phase (Fig. 11(A)). Unmilled and lysozyme milled at 25 Hz had relatively low burst release with no significant difference between the two samples, however the 25 Hz milled lysozyme had a 10% increase in the amount of protein released over the diffusional phase. This was attributed to the smaller particle sizes and aggregates within the matrix for the 25 Hz milled lysozyme being able to more easily diffuse out through the pores formed after initial hydration, while the more aggregated unmilled lysozyme had larger particles that were trapped within the matrix. 50 Hz milled lysozyme had a large burst release of 10% followed by release up to 50% over the diffusional phase. The larger release in the burst and diffusional phase was due to the larger lysozyme aggregates releasing as cohesive particles during the initial hydration as a result of the segregation within the PLGA matrix. Following the burst release, the remaining lysozyme in the matrix was able to diffuse out through the large pores left by the larger aggregates releasing during the burst release. Thus, milling and control over the size of aggregates and segregation within the PLGA matrix directly impacted the release behavior of lysozyme over the burst and diffusional phase. There was no clear delineation between the diffusional and erosion phase of the 50 Hz milled lysozyme sample, likely as a result of the large pores formed during the burst release phase allowing for efficient hydration and hydrolysis of the interior of the PLGA cylinder. The erosion phase for both unmilled lysozyme and 25 Hz lysozyme occurred at 15 days and a further 5 and 10% of the total protein was released for the respective samples. The increased release over the erosion phase for 25 Hz milled lysozyme was again due to the smaller particles being more readily released through the eroding matrix, while the lower percentage released for unmilled lysozyme was due to larger aggregates remaining trapped within the matrix. The release completely stopped at 35 days for all samples, and the incomplete release could be due to ionic interactions between the polymer and lysozyme, non-specific protein adsorption, further protein aggregation and insolubility, or protein remaining trapped in crystalline poly(lactic acid) sections of the polymer (Giteau et al., 2008). A previous study has demonstrated that increasing ionic strength of the release medium increases lysozyme release from PLGA materials (Park et al., 1998). Lysozyme has a net positive charge at pH 7.4 that will interact with the negatively charged carboxylic acid groups of PLGA, and increasing the NaCl concentration in the release medium shields these interactions. However, variations in ionic strength are not relevant to release under the physiological conditions that were modeled in this study.
Fig. 11.

Release profiles from PLGA samples prepared via HME for (A.) lysozyme, (B.) GOx, and (C.) Qβ. All measurements were normalized via the total protein content per sample are reported as an average and standard deviation of 3 samples.
The release profiles of GOx samples encapsulated with PLGA did not exhibit a clear dependency on milling of the protein before GOx (Fig. 11(B)). Both unmilled and 25 Hz milled GOx released 8% of the total protein over the burst and diffusional phase, 50 Hz milled GOx released 4% over the burst and diffusional phase. The erosion phase of release had similar release profiles for all samples within experimental error and there was no significant difference between the samples regardless of milling. The lack of effect of milling on the release of GOx indicated that the particle size and protein aggregation within the matrix was not the predominate factor governing release. The glycosylation of GOx may be the reason for the lower amount of GOx released overall relative to lysozyme and the indifference to milling. Upon hydration of the GOx rich regions in the polymer matrix, sugars on adjacent proteins would hydrogen bond with one another forming clusters. This clustering would hinder diffusion of GOx through channels within PLGA and result in the low release observed. There is also the potential for increased hydrogen bonding between the sugars on the surface of GOx and carboxylic acid units formed during PLGA degradation, resulting in increased retention of GOx within the PLGA cylinder. A previous study has demonstrated that synthetic glycosylation of a protein with a long sugar that was encapsulated within PLGA hindered the release of the protein, potentially due to similar mechanisms (Flores-Fernández and Griebenow, 2012). The slightly lower release of 50 Hz milled GOx was likely due to the localization of more GOx in one area, resulting in larger clusters of protein due to hydrogen bonding and further diminishment of release. This effect was not observed for lysozyme, as lysozyme is positively charged under the release conditions and would repulse nearby proteins rather than bond with them. This would cause the release of lysozyme to be more dependent on the particle size of the protein within the matrix and diffusion throughout the pores. However, due to the ionic interactions between PLGA and lysozyme there would be a retardation in release as PLGA is hydrolyzed to liberate more carboxylic acid groups. This was likely the cause of halting release after 20 days as enough carboxylic acid was present to prevent further release of the lysozyme. The factors of protein adsorption, interactions with PLGA, GOx hydrogen bonding, and protein insolubility would also contribute to the incomplete release of GOx from the PLGA extrudates.
The release profile of Qβ samples from the PLGA samples demonstrated a dependency on the milling of Qβ, but were a function of the particle disassociation of Qβ after milling and HME (Fig. 11(C)). Unmilled Qβ had an induction period of 5 days before the diffusion phase and 15% of the total Qβ was released. The higher release relative to GOx was due to the lower loading level of Qβ, 1%w/w versus 10%w/w for GOx, which yielded enhanced dispersion in the matrix after HME. The erosion phase released up to 60% of the total Qβ until the release study was stopped. The sustained release was likely due to Qβ having a net negative charge on the surface, which would repulse nearby particles and the carboxylic acids from PLGA, allowing for minimal interaction with other particles and the polymer that would hinder diffusion from the matrix (Armanious et al., 2016). Large pores that would also be left behind after Qβ diffused out of the matrix, allowing for more protein to diffuse out as erosion accelerates.
The release profile of Qβ milled at 25 Hz was indicative not of the release of intact virus-like particles, but predominantly release of disassociated coat protein dimers. The Qβ coat protein dimer is 24.2 kDa and roughly the size of lysozyme (Golmohammadi et al., 1996). The released protein was analyzed via DLS and FPLC to verify that the released samples were disassociated coat protein (Fig. A10). The DLS result indicated the released protein was denatured proteins and protein assemblies in the size range of 0.7–6 nm in radii and the FPLC result only had protein eluting at the retention volume of low molecular weight proteins. Thus, the release profile more closely resembles the release profile of 25 Hz milled lysozyme, where a smaller protein is evenly dispersed throughout the PLGA matrix. The release of the 25 Hz milled Qβ is consistent with the dispersed lysozyme result and is further indication that moderate milling of Qβ has adverse results of particle breakup and non-linear release profiles.
4. Conclusions
The results of this study indicate that moderate ball milling at 25 Hz is a viable technique to enhance the dispersion, conformational stability, retained enzymatic activity, and release of small and moderately sized proteins after HME with PLGA. Milling at 25 Hz for lysozyme and GOx enhanced the retained activity by 23 and 20% respectively and the solid-state dispersion within the matrix was improved as measured via EDS. These results have implications in enhancing the stability of delivery systems manufactured via HME for small protein therapeutics, without chemical modification or additives. The results for GOx and the low release seen indicated that larger, complex, glycosylated proteins are not suitable for encapsulation and subsequent release despite the milling. However, the increased dispersion and enzymatic activity exhibited by GOx show the HME prepared system can have potential applications in heterogeneous catalytic or sensor systems. The milling of higher order rigid protein assemblies, such as Qβ, was found to have no positive effects for stability or release. This was likely due to the inability of the icosahedral structure to dissipate the applied energy, leading to bond breakage and particle disruption. However, unmilled Qβ was well dispersed and maintained particle structure after HME, indicating that milling was unnecessary for this system. While milling was shown to be effective in this exploratory study, protein stability is a kinetic process and milling time will be explored in the future to further develop processing parameters that include both intensity and kinetics into protein stability during ball milling. Overall, ball milling was shown to be a fast, efficient, solventless process to enhance the biophysical, enzymatic, and release properties for various protein systems encapsulated with PLGA via HME.
Supplementary Material
Acknowledgments
This research was funded in part by a grant from Clinical and Translational Science Collaborative of Cleveland, 4UL1TR000439 from the National Center for Advancing Translational Sciences (NCATS) component of the National Institutes of Health (to J.K.P.). The authors would like to thank Dr. Yinghua Chen and the Protein Expression Purification Crystallization and Molecular Biophysics Core of department of Physiology and Biophysics Core (Case Western Reserve University, Cleveland) for assistance with DLS measurement. The authors would like to thank the Swagelok Center for Surface Analysis of Materials and Dr. Nanthawan Avishai for the EDX-SEM facilities and Dr. Danqi Wang for the TEM facilities.
Abbreviations
- BSA
bovine serum albumin
- CD
circular dichroism
- DLS
dynamic light scattering
- DSC
differential scanning calorimetry
- EDS
SEM energy dispersive x-ray spectroscopy-scanning electron microscopy
- FAD
Flavin adenine dinucleotide
- FITC
fluorescein isothiocyanate
- FPLC
fast protein liquid chromatography
- FTIR
fourier transform infrared spectroscopy
- GOx
glucose oxidase
- HME
hot melt extrusion
- PEG
polyethylene glycol
- PLGA
poly(lactic-co-glycolic acid)
- SEM
scanning electron microscopy
- TEM
transmission electron microscopy
Appendix A. Supplementary data
Supplementary data associated with this article can be found, in the online version, at http://dx.doi.org/10.1016/j.ijpharm.2017.09.044.
References
- Akhtar MS, Ahmad A, Bhakuni V. Guanidinium chloride- and urea-Induced unfolding of the dimeric enzyme glucose oxidase. Biochemistry (Mosc) 2002;41:3819–3827. doi: 10.1021/bi0116700. http://dx.doi.org/10.1021/bi0116700. [DOI] [PubMed] [Google Scholar]
- Aliverti A, Curti B, Vanoni M. Identifying and quantitating FAD and FMN in simple and in iron-sulfur-containing flavoproteins. In: Chapman S, Reid G, editors. Flavoprotein Protocols, Methods in Molecular Biology. Humana Press; 1999. pp. 9–23. [DOI] [PubMed] [Google Scholar]
- Armanious A, Aeppli M, Jacak R, Refardt D, Sigstam T, Kohn T, Sander M. Viruses at solid-Water interfaces: a systematic assessment of interactions driving adsorption. Environ Sci Technol. 2016;50:732–743. doi: 10.1021/acs.est.5b04644. http://dx.doi.org/10.1021/acs.est.5b04644. [DOI] [PubMed] [Google Scholar]
- Bankar SB, Bule MV, Singhal RS, Ananthanarayan L. Glucose oxidase — an overview. Biotechnol Adv. 2009;27:489–501. doi: 10.1016/j.biotechadv.2009.04.003. http://dx.doi.org/10.1016/j.biotechadv.2009.04.003. [DOI] [PubMed] [Google Scholar]
- Blanco-Príeto MJ, Fattal E, Gulik A, Dedieu JC, Roques BP, Couvreur P. Characterization and morphological analysis of a cholecystokinin derivative peptide-loaded poly(lactide-co-glycolide) microspheres prepared by a water-in-oil-in-water emulsion solvent evaporation method. J Controlled Release. 1997;43:81–87. http://dx.doi.org/10.1016/S0168-3659(96)01474-5. [Google Scholar]
- Cai S, Singh BR. Identification of beta-turn and random coil amide III infrared bands for secondary structure estimation of proteins. Biophys Chem. 1999;80:7–20. doi: 10.1016/s0301-4622(99)00060-5. [DOI] [PubMed] [Google Scholar]
- Cossé A, König C, Lamprecht A, Wagner KG. Hot melt extrusion for sustained protein release: matrix erosion and In vitro release of PLGA-based implants. AAPS PharmSciTech. 2017;18:15–26. doi: 10.1208/s12249-016-0548-5. http://dx.doi.org/10.1208/s12249-016-0548-5. [DOI] [PubMed] [Google Scholar]
- Costantino HR, Firouzabadian L, Hogeland K, Wu C, Beganski C, Carrasquillo KG, Córdova M, Griebenow K, Zale SE, Tracy MA. Protein spray-freeze drying. Effect of atomization conditions on particle size and stability. Pharm Res. 2000;17:1374–1382. doi: 10.1023/a:1007570030368. http://dx.doi.org/10.1023/A:1007570030368. [DOI] [PubMed] [Google Scholar]
- Etzl EE, Winter G, Engert J. Toward intradermal vaccination: preparation of powder formulations by collapse freeze-drying. Pharm Dev Technol. 2014;19:213–222. doi: 10.3109/10837450.2013.769567. http://dx.doi.org/10.3109/10837450.2013.769567. [DOI] [PubMed] [Google Scholar]
- Fan Y, Li X, Zhou Y, Fan C, Wang X, Huang Y, Liu Y. Improved intestinal delivery of salmon calcitonin by water-in-oil microemulsions. Int J Pharm. 2011;416:323–330. doi: 10.1016/j.ijpharm.2011.06.029. http://dx.doi.org/10.1016/j.ijpharm.2011.06.029. [DOI] [PubMed] [Google Scholar]
- Flores-Fernández GM, Griebenow K. Glycosylation improves α-chymotrypsin stability upon encapsulation in poly(lactic-co-glycolic)acid microspheres. Results Pharma Sci. 2012;2:46–51. doi: 10.1016/j.rinphs.2012.08.001. http://dx.doi.org/10.1016/j.rinphs.2012.08.001. [DOI] [PMC free article] [PubMed] [Google Scholar]
- Freitas Dda S, Abrahão-Neto J. Biochemical and biophysical characterization of lysozyme modified by PEGylation. Int J Pharm. 2010;392:111–117. doi: 10.1016/j.ijpharm.2010.03.036. http://dx.doi.org/10.1016/j.ijpharm.2010.03.036. [DOI] [PubMed] [Google Scholar]
- Ghalanbor Z, Körber M, Bodmeier R. Improved lysozyme stability and release properties of poly(lactide-co-glycolide) implants prepared by hot-melt extrusion. Pharm Res. 2010;27:371–379. doi: 10.1007/s11095-009-0033-x. http://dx.doi.org/10.1007/s11095-009-0033-x. [DOI] [PubMed] [Google Scholar]
- Ghalanbor Z, Körber M, Bodmeier R. Protein release from poly(lactide-co-glycolide) implants prepared by hot-melt extrusion: thioester formation as a reason for incomplete release. Int J Pharm. 2012;438:302–306. doi: 10.1016/j.ijpharm.2012.09.015. http://dx.doi.org/10.1016/j.ijpharm.2012.09.015. [DOI] [PubMed] [Google Scholar]
- Ghalanbor Z, Körber M, Bodmeier R. Interdependency of protein-release completeness and polymer degradation in PLGA-based implants. Eur J Pharm Biopharm. 2013;85:624–630. doi: 10.1016/j.ejpb.2013.03.031. http://dx.doi.org/10.1016/j.ejpb.2013.03.031. [DOI] [PubMed] [Google Scholar]
- Ghebre-Selassie I, Martin C. Pharmaceutical Extrusion Technology. CRC Press; 2003. [Google Scholar]
- Giteau A, Venier-Julienne MC, Aubert-Pouëssel A, Benoit JP. How to achieve sustained and complete protein release from PLGA-based microparticles? Int J Pharm. 2008;350:14–26. doi: 10.1016/j.ijpharm.2007.11.012. http://dx.doi.org/10.1016/j.ijpharm.2007.11.012. [DOI] [PubMed] [Google Scholar]
- Golmohammadi R, Fridborg K, Bundule M, Valegård K, Liljas L. The crystal structure of bacteriophage Q beta at 3.5 A resolution. Struct Lond Engl 1993. 1996;4:543–554. doi: 10.1016/s0969-2126(96)00060-3. [DOI] [PubMed] [Google Scholar]
- Hammann F, Schmid M. Determination and quantification of molecular interactions in protein films: a review. Materials. 2014;7:7975–7996. doi: 10.3390/ma7127975. http://dx.doi.org/10.3390/ma7127975. [DOI] [PMC free article] [PubMed] [Google Scholar]
- Johnson OL, Ganmukhi MM, Bernstein H, Auer H, Khan MA. Composition for Sustained Release of Human Growth Hormone. (US5654010A) 1997
- Krishnan S, Chi EY, Webb JN, Chang BS, Shan D, Goldenberg M, Manning MC, Randolph TW, Carpenter JF. Aggregation of granulocyte colony stimulating factor under physiological conditions: characterization and thermodynamic inhibition. Biochemistry (Mosc) 2002;41:6422–6431. doi: 10.1021/bi012006m. http://dx.doi.org/10.1021/bi012006m. [DOI] [PubMed] [Google Scholar]
- Lee H, Cusick RA, Browne F, Ho Kim T, Ma PX, Utsunomiya H, Langer R, Vacanti JP. Local delivery of basic fibroblast growth factor increases both angiogenesis and engraftment of hepatocytes in tissue-engineered polymer devices. Transplantation. 2002;73:1589–1593. doi: 10.1097/00007890-200205270-00011. [DOI] [PubMed] [Google Scholar]
- Lee H, Jang IH, Ryu SH, Park TG. N-terminal site-specific mono-PEGylation of epidermal growth factor. Pharm Res. 2003;20:818–825. doi: 10.1023/a:1023402123119. [DOI] [PubMed] [Google Scholar]
- Lee P, Towslee J, Maia J, Pokorski J. PEGylation to improve protein stability during melt processing. Macromol Biosci. 2015;15:1332–1337. doi: 10.1002/mabi.201500143. http://dx.doi.org/10.1002/mabi.201500143. [DOI] [PMC free article] [PubMed] [Google Scholar]
- Liu K, Barrows FT, Obert D. Dry fractionation methods to produce barley meals varying in protein, beta-Glucan, and starch contents. J Food Sci. 2009;74:C487–C499. doi: 10.1111/j.1750-3841.2009.01240.x. http://dx.doi.org/10.1111/j.1750-3841.2009.01240.x. [DOI] [PubMed] [Google Scholar]
- Mancini RJ, Lee J, Maynard HD. Trehalose glycopolymers for stabilization of protein conjugates to environmental stressors. J Am Chem Soc. 2012;134:8474–8479. doi: 10.1021/ja2120234. http://dx.doi.org/10.1021/ja2120234. [DOI] [PubMed] [Google Scholar]
- Maniruzzaman M, Boateng JS, Snowden MJ, Douroumis D. A review of hot-melt extrusion: process technology to pharmaceutical products. ISRN Pharm. 2012;2012:1–9. doi: 10.5402/2012/436763. [DOI] [PMC free article] [PubMed] [Google Scholar]
- Meersman F, Atilgan C, Miles AJ, Bader R, Shang W, Matagne A, Wallace BA, Koch MHJ. Consistent picture of the reversible thermal unfolding of hen egg-white lysozyme from experiment and molecular dynamics. Biophys J. 2010;99:2255–2263. doi: 10.1016/j.bpj.2010.07.060. http://dx.doi.org/10.1016/j.bpj.2010.07.060. [DOI] [PMC free article] [PubMed] [Google Scholar]
- Michalska M, Mirowski M, Bodek A, Bodek KH. Release kinetics of basic fibroblast growth factor (bFGF) from certain biopolymers in the presence of ketoprofen. Pharmacy. 2010;65:818–823. [PubMed] [Google Scholar]
- Mirdailami O, Khoshayand MR, Soleimani M, Dinarvand R, Atyabi F. Release optimization of epidermal growth factor from PLGA microparticles. Pharm Dev Technol. 2014;19:539–547. doi: 10.3109/10837450.2013.805776. http://dx.doi.org/10.3109/10837450.2013.805776. [DOI] [PubMed] [Google Scholar]
- Monder C, Ramstad PE. The effect of ball-milling upon certain properties of proteins. Arch Biochem Biophys. 1953;46:376–384. doi: 10.1016/0003-9861(53)90209-4. http://dx.doi.org/10.1016/0003-9861(53)90209-4. [DOI] [PubMed] [Google Scholar]
- Muttakin S, Kim MS, Lee DU. Tailoring physicochemical and sensorial properties of defatted soybean flour using jet-milling technology. Food Chem. 2015;187:106–111. doi: 10.1016/j.foodchem.2015.04.104. http://dx.doi.org/10.1016/j.foodchem.2015.04.104. [DOI] [PubMed] [Google Scholar]
- Onwulata CI, Konstance RP, Tomasula PM. Minimizing variations in functionality of whey protein concentrates from different sources. J Dairy Sci. 2004;87:749–756. doi: 10.3168/jds.S0022-0302(04)73218-X. http://dx.doi.org/10.3168/jds.S0022-0302(04)73218-X. [DOI] [PubMed] [Google Scholar]
- Park TG, Yong Lee H, Sung Nam Y. A new preparation method for protein loaded poly(d,l-lactic-co-glycolic acid) microspheres and protein release mechanism study. J Controlled Release. 1998;55:181–191. doi: 10.1016/s0168-3659(98)00050-9. http://dx.doi.org/10.1016/S0168-3659(98)00050-9. [DOI] [PubMed] [Google Scholar]
- Pokorski JK, Breitenkamp K, Liepold LO, Qazi S, Finn MG. Functional virus-based Polymer–Protein nanoparticles by atom transfer radical polymerization. J Am Chem Soc. 2011;133:9242–9245. doi: 10.1021/ja203286n. http://dx.doi.org/10.1021/ja203286n. [DOI] [PMC free article] [PubMed] [Google Scholar]
- Prewitt JMS, Mendelsohn ML. The analysis of cell images. Ann N Y Acad Sci. 1966;128:1035–1053. doi: 10.1111/j.1749-6632.1965.tb11715.x. http://dx.doi.org/10.1111/j.1749-6632.1965.tb11715.x. [DOI] [PubMed] [Google Scholar]
- Rajagopal K, Wood J, Tran B, Patapoff TW, Nivaggioli T. Trehalose limits BSA aggregation in spray-dried formulations at high temperatures: implications in preparing polymer implants for long-term protein delivery. J Pharm Sci. 2013;102:2655–2666. doi: 10.1002/jps.23634. http://dx.doi.org/10.1002/jps.23634. [DOI] [PubMed] [Google Scholar]
- Rajkhowa R, Hu X, Tsuzuki T, Kaplan DL, Wang X. Structure and biode-gradation mechanism of milled bombyx mori silk particles. Biomacromolecules. 2012;13:2503–2512. doi: 10.1021/bm300736m. http://dx.doi.org/10.1021/bm300736m. [DOI] [PMC free article] [PubMed] [Google Scholar]
- Repka MA, Shah S, Lu J, Maddineni S, Morott J, Patwardhan K, Mohammed NN. Melt extrusion: process to product. Expert Opin Drug Deliv. 2012;9:105–125. doi: 10.1517/17425247.2012.642365. http://dx.doi.org/10.1517/17425247.2012.642365. [DOI] [PubMed] [Google Scholar]
- Roa DF, Santagapita PR, Buera MP, Tolaba MP. Amaranth milling strategies and fraction characterization by FT-IR. Food Bioprocess Technol. 2014;7:711–718. http://dx.doi.org/10.1007/s11947-013-1050-7. [Google Scholar]
- Schneider CA, Rasband WS, Eliceiri KW. NIH Image to ImageJ: 25 years of image analysis. Nat Methods. 2012;9:671–675. doi: 10.1038/nmeth.2089. http://dx.doi.org/10.1038/nmeth.2089. [DOI] [PMC free article] [PubMed] [Google Scholar]
- Solá RJ, Al-Azzam W, Griebenow K. Engineering of protein thermodynamic, kinetic, and colloidal stability: chemical Glycosylation with monofunctionally activated glycans. Biotechnol Bioeng. 2006;94:1072–1079. doi: 10.1002/bit.20933. http://dx.doi.org/10.1002/bit.20933. [DOI] [PubMed] [Google Scholar]
- Spohn G, Keller I, Beck M, Grest P, Jennings GT, Bachmann MF. Active immunization with IL-1 displayed on virus-like particles protects from autoimmune arthritis. Eur J Immunol. 2008;38:877–887. doi: 10.1002/eji.200737989. http://dx.doi.org/10.1002/eji.200737989. [DOI] [PubMed] [Google Scholar]
- Stanković M, de Waard H, Steendam R, Hiemstra C, Zuidema J, Frijlink HW, Hinrichs WLJ. Low temperature extruded implants based on novel hydrophilic multiblock copolymer for long-term protein delivery. Eur J Pharm Sci. 2013;49:578–587. doi: 10.1016/j.ejps.2013.05.011. http://dx.doi.org/10.1016/j.ejps.2013.05.011. [DOI] [PubMed] [Google Scholar]
- Stanković M, Tomar J, Hiemstra C, Steendam R, Frijlink HW, Hinrichs WLJ. Tailored protein release from biodegradable poly(ε-caprolactone-PEG)-b-poly (ε-caprolactone) multiblock-copolymer implants. Eur J Pharm Biopharm. 2014;87:329–337. doi: 10.1016/j.ejpb.2014.02.012. http://dx.doi.org/10.1016/j.ejpb.2014.02.012. [DOI] [PubMed] [Google Scholar]
- Sun C, Wu T, Liu R, Liang B, Tian Z, Zhang E, Zhang M. Effects of superfine grinding and microparticulation on the surface hydrophobicity of whey protein concentrate and its relation to emulsions stability. Food Hydrocoll. 2015;51:512–518. http://dx.doi.org/10.1016/j.foodhyd.2015.05.027. [Google Scholar]
- Sun C, Liu R, Ni K, Wu T, Luo X, Liang B, Zhang M. Reduction of particle size based on superfine grinding: effects on structure, rheological and gelling properties of whey protein concentrate. J Food Eng. 2016;186:69–76. http://dx.doi.org/10.1016/j.jfoodeng.2016.03.002. [Google Scholar]
- Swoboda BEP, Massey V. On the reaction of the glucose oxidase from aspergillus niger with bisulfite. J Biol Chem. 1966;241:3409–3416. [PubMed] [Google Scholar]
- Tian K, Porter D, Yao J, Shao Z, Chen X. Kinetics of thermally-induced conformational transitions in soybean protein films. Polymer. 2010;51:2410–2416. http://dx.doi.org/10.1016/j.polymer.2010.03.032. [Google Scholar]
- Wang C, Eufemi M, Turano C, Giartosio A. Influence of the carbohydrate moiety on the stability of glycoproteins. Biochemistry (Mosc) 1996;35:7299–7307. doi: 10.1021/bi9517704. http://dx.doi.org/10.1021/bi9517704. [DOI] [PubMed] [Google Scholar]
- Wang W, Nema S, Teagarden D. Protein aggregation—pathways and influencing factors. Int J Pharm. 2010;390:89–99. doi: 10.1016/j.ijpharm.2010.02.025. http://dx.doi.org/10.1016/j.ijpharm.2010.02.025. [DOI] [PubMed] [Google Scholar]
- Wanning S, Süverkrüp R, Lamprecht A. Pharmaceutical spray freeze drying. Int J Pharm. 2015;488:136–153. doi: 10.1016/j.ijpharm.2015.04.053. http://dx.doi.org/10.1016/j.ijpharm.2015.04.053. [DOI] [PubMed] [Google Scholar]
- Wilson M, Williams MA, Jones DS, Andrews GP. Hot-melt extrusion technology and pharmaceutical application. Ther Deliv. 2012;3:787–797. doi: 10.4155/tde.12.26. [DOI] [PubMed] [Google Scholar]
- Wu H, Fan Y, Sheng J, Sui SF. Induction of changes in the secondary structure of globular proteins by a hydrophobic surface. Eur Biophys J. 1993;22:201–205. doi: 10.1007/BF00185781. http://dx.doi.org/10.1007/BF00185781. [DOI] [PubMed] [Google Scholar]
- Wu F, Yuan W, Su J, Ren J, Jin T. Preparation and characterisation of PLGA microspheres for sustained release of recombinant human granulocyte colony-stimulating factor. IET Micro Nano Lett. 2011;6:181–185. http://dx.doi.org/10.1049/mnl.2010.0218. [Google Scholar]
- Zhang X, Zheng Y, Jin T, Chow AHL. Formulation of sustained-release microspheres of granulocyte macrophage colony stimulating factor by freezing-induced phase separation with dextran and encapsulation with blended polymers. J Microencapsul. 2011;28:743–751. doi: 10.3109/02652048.2011.615950. http://dx.doi.org/10.3109/02652048.2011.615950. [DOI] [PubMed] [Google Scholar]
- Zhang L, Qiu W, Crooke S, Li Y, Abid A, Xu B, Finn MG, Lin F. Development of autologous C5 vaccine nanoparticles to reduce intravascular hemolysis in vivo. ACS Chem Biol. 2017;12:539–547. doi: 10.1021/acschembio.6b00994. http://dx.doi.org/10.1021/acschembio.6b00994. [DOI] [PMC free article] [PubMed] [Google Scholar]
- Zoldák G, Zubrik A, Musatov A, Stupák M, Sedlák E. Irreversible thermal denaturation of glucose oxidase from Aspergillus niger is the transition to the denatured state with residual structure. J Biol Chem. 2004;279:47601–47609. doi: 10.1074/jbc.M406883200. http://dx.doi.org/10.1074/jbc.M406883200. [DOI] [PubMed] [Google Scholar]
Associated Data
This section collects any data citations, data availability statements, or supplementary materials included in this article.