

Abstract
Dynamic cell stimulation is a powerful technique for probing gene networks and for applications in stem cell differentiation, immunomodulation and signaling. We developed a robust and flexible method and associated microfluidic devices to generate a wide-range of precisely formulated dynamic chemical signals to stimulate live cells and measure their dynamic response. This signal generator is capable of digital to analog conversion (DAC) through combinatoric selection of discrete input concentrations, and outperforms existing methods by both achievable resolution, dynamic range and simplicity in design. It requires no calibration, has minimal space requirements and can be easily integrated into microfluidic cell culture devices. The signal generator hardware and software we developed allows to choose the waveform, period and amplitude of chemical input signals and features addition of well-defined chemical noise to study the role of stochasticity in cellular information processing.
Introduction
With the advance of microfluidic technologies into the field of biology, the dynamics of stimulated biochemical circuits and signaling networks in single living cells can be monitored with high throughput.1–3 A main objective of systems biology is to characterize the topology and strength of interactions in signaling networks, thereby identifying the molecular basis for the observed phenotype.4–6 Ultimately these parameters determine how cells process information and make decisions in response to stimuli.7 For quantitative characterization measuring the response of a signaling network to a defined temporally changing chemical concentration input is essential.8–12 Precise generation of temporally varying signals with defined noise characteristics is thus a prerequisite in enhancing understanding of cellular information processing.
The implementation of a microfluidic chemical signal generator, which creates temporally changing concentrations of signaling molecules in a predetermined fashion, requires the mixing of small volumes of at least two different input concentrations to create the desired stimulation concentration and the transport of the created fluid volume to cell culture chambers. Existing signal generators mainly fall into two categories, (i) they mix a number of input concentrations with equal flow rates to generate a mean concentration13 or (ii) they mix two input concentrations with varying flow rates to achieve intermediate concentrations.14–18,12,19–21 Both methods depend on extremely precise control of fluid flow rates, which is a difficult task for PDMS based microfluidic devices due to the compliant nature of the PDMS elastomer and the flexible tubing typically used in such systems. The technologies to generate chemical input concentration profiles directly applied to cell cultures so far relied on systems of category ii) that require precise control of fluid flow rates, resulting in limited performance with few concentration steps or even Boolean on-off switching, with limited dynamic range and resolution in the concentration profiles that can be achieved.9,15,20
For single layer microfluidic devices syringe pumps can be used to create flow.17 They regulate flow through the speed of the plunger movement. Nevertheless, the precise control of time varying input concentrations is hard to achieve in a reproducible manner since the polyethylene syringes deform under pressure and even if glass syringes are used the concentration output is only precise when a feedback system is implemented.14 Feedback systems measure the channel pressure in real-time and adjust the input pressure to reach the desired channel pressure, however, they are difficult to integrate with the rest of a multilayer microfluidic set-up. More recently this problem was addressed by Yu et al. by introducing the on-chip serial digital to analog pressure converter.19 Yet on-chip pressure conversion creates other trade-offs. First, a single pressure converter needs actuation by three valves; second, since converters are used in series, the actuation time increases with resolution of the chemical signal.19
In theory, multilayer microfluidic devices that use membrane valves make fluidic mixing very efficient and straightforward.1 It is therefore possible to mix previously prepared concentrations to achieve ever-increasing dynamic range and resolution. However, in practice, equal pressure and hence fluid flow rates for all input concentrations are hard to achieve. Flow rates are very sensitive to variations in the channel geometry, PDMS compliance, and especially to differences in the punch holes to connect inlets from the liquid reservoirs. Also the pressurized reservoirs themselves can be a source of variation. These problems can be avoided by diluting a single concentration input on-chip. On one hand this circumvents the laborious process of connecting many inputs and especially different pressures. It also saves mixing of the input concentrations in a tube by pipetting. On the other hand it limits the input concentrations to the ones hardwired on-chip. The signal generator designed by Chen et al. used on-chip dilution in combination with a Digital to Analog Converter (DAC) that allows to combine up to 4 input concentrations in arbitrary ways to reach the desired output concentrations.13 To select an arbitrary number of inputs under constant flow, this method directs the flow either to the output or the waste.
Here, we developed a new method for creation of arbitrarily complex chemical concentration profiles with greatly improved dynamic range and resolution compared to the previous methods, and integrated this method into multi-layer automated microfluidic cell culture devices for dynamic stimulation and analysis of living cells. This method takes advantage of digitally actuated PDMS membrane valves for measuring, timing and mixing of various chemicals at different concentrations, and the resolution of achievable concentrations is independent of valve actuation time and increases almost exponentially with the number of valves used. The system is simple and robust in its design, and achieves DAC by combinatoric selection of a subset of input concentrations (Fig. 1). To establish equal continuous flow rates, all inputs are controlled by an on-chip peristaltic pump that allows mixing of predetermined volumes of fluids with sub-nanoliter resolution. Connected inputs are not hardwired into the device and can thus be changed according to the desired dynamic range. Compared to the serial digital to analog pressure converter, our concentration switches are limited by the speed of the peristaltic pump, which can be as fast as 75Hz thus allowing fast concentration switches.1
Fig. 1.
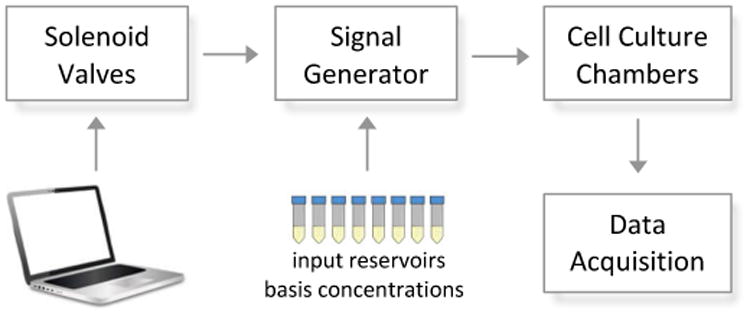
Overview of microfluidic dynamical input generation. In-chip PDMS membrane valves are controlled via computer driven solenoid valves, allowing regulation of fluid flow. The signal generator selects and mixes the right concentrations cn from the preset reservoirs to reach a desired concentration and sends it to the cell culture chambers. By means of fluorescent live-cell microscopy a time course of responding cells is recorded.
To ensure proper transversal mixing of the laminar streams of fluid leaving the mixer before they reach the cell culture chambers, a chaotic mixer is employed.22 Previously published studies mostly focused on either the signal generator or the cell culture system, mainly due to the complexity of previous signal generators. Here we have achieved seamless integration of the signal generator and the cell culture devices, realizing a truly flexible automated single cell stimulation and analysis system for the study of signaling network dynamics. In addition to the generation of almost arbitrarily complex dynamic concentration profiles, our system allows creation of chemical noise, which can be combined with the dynamic chemical signals to study the effect of input noise on network dynamics. Our system can create noisy chemical signals whose frequency content and amplitude can be precisely controlled, including colored or white noise with predetermined statistics. It is still unclear in cell signaling and systems biology, if and how cells filter or even make use of noise to enhance signal processing. For the first time we report a signal generator capable of addressing these questions.
Results
Signal Generator Design and Principle
The basic principle of the combinatoric signal generator involves first choosing a set of input or basis concentrations contained in reservoirs. In practice, these concentrations will be prepared externally and connected to the microfluidic device (see Fig. 1 and Fig. 2a). By mixing a subset of 8 basis concentrations in the microfluidic device the signal generator can generate a wide range of output concentrations (Fig. 3a). The magnitude of the output is simply the arithmetic mean over all selected input concentrations, given that all input flow rates are equal. One complication is, that if the number of inputs we open at a time changes, the flow rate of the output will change in proportion to the number of opened inputs. To avoid this, we included the constraint, that only the same number of valves are allowed to open at a time. Following the rules of combinatorics the maximum amount of combinations can be achieved by choosing a subset of 4 out of 8 inputs.
Fig. 2.
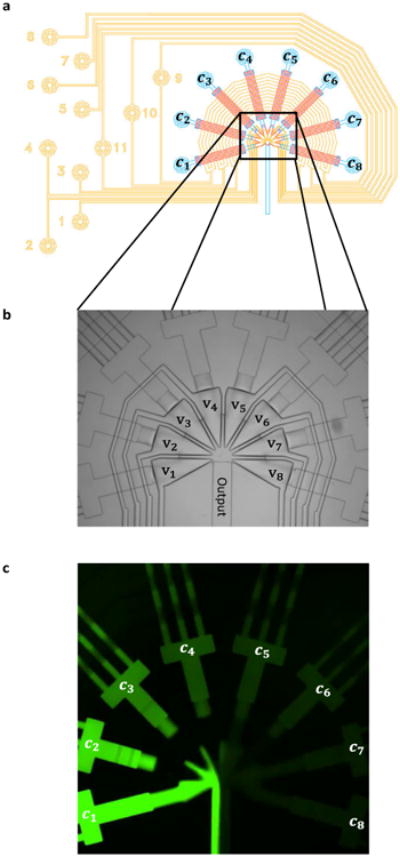
a) Design of a Signal Generator Module; control lines in yellow, flow lines in blue and red. Solenoid controlled pressure is connected to the control lines (yellow circles numbered 1-11). The input reservoirs are pressurized and connected to the blue circles. Valves 9-11 cross all inputs in a circular manner to achieve equal flow rates of all inputs by peristaltic movement.1 Valves 1-8 control each input individually and allow to choose desired concentrations at the junction. b) Bright field image of the injector junction with triangular converging valves v1 – v8. c) Snapshot from movie (Electronic Supplementary Information) of the operating signal generator, mixing fluorescent dye solutions of different concentration c1 – c8.
Fig. 3.
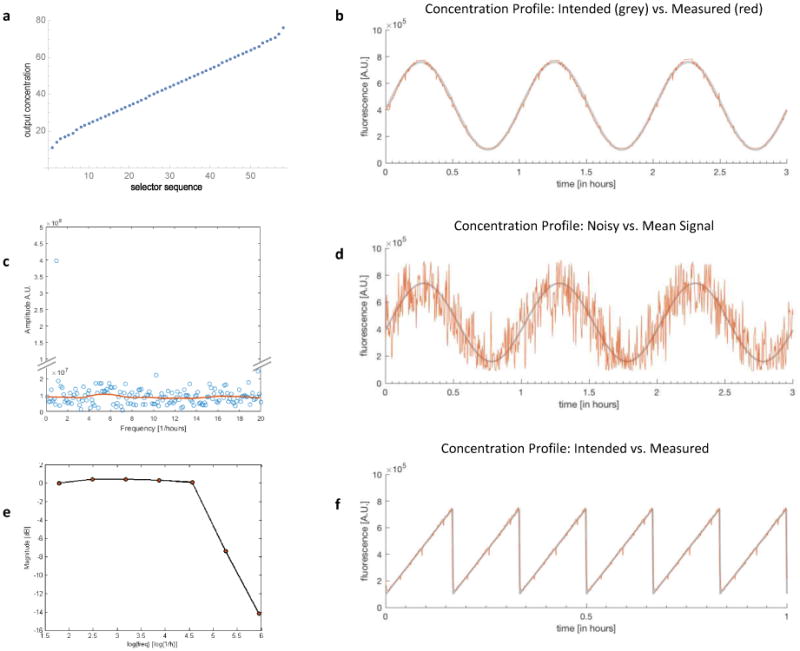
a) Concentration mapping using Fibonacci basis cn = 1, 2, 3, 5, 8, 13, 21, 34. b) Measured FITC fluorescence intensity in the cell culture chamber. Signal generated is a sine wave with period 1 hour (red) and closely follows the intended theoretical signal (grey). c) Blue dots show the Fourier spectrum for the signal shown in Fig. 3d and confirms its white noise property. The red line is the moving window average of the amplitude and was created with the Matlab smooth function. All frequencies are present with approximately the same power except the main frequency with period 1 hour has a larger magnitude. d) FITC fluorescence intensity measured in the cell culture chamber for a generated noisy sine wave with period 1 hour (red) and white noise with standard deviation of 2000pg/ml. The grey line shows the theoretical mean of the sine wave. e) Bode plot shows the cutoff frequency, i.e. when the amplitude of the generated signal in units of dB starts to decrease. f) FITC fluorescence intensity reported in the cell culture chamber for a ramp wave of period 10min (red), which closely follows the intended signal (grey).
Overall 8 valves V(n) = v1, v2,… vn … v8 control input reservoirs containing chemicals (e.g. cytokines) of different concentration (c = c1,c2,… cn…c8). The output concentration is achieved by selecting and mixing 4 of the input concentrations cn
where the valve state V(n) is either 0 (closed) or 1 (open) V(n) = {0,1} and the sum over all V(n) is always . Hence each 8-bit valve selection string S corresponds to a specific concentration.
Let the subscript t denote discrete time points, then the sequence of selection strings St
defines a unique concentration profile depending on the input concentrations cn that have been connected and the switching interval Δt between concentrations (see Fig. 2c and ESI).
It is immediately clear that if one chooses a linear concentration basis (c = 1 2 3 4 5 6 7 8), this will lead to redundancy. We define a concentration basis cn as redundant, if two or more selection strings S lead to the same output concentration Cout. For this example, the selectors
both lead to the output concentration Cout = 3. In other words, if we use this concentration basis, we waste some combinations due to redundancy. In order to avoid this problem, we analyzed several bases using the symbolic computer algebra package in Mathematica.23 The best performance can be obtained with the Fibonacci basis and the Geometric basis (see Fig. 3a and Supplementary Information).
The mapping from the desired concentration to the valve state was implemented using custom Matlab software (see Electronic Supplementary Information for a movie of the operating mixer). The graphical user interface allows to choose the transition time between states of the pumping cycle and thus the flow rate of the peristaltic pump. One can also specify after how many pumping cycles the next concentration mapping shall occur, the frequency, the minimum and maximum of the amplitude and the duration of the mapping.
Signal Generator Performance
Our initial designs of the combinatoric signal generator included a rectangular tree structure that merged all inputs similar to a recently published study.24 This previous design performed poorly due to dead volume in the tree structures that created concentration artifacts which could not be eliminated. To avoid this problem, we developed a circular junction that combines different inputs with minimal dead volume to prevent corrupting the concentration (Fig. 2b). We used fluorescent dye as a readout for concentration levels. The results show that the fluorescence intensity closely follows the intended signal with only occasional and minor artefacts (Fig. 3 b,f). We were able to generate a wide range of dynamic chemical signals, such as sine- cos- ramp- and square-waveforms. The high concentration- and time-resolution of the presented signal generator even allows to map signals with well-defined noise such as shown in Fig. 3d. Here, we combine a sine waveform with white noise, creating a noisy chemical oscillation. Fourier Analysis (power spectrum) of the signal confirms that the main power frequency is one oscillation per hour (corresponding to the carrier sine wave) and that all other frequencies are present with about the same power, indicating the white noise property of the desired signal (Fig. 3c). To determine the cut-off frequency where the amplitude of the signal does not reach the desired amplitude anymore, signals with various frequencies as depicted in Fig. 3b) have been recorded and the amplitude was plotted for each frequency in a Bode plot (Fig. 3e).
The cut-off frequency is often defined as the frequency where the magnitude of the signal drops by 3dB (see Bode plot in Fig. 3e).19 This corresponds to a cutoff frequency of about 120, the limiting factor being the herringbone mixer, which restricts complete concentration changes from minimal to maximal concentration to 15 seconds due to longitudinal mixing. Virtually all advanced signal generators require transversal mixing during which simultaneous longitudinal mixing cannot be avoided. Although the chaotic mixer substantially reduces the mixing distances, mixing still represents the bottleneck in reaching higher frequencies.22
As a measure for the signal fidelity, the standard deviation (Std) of the measured signal from the intended signal was calculated and compared to the amplitude (Amp) of the signal (SNR=Amp/Std). We found a signal to noise ratio SNR=50 for the sine wave shown in Fig. 3b) and SNR=59 for the ramp signal in Fig. f). Hence, the average standard deviation of the generated signal from the intended signal is less than 2% of the signal amplitude.
Dynamic Chemical Stimulation of the NFκB pathway in Live Cells
High throughput microfluidic devices for mammalian cell cultures are routinely used in a wide range of applications.2,3,25 We integrated our cell culture chip with the combinatoric signal generator and characterized the capabilities of the resulting system. First we cultured mammalian cells in the cell culture chambers of our integrated device to see how they respond to gentle, but constant flow (see Methods section). Being able to culture cells under constant flow, we then measured the nuclear localization of the transcription factor NFκB in response to stimulation with tumor necrosis factor alpha (TNF-α) (see Fig. 4a). In previous studies we showed nucleocytoplasmic oscillations of NFκB with natural frequency of about 90 minutes.8
Fig. 4.
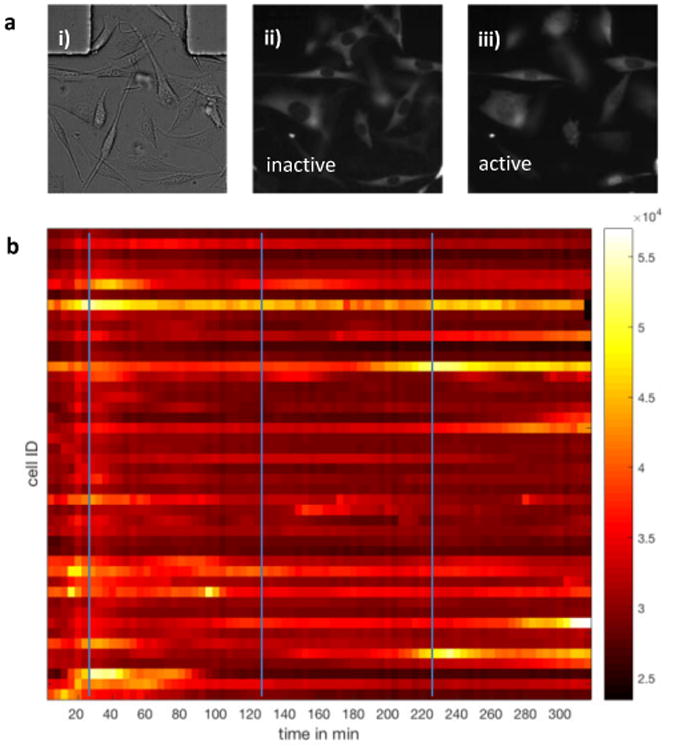
a) i) Fibroblasts cultured on chip ii) Fluorescent images showing NF-κB levels before TNF stimulation iii) and nuclear localization after periodic sine-wave TNF stimulation. b) Heatmap of time-dependent nuclear NF-κB levels of about 50 single cells in response to a TNF sine wave (maxima indicated by blue lines) with a period of 100min, amplitude 2800 pg/ml, minimum concentration of 200pg/ml and a maximum concentration of 3000pg/ml.
In the experiment shown in Fig. 4b, mouse 3T3 fibroblasts expressing the reporter p65-DsRed were stimulated by a TNF sine wave with a period of 100 minutes and a maximum concentration of 3ng/ml. Single cells stimulated with sinusoidal TNF inputs show characteristic NFκB nucleocytoplasmic oscillations.26 Overall, the response of single cells is very heterogeneous, but most cells respond to the first wave, some cells also respond to the second or third and a few cells to all waves. These experiments demonstrate the feasibility of our approach and microfluidic culture device for studies of live-cell immune signaling under dynamically changing chemical signaling inputs. The presented device opens the door to more biologically focused studies on noisy signal processing.
Methods
Chip Fabrication
Chip Fabrication was performed using standard multi-layer soft lithography.1 The Polydimethylsiloxane (PDMS) device consists of two layers. The top layer contains flow channels and the cell culture chambers, the bottom layer contains the control channels and valves able to close the flow channels. Each layer requires a negative mold where the PDMS can be cast onto.
Two photoresists SU8 and AZ50 were used to create molds on silicon wafers. The control channels are 25μm in height and were created using the SU8 resist. The same SU8 channels were created on the flow layer except where control channels cross them. Where channels cross the AZ50 positive resist has been used. This resist allows to create rounded channels to enable closing by the control channels.
To fabricate PDMS chips the control layer mold was spin coated with PDMS at 2000RPM and cured over night at 80°C, then the thicker flow layer is bond on top of the control layer via prior exposure of both layers to O2 plasma. Subsequently, holes are punched into the resulting PDMS device where inputs and outputs are connected and is then bond to glass after a second plasma treatment.
Mammalian Cell Culture and TNF stimulation
For live cell imaging and quantification of NFκB nuclear localization in response to TNF-α stimulation, p65-/- 3T3 mouse fibroblasts as previously reported have been used.26 They contain a H2B-GFP nuclear marker to identify and segment the nucleus and a p65-dsRed fluorescent marker to quantify nuclear NFκB.26 Cell culture chambers were coated with fibronectin (Chemicon International Inc., 25 μg/mL in PBS) for 1 hour prior to cell seeding. Cells flown into the culture chambers were then given time to adhere and adjust for 4 hours before TNF stimulation. The PDMS device was kept in the Microscope incubation chamber at 37°C and ∼90% relative humidity. TNF for input concentrations was diluted in conditioned DMEM medium including 10% Fetal Bovine Serum (FBS) and continuously kept on ice to prevent TNF degradation. The TNF reservoirs were pressurized with 5% CO2 with 5 psi. The reservoirs are connected to the PDMS chip by PTFE-tubing 0,56 × 1,07MM (Fischer Scientific).
In order to achieve higher cut-off frequencies, we avoided diffusion based exchange and instead tried to use constantly flowing medium.27,28 To this end, we first tested the standard culture medium (DMEM+FBS) on 3T3 mouse fibroblasts cultured on chip under constant flow. Under this condition cells started to round up and finally died after 3-4 hours of constant flow. To test if the cells respond to the shear stress or paracrine signals that are constantly washed away, conditioned medium was tested. To this end, medium of an overnight 3T3 culture was collected. In culture flasks, cells create a favorable environment by secreting paracrine signals that are not present in the standard culture medium (DMEM+FBS). Our experiments showed that it is not the shear flow, but the paracrine signals that are necessary for cell survival. This shows that constant flow can add the advantage of precise control of the cell environment by avoiding paracrine signaling, whereas diffusion based devices risk the crosstalk of cells through paracrine signaling.29 Nevertheless, the signal generator could easily be integrated in cell culture chambers with diffusive medium exchange allowing to study cell types that are shear sensitive.27,28
Signal measurement with FITC Fluorescent Dye
The signal generator has been tested with 8 different input concentrations of FITC-CM-Dextran fluorescent dye (Sigma-Aldrich, mol wt 40.000) diluted in MiliQ water. Concentrations for characterization of the signal ranged from 0 to 25mg/ml for excitation times of 200ms. The GFP signal intensity in the cell culture chambers was recorded with a frequency of 0.1 to 5 frames per second depending on the frequency of the signal. The resulting fluorescence intensity time course was then analyzed using ImageJ.30
Image acquisition and Data processing
Cells were imaged in a microfluidic chip mounted on a Nikon Eclipse Ti Microscope to record fluorescence time lapse movies of p65-dsRed and H2B-GFP via a Retiga-SRV CCD camera (QImaging) in 4 min time intervals. After illumination correction the raw data was segmented and tracked through the time lapse movie by the imaging analysis software CellProfiler.31
Conclusions
In this work we presented the combinatoric signal generator, a microfluidic digital to analog concentration converter that allows dynamic and if desired noisy chemical stimulation of live cells. The generation of precisely tuned and highly complex dynamic signals, such as noisy or noise-free sine- square- and ramp signals, is not feasible with traditional dish-and-pipette techniques. Such signals are highly useful in probing the dynamical characteristics of gene networks in a wide range of problems in immunology, signaling, cancer and stem cell research.32–35 For example, recent studies underline that the timing of cancer treatment should be optimized by taking into account the temporally changing response of the cells to radiation- and chemotherapy. Nevertheless, it is still unknown what dynamic chemotherapy would be optimal to administer.36,37 Other studies highlight the role of dynamic biochemical signals in overcoming noise-induced information loss or gain8,11,38 and the role of noise in spontaneous activation of gene networks.39 It is unclear however what the circuit design principles are that allow cells to operate in the face of noise.40–42 With the presented microfluidic set-up these questions can now be addressed. Moreover, this signal generator enables to study how receptor input-signal and especially input-noise are propagated or filtered by the signaling network.43,44 Finally, the ability to generate sine waves greatly simplifies the theoretical analysis since concepts well known in the Engineering discipline of Systems Identification such as Frequency Analysis rely on such signals.16,45–47
Supplementary Material
Acknowledgments
We thank Tino Frank for council regarding chip design and fabrication and Philip Dettinger for insights on programmatic coding. This work was supported by an ERC Starting Grant (SingleCellDyamics) and by NIH grant (R01 GM117134-01) to S.T.
Footnotes
Electronic Supplementary Information (ESI) available: 1 video.
References
- 1.Unger MA. Science. 2000;288:113–116. doi: 10.1126/science.288.5463.113. [DOI] [PubMed] [Google Scholar]
- 2.Gómez-Sjöberg R, Leyrat AA, Pirone DM, Chen CS, Quake SR. Anal Chem. 2007;79:8557–63. doi: 10.1021/ac071311w. [DOI] [PubMed] [Google Scholar]
- 3.Kellogg RA, Gómez-Sjöberg R, Leyrat AA, Tay S. Nat Protoc. 2014;9:1713–1726. doi: 10.1038/nprot.2014.120. [DOI] [PubMed] [Google Scholar]
- 4.Liepe J, Kirk P, Filippi S, Toni T, Barnes CP, Stumpf MPH. Nat Protoc. 2014;9:439–56. doi: 10.1038/nprot.2014.025. [DOI] [PMC free article] [PubMed] [Google Scholar]
- 5.Zechner C, Unger M, Pelet S, Peter M, Koeppl H. Nat Methods. 2014;11:197–202. doi: 10.1038/nmeth.2794. [DOI] [PubMed] [Google Scholar]
- 6.Fröhlich F, Thomas P, Kazeroonian A, Theis FJ, Grima R, Hasenauer J. PLOS Comput Biol. 2016;12:e1005030. doi: 10.1371/journal.pcbi.1005030. [DOI] [PMC free article] [PubMed] [Google Scholar]
- 7.Perkins TJ, Swain PS. Mol Syst Biol. 2009;5:326. doi: 10.1038/msb.2009.83. [DOI] [PMC free article] [PubMed] [Google Scholar]
- 8.Kellogg RA, Tay S. Cell. 2015;160:381–392. doi: 10.1016/j.cell.2015.01.013. [DOI] [PubMed] [Google Scholar]
- 9.Kellogg RA, Tian C, Lipniacki T, Quake SR, Tay S. Elife. 2015;4:e08931. doi: 10.7554/eLife.08931. [DOI] [PMC free article] [PubMed] [Google Scholar]
- 10.Junkin M, Kaestli AJ, Cheng Z, Jordi C, Albayrak C, Hoffmann A, Tay S. Cell Rep. 2016;15:411–422. doi: 10.1016/j.celrep.2016.03.033. [DOI] [PMC free article] [PubMed] [Google Scholar]
- 11.Heltberg M, Kellogg RA, Krishna S, Tay S, Jensen MH. Cell Syst. 2016;3:532–539.e3. doi: 10.1016/j.cels.2016.11.014. [DOI] [PMC free article] [PubMed] [Google Scholar]
- 12.Mitchell A, Wei P, Lim WA. Science. 2015;350:1379–83. doi: 10.1126/science.aab0892. [DOI] [PMC free article] [PubMed] [Google Scholar]
- 13.Chen L, Azizi F, Mastrangelo CH. Lab Chip. 2007;7:850–5. doi: 10.1039/b706304k. [DOI] [PubMed] [Google Scholar]
- 14.Kuczenski B, LeDuc PR, Messner WC. Lab Chip. 2007;7:647–9. doi: 10.1039/b617065j. [DOI] [PubMed] [Google Scholar]
- 15.Hersen P, McClean MN, Mahadevan L, Ramanathan S. Proc Natl Acad Sci U S A. 2008;105:7165–70. doi: 10.1073/pnas.0710770105. [DOI] [PMC free article] [PubMed] [Google Scholar]
- 16.Muzzey D, Gómez-Uribe CA, Mettetal JT, van Oudenaarden A. Cell. 2009;138:160–71. doi: 10.1016/j.cell.2009.04.047. [DOI] [PMC free article] [PubMed] [Google Scholar]
- 17.Crane MM, Clark IBN, Bakker E, Smith S, Swain PS. PLoS One. 2014;9:e100042. doi: 10.1371/journal.pone.0100042. [DOI] [PMC free article] [PubMed] [Google Scholar]
- 18.Bennett MR, Pang WL, Ostroff NA, Baumgartner BL, Nayak S, Tsimring LS, Hasty J. Nature. 2008;454:1119–1122. doi: 10.1038/nature07211. [DOI] [PMC free article] [PubMed] [Google Scholar]
- 19.Yu F, Horowitz MA, Quake SR. Lab Chip. 2013;13:1911–8. doi: 10.1039/c3lc41394b. [DOI] [PubMed] [Google Scholar]
- 20.VanDersarl JJ, Xu AM, Melosh NA. Lab Chip. 2011;11:3057–63. doi: 10.1039/c1lc20311h. [DOI] [PubMed] [Google Scholar]
- 21.Heo YJ, Kang J, Kim MJ, Chung WK. Sci Rep. 2016;6:23273. doi: 10.1038/srep23273. [DOI] [PMC free article] [PubMed] [Google Scholar]
- 22.Stroock AD, Dertinger SKW, Ajdari A, Mezic I, Stone HA, Whitesides GM. Science. 2002;295:647–51. doi: 10.1126/science.1066238. [DOI] [PubMed] [Google Scholar]
- 23.Inc WR. 2014 [Google Scholar]
- 24.Li X, Brooks JC, Hu J, Ford KI, Easley CJ. Lab Chip. 2017;208:501–512. doi: 10.1039/c6lc01201a. [DOI] [PMC free article] [PubMed] [Google Scholar]
- 25.Mehling M, Tay S. Curr Opin Biotechnol. 2014;25:95–102. doi: 10.1016/j.copbio.2013.10.005. [DOI] [PubMed] [Google Scholar]
- 26.Tay S, Hughey JJ, Lee TK, Lipniacki T, Quake SR, Covert MW. Nature. 2010;466:267–71. doi: 10.1038/nature09145. [DOI] [PMC free article] [PubMed] [Google Scholar]
- 27.Frank T, Tay S. Lab Chip. 2015;15:2192–200. doi: 10.1039/c5lc00182j. [DOI] [PubMed] [Google Scholar]
- 28.Frank T, Tay S. Lab Chip. 2013;13:1273. doi: 10.1039/c3lc41076e. [DOI] [PubMed] [Google Scholar]
- 29.Lee TK, Denny EM, Sanghvi JC, Gaston JE, Maynard ND, Hughey JJ, Covert MW. Sci Signal. 2009;2:ra65. doi: 10.1126/scisignal.2000599. [DOI] [PMC free article] [PubMed] [Google Scholar]
- 30.Schneider CA, Rasband WS, Eliceiri KW. Nat Methods. 2012;9:671–5. doi: 10.1038/nmeth.2089. [DOI] [PMC free article] [PubMed] [Google Scholar]
- 31.Lamprecht MR, Sabatini DM, Carpenter AE. Biotechniques. 2007;42:71–5. doi: 10.2144/000112257. [DOI] [PubMed] [Google Scholar]
- 32.Purvis JE, Lahav G. Cell. 2013;152:945–56. doi: 10.1016/j.cell.2013.02.005. [DOI] [PMC free article] [PubMed] [Google Scholar]
- 33.Yosef N, Regev A. Cell. 2011;144:886–96. doi: 10.1016/j.cell.2011.02.015. [DOI] [PMC free article] [PubMed] [Google Scholar]
- 34.Furusawa C, Kaneko K. Science. 2012;338:215–7. doi: 10.1126/science.1224311. [DOI] [PubMed] [Google Scholar]
- 35.Levine JH, Lin Y, Elowitz MB. Science. 2013;342 doi: 10.1126/science.1239999. [DOI] [PMC free article] [PubMed] [Google Scholar]
- 36.Chen Sh, Forrester W, Lahav G. Science. 2016;351:1204–1208. doi: 10.1126/science.aac5610. [DOI] [PMC free article] [PubMed] [Google Scholar]
- 37.Paek AL, Liu JC, Loewer A, Forrester WC, Lahav G. Cell. 2016;165:631–642. doi: 10.1016/j.cell.2016.03.025. [DOI] [PMC free article] [PubMed] [Google Scholar]
- 38.Selimkhanov J, Taylor B, Yao J, Pilko A, Albeck J, Hoffmann A, Tsimring L, Wollman R. Science. 2014;346:1370–1373. doi: 10.1126/science.1254933. [DOI] [PMC free article] [PubMed] [Google Scholar]
- 39.Pękalski J, Zuk PJ, Kochańczyk M, Junkin M, Kellogg R, Tay S, Lipniacki T. PLoS One. 2013;8:e78887. doi: 10.1371/journal.pone.0078887. [DOI] [PMC free article] [PubMed] [Google Scholar]
- 40.Walczak AM, Tkacik G, Bialek W. Phys Rev E Stat Nonlin Soft Matter Phys. 2010;81:41905. doi: 10.1103/PhysRevE.81.041905. [DOI] [PubMed] [Google Scholar]
- 41.Zechner C, Seelig G, Rullan M, Khammash M. Proc Natl Acad Sci U S A. 2016;113:4729–34. doi: 10.1073/pnas.1517109113. [DOI] [PMC free article] [PubMed] [Google Scholar]
- 42.Voliotis M, Perrett RM, McWilliams C, McArdle CA, Bowsher CG. Proc Natl Acad Sci U S A. 2014;111:E326–33. doi: 10.1073/pnas.1314446111. [DOI] [PMC free article] [PubMed] [Google Scholar]
- 43.Rhee A, Cheong R, Levchenko A. Proc Natl Acad Sci U S A. 2014;111:17330–5. doi: 10.1073/pnas.1411932111. [DOI] [PMC free article] [PubMed] [Google Scholar]
- 44.Pedraza JM. Science (80-) 2005 doi: 10.1126/science.1109090. [DOI] [PubMed] [Google Scholar]
- 45.Hersen P, McClean MN, Mahadevan L, Ramanathan S. Proc Natl Acad Sci U S A. 2008;105:7165–70. doi: 10.1073/pnas.0710770105. [DOI] [PMC free article] [PubMed] [Google Scholar]
- 46.Ingolia NT, Weissman JS. Nature. 2008;454:1059–1062. doi: 10.1038/4541059a. [DOI] [PubMed] [Google Scholar]
- 47.Mettetal JT, Muzzey D, Gómez-Uribe C, van Oudenaarden A. Science. 2008;319 doi: 10.1126/science.1151582. [DOI] [PMC free article] [PubMed] [Google Scholar]
- 48.Koshland DE, Koshland DE, Stadtman ER, Thomas D. Trends Biochem Sci. 1987;12:225–229. [Google Scholar]
Associated Data
This section collects any data citations, data availability statements, or supplementary materials included in this article.