
FIG. 6.
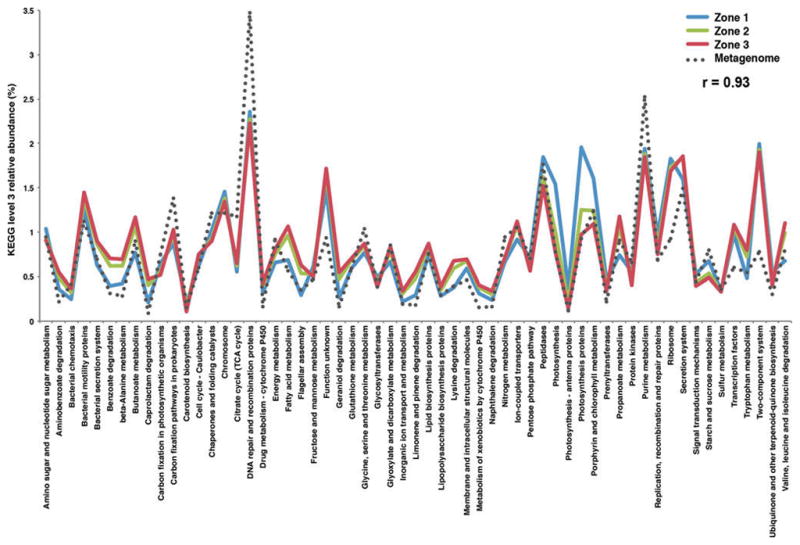
Functional gene comparison of the three thrombolitic mat spatial zones from 16S rRNA metabolic prediction (PICRUSt) and whole shotgun sequencing. Pearson correlation value (r) is shown for the comparison of metabolic predictions for Zone 1 (blue), Zone 2 (green), and Zone 3 (red) and the whole mat shotgun metagenome.