Abstract
High-resolution peripheral quantitative computed tomography (HR-pQCT) derived micro-finite element (FE) modeling is used to evaluate mechanical behavior at the distal radius microstructure. However, these analyses typically simulate non-physiologic simplified platen-compression boundary conditions on a small section of the distal radius. Cortical and trabecular regions contribute uniquely to distal radius mechanical behavior, and various factors affect these regions distinctly. Generalized strength predictions from standardized platen-compression analyses may not adequately capture region specific responses in bone. Our goal was to compare load sharing within the cortical-trabecular compartments between the standardized platen-compression BC simulations, and physiologic BC simulations using a validated multiscale approach. Clinical- and high-resolution images were acquired from nine cadaveric forearm specimens using an HR-pQCT scanner. Multiscale FE models simulating physiologic BCs, and micro-FE only models simulating platen-compression BCs were created for each specimen. Cortical and trabecular loads (N) along the length of the distal radius micro-FE section were compared between BCs using correlations. Principal strain distributions were also compared quantitatively. Cortical and trabecular loads from the platen-compression BC simulations were strongly correlated to the physiologic BC simulations. However, a 30% difference in cortical loads distally, and a 53% difference in trabecular loads proximally was observed under platen BC simulations. Also, distribution of principal strains was clearly different. Our data indicated that platen-compression BC simulations alter cortical-trabecular load sharing. Therefore, results from these analyses should be interpreted in the appropriate mechanical context for clinical evaluations of normal and pathologic mechanical behavior at the distal radius.
Keywords: Cortical-Trabecular Microstructure, Load Sharing, Multiscale, Boundary Conditions, Finite Element Analysis
1. Introduction
Mechanical behavior of the distal radius microstructure can be assessed using micro-scale finite element (FE) models generated from high-resolution peripheral quantitative computed tomography (HR-pQCT) images. However, due to practical constraints, only a 9 mm region of the distal radius is typically evaluated. Bone microstructure segmented from the images are typically converted into a micro-FE voxel mesh, and simplified platen-compression boundary conditions (BCs) are simulated (Macneil and Boyd, 2008). Strength outcomes (stiffness, failure load) from these standardized BC analyses are increasingly being used for clinical evaluations of mechanical behavior at the distal radius (Schafer et al., 2013; Tsai et al., 2015). In longitudinal comparative studies standardized analyses are attractive due to their repeatability, and the non-physiologic assumptions of simplified BCs may not be crucial. However, limiting mechanical outcomes to generalized (whole-bone) strength predictions may not fully exploit the potential of micro-FE analyses where region specific contributions can be delineated.
Mechanical and adaptive response of bone is site and region specific (Ducher et al., 2004). The distal radius is comprised of cortical and trabecular bone, which exhibit unique mechanical behavior, and there exist complex interactions between the two regions (Schneider et al., 2001; Spadaro et al., 1994). The trabecular region plays a role in transferring joint surface loads to the cortical region (Oftadeh et al., 2015). Age (Ding et al., 2002), disease (Bono and Einhorn, 2003; Johnston and Slemenda, 1995), and therapeutic interventions (Schafer et al., 2013) alter the structural, material, and mechanical properties of cortical and trabecular regions distinctly. Therefore, identifying region specific bone mechanical responses may prove to be a clinically useful tool.
The degree, to which mechanical behavior predicted under the standardized simplified assumptions is physiologic, is not known. Mechanical behavior of the distal radius is highly dependent on BCs (Edwards and Troy, 2011; Troy and Grabiner, 2007). To effectively predict age, pathologic, or therapeutic changes that alter normal behavior, the mechanical behavior of the cortical-trabecular regions under physiologically relevant conditions must be understood. To perform time- and computationally-efficient micro-FE simulations of physiologic mechanical behavior at the distal radius microstructure, we developed and validated a multiscale approach (Johnson and Troy, 2017). Our method combines continuum-FE and micro-FE (macro-micro-scale) meshes applying physiologic BCs.
Hence, the primary goal of this study was to evaluate cortical-trabecular load sharing in the distal radius microstructure. We also compared distribution of principal strains within the cortical and trabecular regions. First, we evaluated mechanical response under physiologic BC simulations using our multiscale approach. Then, we compared mechanical behavior under the commonly applied platen-compression BCs. We hypothesized that cortical-trabecular load sharing would be different under the standardized platen-compression BCs.
2. Methods
2.1. Specimens and Image Acquisition
The data reported here were acquired as part of an earlier validation study for the multiscale modeling used here (Johnson and Troy, 2017). One specimen in that study was found to have a recently healed radial styloid tip fracture, and was therefore excluded from the present analyses. Briefly, nine fresh-frozen cadaveric forearm specimens (4 males, 5 females; mean age 67±13 years) with no visible pathologies were included. A 11 cm region of the proximal wrist (oriented in 60° extension) and distal forearm was scanned at clinical-resolution (246×246×246 µm voxels, 126 mm field of view) using an XtremeCT HR-pQCT scanner (Scanco Medical, Switzerland). Also, a 9 mm region of the distal radius was scanned at high-resolution using the manufacturer’s standard protocol (82×82×82 µm voxels, 126 mm field of view, 110 slices). The 9 mm distal radius region was located at 9.5 ± 1.7% length (mean ± SD; ratio of the distance of the distal end of the region from the styloid tip, to forearm length), which was in the vicinity of the clinically relevant site of distal radius fractures. The growth plate, corresponding to the location of maximum cross-sectional area, was located at 5.3 ± 0.6% length. A phantom with known calcium hydroxyapatite equivalent densities was used to calibrate all CT images (Model# KP70, Lot# K70-05-51, Scanco Medical).
2.2. Modeling Procedures
Two types of FE models were created for each specimen (Fig. 1): multiscale (continuum-FE+micro-FE) simulating physiologic BCs (Johnson and Troy, 2017), and micro-FE only simulating simplified platen-compression BCs (Boutroy et al., 2008; Macneil and Boyd, 2008).
Figure 1.
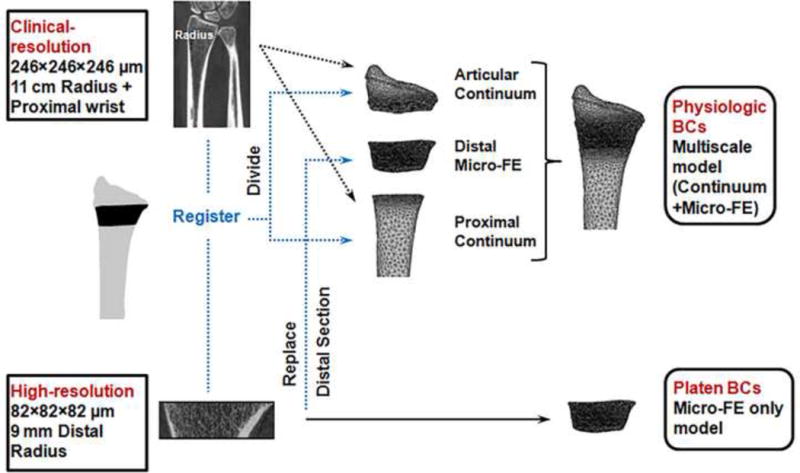
Workflow of the modeling procedures for physiologic and platen-compression boundary condition (BC) analyses.
Physiologic Boundary Conditions (Multiscale Model Analysis)
Our validated multiscale approach (model predicted versus experimentally measured strains: r = 0.87, p < 0.001), described in detail elsewhere (Johnson and Troy, 2017), involves replacing a matching region of the continuum (macro-scale) organ-level radius with the corresponding micro-FE section incorporating microstructure (Fig. 1). The multiscale radius models included three sections; articular continuum, distal micro-FE, and proximal continuum (Fig. 2A) and consisted of 10,248,235 ± 2,547,342 degrees of freedom (see appendix for details).
Figure 2.
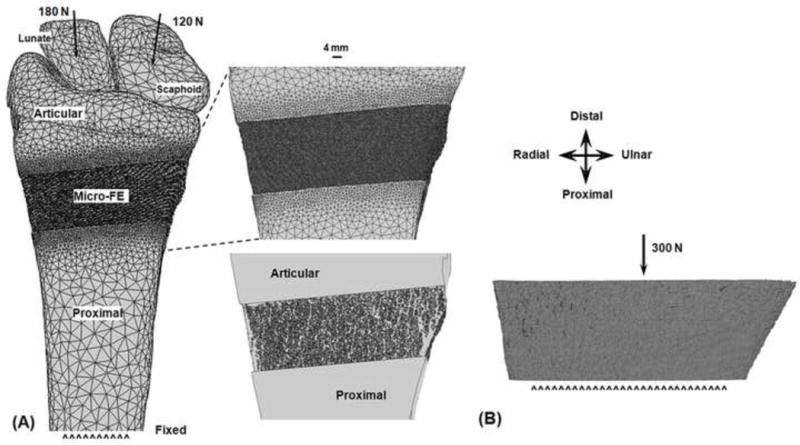
Finite element (FE) setup of the multiscale model analyses simulating physiologic boundary conditions through the extended wrist (A). Inset shows an enlarged anterior surface view of the distal micro-FE section, and articular and proximal section interfaces (top), and a view through the cross-section showing microstructure (bottom). FE setup of the platen-compression analyses (B).
Multiscale analyses were performed using Abaqus (Simulia, Providence, RI). An axial load of 300 N directed proximally was applied through the centroids of the scaphoid (180 N) and lunate [120 N (Majima et al., 2008)], with a 1.0 cm region of the proximal radius nodes fixed. This BC corresponds to the physiologic forearm orientation of leaning onto the palm and applying an axial load. All simulations were performed on a UNIX server with 16–30 processors (2.2–2.9 GHz) and 40–140 GB RAM.
Platen-Compression Boundary Conditions (Micro-FE Only Model Analysis)
The same micro-FE distal sections from the multiscale model analyses were implemented (Fig. 2B). The model setup for the platen BC analyses was similar to the manufacturer’s standardized procedures (IPL, Scanco Medical, Switzerland). A 300 N axial load was applied to the distal surface, while the proximal surface was fixed. The platen BC analyses were also performed using Abaqus.
2.3. Outcome Measures and Statistical Analyses
Load sharing through the cortical and trabecular regions was evaluated along the 9 mm length (110 slices) of the distal micro-FE section. Cortical and trabecular regions (Fig. 3) were defined according to the manufacturer’s standard protocols using the dual-threshold method (Buie et al., 2007; Burghardt et al., 2010a; Burghardt et al., 2010b). Loads (N) were calculated using the following equation,
where σzz is the longitudinal component of the Cauchy stress tensor, and A is the area in the transverse plane, of each ith element within the cortical/trabecular regions. To account for artifacts due to the constraints at the continuum-micro-FE section interfaces, data from elements located within two voxels of the interfaces were excluded from the analysis, leaving 106 remaining slices (Johnson and Troy, 2017). To account for between-specimen variations in the location of the distal micro-FE section along the length of the radius, cortical and trabecular loads were grouped according to forearm length ratios. For each specimen, the distance of the micro-FE section from the radial styloid tip was expressed as a percentage of specimen forearm length. The specimen with the most distal location of the micro-FE section was selected as the reference. For the remaining specimens, using the forearm length ratios, the offset in number of slices from the reference specimen was then determined with respect to the forearm length of the reference specimen. Cortical and trabecular loads were then grouped according to the slice offsets and averaged across the nine specimens.
Figure 3.
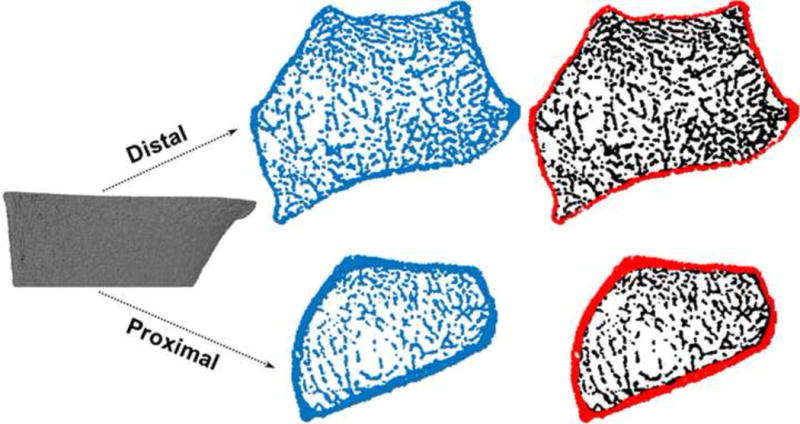
Division of the distal micro-FE section (left column) into cortical and trabecular regions (right column). Only the distal and proximal ends are shown.
Cortical-trabecular load sharing along the length of the micro-FE section was compared between the physiologic (multiscale) and platen-compression BCs. Correlations between curves were assessed using the cross-correlation (CC) function in Matlab, and the method of Oberkampf and Trucano [OT (Burkhart et al., 2014; Oberkampf and Trucano, 2002)] as follows,
where N is the number of data points, and V = 1 indicates perfect correlation. For an overall perspective, percent cortical-trabecular load share averaged across the micro-FE section was also compared between BCs using paired statistical comparisons. To compare principal strain distributions between BCs, for each specimen, elements within the respective cortical and trabecular compartments of the micro-FE section were binned according to ranges of element maximum principal strain (1–400 µε; 50 µε increments). The number of elements within each bin was compared between the two BCs using paired comparisons. This consisted of either paired t-tests or Wilcoxon signed-rank tests, depending on whether the data were normally or non-normally distributed. Criterion α=0.05 was defined as significant.
3. Results
Figure 4 (left) shows a comparison of the load sharing curves averaged across the specimens between the physiologic and platen BC simulations, plotted along the length of the reference specimen. Because the relative location of the micro-FE section varied between specimens, not every point along the length of the reference specimen contained data from all specimens. Figure 4 (right) provides an estimate of between-specimen variability at specific locations along the length of the reference specimen; a) distal (for n = 3 minimum), b) cross-over point (equal cortical-trabecular load share; n = 4), c) location where maximum overlap occurred between specimens (n = 7), d) location of maximum difference between BCs (n = 5), e) proximal (for n = 3 minimum). Cortical loads from the platen-compression BC simulations were strongly correlated to the physiologic BC simulations (CC: 0.998, OT: 0.936). Trabecular loads from the platen-compression BC simulations were marginally less but also well correlated to the physiologic BC simulations (CC: 0.991, OT: 0.814). However, at the distal end, cortical loads were 30% higher and trabecular loads were 13% lower in platen BC simulations. The largest difference between simulations (53%) was observed proximally in the trabecular region. On average, percent cortical load share was lower under platen-compression BCs (63.4 ± 14.0% versus 66.4 ± 17.4%, p < 0.001), while percent trabecular load share was higher (36.6 ± 14.0% versus 33.6 ± 17.4%, p < 0.001), compared to physiologic BCs.
Figure 4.
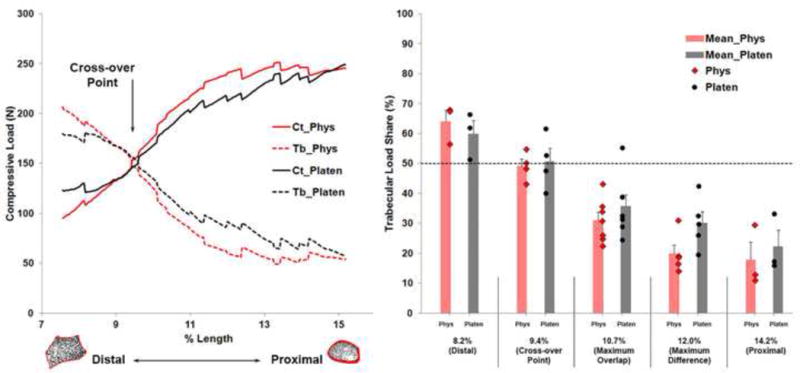
Average cortical (Ct) and trabecular (Tb) load share compared between the physiologic (Phys) and platen-compression (Platen) analyses plotted along the length of the reference specimen (Left). Data from nine specimens were grouped relative to the reference specimen. Shown is the cross-over point where cortical-trabecular load sharing was equal. Trabecular load share compared at specific locations along the length of the reference specimen indicating between-specimen variability (Right). Error bars indicate standard error. Dashed line indicates 50% load share. Cortical load share (not shown) can be calculated as 100 minus trabecular load share.
Comparing distribution of principal strains, there were fewer elements within the higher strain range bins (>150 µε) under platen-compression BCs, which shifted towards the lower strain range bins (51–100, 101–150 µε) for both compartments (Fig. 5). Principal strain distribution was consistently different between the two simulations for all specimens (Fig. S1, S2).
Figure 5.
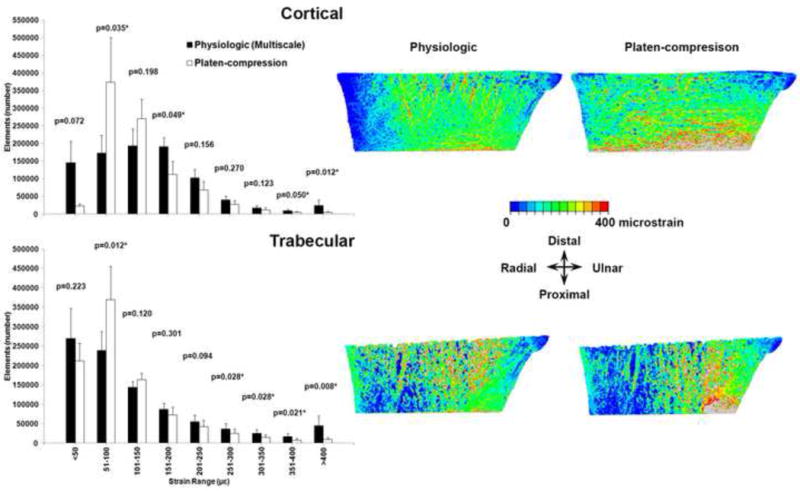
Distribution of maximum (tensile) principal strain within the cortical (top row) and trabecular (bottom row) compartments, compared between the physiologic and platen-compression analyses. Under platen-compression, elements shifted towards the lower strain range bins from the higher strain range bins (Left). Data presented are the averages for all specimens and error bars indicate standard error. * indicates significant differences. Color map (Right) confirms the change in locations of periosteal surface (top row) and internal (bottom row) strains under platen-compression (specimen 3 data is shown from an anterior perspective. Refer to Figures S1 and S2 for data from all specimens).
4. Discussion
To our knowledge, this is the first study to evaluate cortical-trabecular load sharing along the length of the distal radius microstructure. We compared mechanical behavior in the distal radius microstructure between standardized platen-compression BC and physiologic BC micro-FE simulations. Our results demonstrated altered cortical-trabecular load sharing and strain distribution under platen-compression BCs.
Under physiologic BCs, majority of the load was borne by the trabecular region at the distal end, and load shifted to the cortical region from distal to proximal (Fig. 4 left). Since the distal radius is composed primarily of trabecular bone (thin cortex), becoming predominantly cortical proximally, this behavior was expected. Thus the physiologic role of the trabecular region in transmitting joint surface loads gradually to the robust cortical region is achieved (Oftadeh et al., 2015), while optimizing the specialized weight-to-strength structural design of bone.
Under platen-compression BCs distal load bearing shifted from the trabecular region to the cortical region (Fig. 4 left), likely due to alterations in mechanical behavior caused by the platen-compression BCs. Directly compressing a small distal micro-FE section may result in the stiffer cortical region bearing more load, versus initial displacement of trabecular elements followed by load transfer to the cortex, physiologically. This is further confirmed by the more evenly distributed strains on the periosteal surface under platen-compression BCs (Fig. 5, S1). Considering that the goal of standardized platen-compression analyses is to evaluate mechanical strength, the resulting homogenized strain distribution would detract from the higher strain regions under physiologic BCs, where localized responses would more likely occur [for example, remodeling (Mullender et al., 1994; Szwedowski et al., 2012) or failure (Carter et al., 1981; Schaffler et al., 1990)]. Also, platen-compression BC results tended towards equal load sharing between the two compartments (approaching 150 N), as opposed to load transference, physiologically (Fig. 4).
Platen-compression micro-FE simulations are increasingly being used for clinical evaluations of mechanical behavior at the distal radius. Typically, changes in generalized strength variables (stiffness, failure load) are evaluated after therapeutic intervention (Schafer et al., 2013; Tsai et al., 2015). Based on our results, outcomes observed in these studies must be interpreted with caution. Using generalized strength predications can fail to capture between-group differences that result from known region specific (cortical vs. trabecular) mechanisms of action of the intervention (Schafer et al., 2013), or region specific contributions to the progression of pathology (Bono and Einhorn, 2003; Johnston and Slemenda, 1995). The strength of standardized platen-compression analyses implementing generalized strength variables, may lie in observing longitudinal changes from a measured reference, and not predicting physiologic magnitudes or region specific responses. For clinical studies, in an ideal scenario, or depending on the question being answered, we suggest incorporating the cortical-trabecular load share metric to accurately evaluate region specific responses provided physiologic BCs are simulated.
Also, there is potential for data from standardized platen-compression analyses to deviate from physiologic if studies only focus on results at either the distal or proximal end (Boutroy et al., 2008; Vilayphiou et al., 2010; Vilayphiou et al., 2011), versus the length of the distal micro-FE section. Our results indicate there exists a cross-over point where trabecular and cortical loads are shared equally, likely due to similar bone mineral content at the location. The cross-over point occurred at a similar location between specimens and appeared independent of BCs. On average, the cross-over point was located at 9.4 ± 0.3% length and 9.7 ± 1.0% length under physiologic and platen-compression BCs, respectively. Realistically, it may not be possible to perform physiologic BC simulations for all HR-pQCT applications. If standardized platen-compression BCs are implemented, or if data are to be evaluated at a specific location, we suggest using the cross-over point region where differences between physiologic and platen-compression BC simulations are minimal.
One limitation is that our data represent a middle-aged to elderly population (range 46–89 years). However, the load sharing profiles are likely age independent. Future work will better delineate cortical-trabecular load sharing differences in a wider age range, which was beyond the current scope. There is potential for error when combining cortical-trabecular loads from the distal micro-FE sections between specimens. However, we believe using the objective method of forearm length ratios minimized this error. Defining the boundary between cortical-trabecular regions is another potential source of error, which was minimized through use of an automated algorithm (Buie et al., 2007; Burghardt et al., 2010a; Burghardt et al., 2010b) that was consistently objective between specimens. HR-pQCT studies also commonly report the cortical-trabecular average stress parameter (Boutroy et al., 2008; Vilayphiou et al., 2010; Vilayphiou et al., 2011). Because the cortical-trabecular loads in this study were calculated from stress, we considered presenting stress data as redundant. Rather, we presented data on strains (changes in distribution), which is relevant in the context of local adaptive response of bone to a mechanical stimulus (Mullender et al., 1994; Szwedowski et al., 2012), and localized microdamage accumulation leading to failure (Carter et al., 1981; Schaffler et al., 1990). The relatively low number of specimens was another limitation of the study.
In conclusion, platen-compression BC simulations alter cortical-trabecular load sharing by more evenly distributing forces between the two compartments. Results from these standardized analyses should be interpreted in the appropriate mechanical context for clinical evaluations of normal and pathologic mechanical behavior at the distal radius.
Supplementary Material
Figure S1. Distribution of maximum (tensile) principal strain within the cortical compartment compared between the physiologic and platen-compression analyses for all specimens. The anterior periosteal surface is shown here.
Figure S2. Distribution of maximum (tensile) principal strain within the trabecular compartment compared between the physiologic and platen-compression analyses for all specimens. A cross-section of the anterior interior trabecular structure is shown here.
Acknowledgments
Research supported in this publication was supported by NIAMS of the National Institutes of Health under award numbers F32AR068839 and R01AR063691. The content is solely the responsibility of the authors and does not necessarily represent the official views of the NIH.
Footnotes
Publisher's Disclaimer: This is a PDF file of an unedited manuscript that has been accepted for publication. As a service to our customers we are providing this early version of the manuscript. The manuscript will undergo copyediting, typesetting, and review of the resulting proof before it is published in its final citable form. Please note that during the production process errors may be discovered which could affect the content, and all legal disclaimers that apply to the journal pertain.
Conflict of Interest
We have no conflicts to disclose.
Contributor Information
Joshua E Johnson, Worcester Polytechnic Institute, Department of Biomedical Engineering, 100 Institute Road, Worcester, MA 01609, United States.
Karen L Troy, Worcester Polytechnic Institute, Department of Biomedical Engineering, 100 Institute Road, Worcester, MA 01609, United States.
References
- Bono CM, Einhorn TA. Overview of osteoporosis: pathophysiology and determinants of bone strength. European spine journal : official publication of the European Spine Society, the European Spinal Deformity Society, and the European Section of the Cervical Spine Research Society. 2003;12(Suppl 2):S90–96. doi: 10.1007/s00586-003-0603-2. [DOI] [PMC free article] [PubMed] [Google Scholar]
- Boutroy S, Van Rietbergen B, Sornay-Rendu E, Munoz F, Bouxsein ML, Delmas PD. Finite element analysis based on in vivo HR-pQCT images of the distal radius is associated with wrist fracture in postmenopausal women. Journal of bone and mineral research : the official journal of the American Society for Bone and Mineral Research. 2008;23:392–399. doi: 10.1359/jbmr.071108. [DOI] [PubMed] [Google Scholar]
- Buie HR, Campbell GM, Klinck RJ, MacNeil JA, Boyd SK. Automatic segmentation of cortical and trabecular compartments based on a dual threshold technique for in vivo micro-CT bone analysis. Bone. 2007;41:505–515. doi: 10.1016/j.bone.2007.07.007. [DOI] [PubMed] [Google Scholar]
- Burghardt AJ, Buie HR, Laib A, Majumdar S, Boyd SK. Reproducibility of direct quantitative measures of cortical bone microarchitecture of the distal radius and tibia by HR-pQCT. Bone. 2010a;47:519–528. doi: 10.1016/j.bone.2010.05.034. [DOI] [PMC free article] [PubMed] [Google Scholar]
- Burghardt AJ, Kazakia GJ, Ramachandran S, Link TM, Majumdar S. Age- and gender-related differences in the geometric properties and biomechanical significance of intracortical porosity in the distal radius and tibia. Journal of bone and mineral research : the official journal of the American Society for Bone and Mineral Research. 2010b;25:983–993. doi: 10.1359/jbmr.091104. [DOI] [PMC free article] [PubMed] [Google Scholar]
- Burkhart TA, Quenneville CE, Dunning CE, Andrews DM. Development and validation of a distal radius finite element model to simulate impact loading indicative of a forward fall. Proceedings of the Institution of Mechanical Engineers. Part H, Journal of engineering in medicine. 2014;228:258–271. doi: 10.1177/0954411914522781. [DOI] [PubMed] [Google Scholar]
- Carter DR, Caler WE, Spengler DM, Frankel VH. Fatigue behavior of adult cortical bone: the influence of mean strain and strain range. Acta orthopaedica Scandinavica. 1981;52:481–490. doi: 10.3109/17453678108992136. [DOI] [PubMed] [Google Scholar]
- Ding M, Odgaard A, Linde F, Hvid I. Age-related variations in the microstructure of human tibial cancellous bone. Journal of orthopaedic research : official publication of the Orthopaedic Research Society. 2002;20:615–621. doi: 10.1016/S0736-0266(01)00132-2. [DOI] [PubMed] [Google Scholar]
- Ducher G, Prouteau S, Courteix D, Benhamou CL. Cortical and trabecular bone at the forearm show different adaptation patterns in response to tennis playing. Journal of clinical densitometry : the official journal of the International Society for Clinical Densitometry. 2004;7:399–405. doi: 10.1385/jcd:7:4:399. [DOI] [PubMed] [Google Scholar]
- Edwards WB, Troy KL. Simulating distal radius fracture strength using biomechanical tests: a modeling study examining the influence of boundary conditions. Journal of biomechanical engineering. 2011;133:114501. doi: 10.1115/1.4005428. [DOI] [PubMed] [Google Scholar]
- Johnson JE, Troy KL. Validation of a new multiscale finite element analysis approach at the distal radius. Medical Engineering and Physics. 2017 doi: 10.1016/j.medengphy.2017.03.005. http://dx.doi.org/10.1016/j.medengphy.2017.1003.1005. [DOI] [PMC free article] [PubMed]
- Johnston CC, Jr, Slemenda CW. Pathogenesis of osteoporosis. Bone. 1995;17:19s–22s. doi: 10.1016/8756-3282(95)00202-o. [DOI] [PubMed] [Google Scholar]
- Macneil JA, Boyd SK. Bone strength at the distal radius can be estimated from high-resolution peripheral quantitative computed tomography and the finite element method. Bone. 2008;42:1203–1213. doi: 10.1016/j.bone.2008.01.017. [DOI] [PubMed] [Google Scholar]
- Majima M, Horii E, Matsuki H, Hirata H, Genda E. Load transmission through the wrist in the extended position. The Journal of hand surgery. 2008;33:182–188. doi: 10.1016/j.jhsa.2007.10.018. [DOI] [PubMed] [Google Scholar]
- Mullender MG, Huiskes R, Weinans H. A physiological approach to the simulation of bone remodeling as a self-organizational control process. Journal of biomechanics. 1994;27:1389–1394. doi: 10.1016/0021-9290(94)90049-3. [DOI] [PubMed] [Google Scholar]
- Oberkampf WL, Trucano TG. Verification and validation in computational fluid dynamics. Progress in Aerospace Sciences. 2002;38:209–272. [Google Scholar]
- Oftadeh R, Perez-Viloria M, Villa-Camacho JC, Vaziri A, Nazarian A. Biomechanics and mechanobiology of trabecular bone: a review. Journal of biomechanical engineering. 2015;137 doi: 10.1115/1.4029176. [DOI] [PMC free article] [PubMed] [Google Scholar]
- Schafer AL, Burghardt AJ, Sellmeyer DE, Palermo L, Shoback DM, Majumdar S, Black DM. Postmenopausal women treated with combination parathyroid hormone (1–84) and ibandronate demonstrate different microstructural changes at the radius vs. tibia: the PTH and Ibandronate Combination Study (PICS) Osteoporosis international : a journal established as result of cooperation between the European Foundation for Osteoporosis and the National Osteoporosis Foundation of the USA. 2013;24:2591–2601. doi: 10.1007/s00198-013-2349-y. [DOI] [PubMed] [Google Scholar]
- Schaffler MB, Radin EL, Burr DB. Long-term fatigue behavior of compact bone at low strain magnitude and rate. Bone. 1990;11:321–326. doi: 10.1016/8756-3282(90)90087-f. [DOI] [PubMed] [Google Scholar]
- Schneider P, Reiners C, Cointry GR, Capozza RF, Ferretti JL. Bone quality parameters of the distal radius as assessed by pQCT in normal and fractured women. Osteoporosis international : a journal established as result of cooperation between the European Foundation for Osteoporosis and the National Osteoporosis Foundation of the USA. 2001;12:639–646. doi: 10.1007/s001980170063. [DOI] [PubMed] [Google Scholar]
- Spadaro JA, Werner FW, Brenner RA, Fortino MD, Fay LA, Edwards WT. Cortical and trabecular bone contribute strength to the osteopenic distal radius. Journal of orthopaedic research : official publication of the Orthopaedic Research Society. 1994;12:211–218. doi: 10.1002/jor.1100120210. [DOI] [PubMed] [Google Scholar]
- Szwedowski TD, Taylor WR, Heller MO, Perka C, Muller M, Duda GN. Generic rules of mechano-regulation combined with subject specific loading conditions can explain bone adaptation after THA. PloS one. 2012;7:e36231. doi: 10.1371/journal.pone.0036231. [DOI] [PMC free article] [PubMed] [Google Scholar]
- Troy KL, Grabiner MD. Off-axis loads cause failure of the distal radius at lower magnitudes than axial loads: a finite element analysis. Journal of biomechanics. 2007;40:1670–1675. doi: 10.1016/j.jbiomech.2007.01.018. [DOI] [PMC free article] [PubMed] [Google Scholar]
- Tsai JN, Uihlein AV, Burnett-Bowie SA, Neer RM, Zhu Y, Derrico N, Lee H, Bouxsein ML, Leder BZ. Comparative effects of teriparatide, denosumab, and combination therapy on peripheral compartmental bone density, microarchitecture, and estimated strength: the DATA-HRpQCT Study. Journal of bone and mineral research : the official journal of the American Society for Bone and Mineral Research. 2015;30:39–45. doi: 10.1002/jbmr.2315. [DOI] [PMC free article] [PubMed] [Google Scholar]
- Vilayphiou N, Boutroy S, Sornay-Rendu E, Van Rietbergen B, Munoz F, Delmas PD, Chapurlat R. Finite element analysis performed on radius and tibia HR-pQCT images and fragility fractures at all sites in postmenopausal women. Bone. 2010;46:1030–1037. doi: 10.1016/j.bone.2009.12.015. [DOI] [PubMed] [Google Scholar]
- Vilayphiou N, Boutroy S, Szulc P, van Rietbergen B, Munoz F, Delmas PD, Chapurlat R. Finite element analysis performed on radius and tibia HR-pQCT images and fragility fractures at all sites in men. Journal of bone and mineral research : the official journal of the American Society for Bone and Mineral Research. 2011;26:965–973. doi: 10.1002/jbmr.297. [DOI] [PubMed] [Google Scholar]
Associated Data
This section collects any data citations, data availability statements, or supplementary materials included in this article.
Supplementary Materials
Figure S1. Distribution of maximum (tensile) principal strain within the cortical compartment compared between the physiologic and platen-compression analyses for all specimens. The anterior periosteal surface is shown here.
Figure S2. Distribution of maximum (tensile) principal strain within the trabecular compartment compared between the physiologic and platen-compression analyses for all specimens. A cross-section of the anterior interior trabecular structure is shown here.


