

Abstract
Evaluation of abnormalities in joint contact stress that develop after inaccurate reduction of an acetabular fracture may provide a potential means for predicting the risk of developing post-traumatic osteoarthritis. Discrete element analysis (DEA) is a computational technique for calculating intra-articular contact stress distributions in a fraction of the time required to obtain the same information using the more commonly employed finite element analysis technique. The goal of this work was to validate the accuracy of DEA-computed contact stress against physical measurements of contact stress made in cadaveric hips using Tekscan sensors. Four static loading tests in a variety of poses from heel-strike to toe-off were performed in two different cadaveric hip specimens with the acetabulum intact and again with an intentionally malreduced posterior wall acetabular fracture. DEA-computed contact stress was compared on a point-by-point basis to stress measured from the physical experiments. There was good agreement between computed and measured contact stress over the entire contact area (correlation coefficients ranged from 0.88-0.99). DEA-computed peak contact stress was within an average of 0.5 MPa (range 0.2 MPa - 0.8 MPa) of the Tekscan peak stress for intact hips, and within an average of 0.6 MPa (range 0 – 1.6 MPa) for fractured cases. DEA-computed contact areas were within an average of 33% of the Tekscan-measured areas (range: 1.4% - 60%). These results indicate that the DEA methodology is a valid method for accurately estimating contact stress in both intact and fractured hips.
Keywords: Discrete Element Analysis, Acetabular Fracture, Hip, Contact Stress, Tekscan
Introduction
It has been reported that as many as one in four acetabular fracture patients will rapidly progress to develop post-traumatic osteoarthritis (PTOA) of the hip (Bhandari et al., 2006; Dirschl et al., 2004; Matta, 1996; Saterbak et al., 2000). The likelihood of developing PTOA after an intra-articular fracture has been associated with quality of articular reduction and increases in joint contact stress (Anderson et al., 2011; Kern and Anderson, 2015). Residual incongruity is common in surgically reconstructed acetabular fractures, where incongruities of 1-3 mm are often considered satisfactory reductions (Borrelli et al., 2002; Moed et al., 2003) despite biomechanical studies demonstrating that 1 mm and 2 mm articular step-offs increase joint contact stress by 23% and 48%, respectively (Malkani et al., 2001).
The primary goal of surgical reduction is restoration of an anatomic joint surface, the necessity of which has been illustrated by numerous mechanical studies across both fractured and intact joints showing a direct correlation between elevated joint contact stress and development of osteoarthritis (Anderson et al., 2011; Hadley et al., 1990; Kern and Anderson, 2015; Maxian et al., 1995; Segal et al., 2009; Segal et al., 2012). This association indicates that joint contact stress may be useful as a predictor of a patient's risk for developing PTOA. Though joint contact stress can be obtained in vivo (Anderson et al., 2003; Bergmann et al., 2001; Bergmann et al., 1999; Hodge et al., 1989; Hodge et al., 1986), such measurements are highly invasive and are only realistic in small patient cohorts and under extremely controlled conditions.
Joint contact stress is most commonly assessed in living patients using non-invasive computational modeling techniques such as finite element analysis (FEA) (Harris et al., 2012; Henak et al., 2014a; Rhyu et al., 2011). Unfortunately, the technical burden required to develop and run patient-specific FE models is substantial, with mesh generation and establishment of numerically stable contact conditions requiring many days or weeks of effort, and model runtimes that range from hours to days depending on model complexity. Consequently, even purportedly large-scale patient-specific FEA investigations have been limited to less than 15-20 patients (Harris et al., 2012; Henak et al., 2014a; Li et al., 2008).
Discrete element analysis (DEA) is another computational method that has been utilized for determining intra-articular contact stress in many different joints (Anderson et al., 2010b; Chao et al., 2010; Volokh et al., 2007). In DEA, cartilage is modeled as an array of compressive springs between rigid bony surfaces, eliminating the need for development of a continuum mesh and greatly simplifying model generation relative to FEA. Contact stress is computed by balancing applied loads with cartilage spring forces using numerically stable and rapidly executing methods that provide solutions within seconds. While DEA methodology sacrifices continuum mechanics information and the use of advanced material property definitions, it can provide joint contact stress estimations in a fraction of the time required to obtain similar information using FEA, making it an appealing technique for application to larger patient cohorts (Anderson et al., 2010b; Segal et al., 2009; Segal et al., 2012).
DEA models of articular joints can be developed using specimen-specific cartilage surfaces (Abraham et al., 2013; Segal et al., 2009; Segal et al., 2012) or approximated cartilage surfaces – most often generated by prescribing a uniform projection from subchondral bone (Anderson et al., 2007; Kern and Anderson, 2015). In some DEA models of the hip, cartilage surfaces have been defined as spherically congruent projections from the subchondral bone (Genda et al., 2001; Yoshida et al., 2006), which results in calculation of contact stress values lower than those measured in physical experiments (Hodge et al., 1989; Hodge et al., 1986). In contrast, systematic exploration of many of the assumptions of the DEA methodology has shown that projected cartilage surfaces and rigid underlying bone result in calculation of contact stress values higher than those measured physically (Anderson et al., 2010a), and even DEA performed using specimen-specific cartilage data results in contact stress at least 15% higher than that obtained using FEA (Abraham et al., 2013). Given that specimen-specific DEA models tend to over-predict, and spherically approximated DEA models tend to under-predict hip contact stress, there would seem to be some level of model approximation that could yield accurate calculations of contact stress using the DEA methodology.
To obtain hip contact stresses in acetabular fracture patients using DEA, model generation must be from a CT scan, which (without the use of a contrast agent) does not show cartilage. As metal artifact from fracture fixation hardware precludes use of MRI scans, and contrast from a CT arthrogram would leak through fractured surfaces, it is presently not possible to obtain cartilage geometry directly from clinical imaging in acetabular fracture patients. Therefore, cartilage information must be approximated from bony geometry for these patients, an approximation that it is important validate to determine the accuracy of resulting contact stress calculations. The objective of this work was to determine if DEA estimates of contact stress in both intact and imperfectly reduced fractured hips are valid by comparing DEA-computed contact stress to those physically measured from cadaveric preparations.
Methods
Specimen preparation
Two fresh-frozen cadaveric hemipelves were used for physical loading experiments. Specimen 1 was from a 170 cm, 63.5 kg, 71 year old male, and Specimen 2 was from a 183 cm, 79.4 kg, 37 year old male. Each was carefully dissected free of soft tissues down to the joint capsule and the acetabular labrum. The ilium was cut in an approximately transverse plane 10 cm superior to the acetabulum to fit in a pre-existing potting device. Using previously described instrumentation (Martin et al., 2015), the cut pelvis was oriented so that a vertically directed load along the axis of the femur corresponded with the hip loading vector during maximum load during walking (15 degrees abduction and 25 degrees flexion) (Bergmann et al., 2001). The ilium was embedded in a polymethylmethacrylate (PMMA) block in this position. The specimen was then inverted and the femur was transected mid-shaft and embedded vertically in a 5-cm diameter PMMA cylinder.
Loading apparatus
The experimental loading apparatus (Figure 1) was mounted in an MTS Bionix 858 test machine (MTS Inc., Minneapolis, MN). The lower assembly consisted of a compound sine plate and a set of dual orthogonal linear bearings (an XY-stage) attached to the load cell. The upper assembly was a short metal tube attached to the MTS linear/rotary actuator. For testing, each specimen was inverted and the pelvic PMMA block was bolted to the sine plate, which controlled hip flexion/extension and abduction/adduction. The femoral PMMA cylinder was locked into the upper tube so that the MTS could simultaneously apply axial load and femoral rotation. Once oriented in the testing fixture, the entire joint capsule was excised and the acetabular labrum was partially removed to permit insertion of the Tekscan sensor. Upon opening the joint, we visually confirmed macroscopically normal cartilage in Specimen 1 and noted the focal defect in Specimen 2 was sufficiently medial within the acetabulum so as to not be loaded in any testing poses. Specimens were sprayed copiously with saline throughout the potting process and each loading tests to prevent cartilage dehydration/degeneration.
Figure 1.

Photographs of the experimental loading fixture mounted in the MTS. The hip is inverted relative to its physiologic orientation. The individual fixturing components are indicated, and the axes about which anatomic rotations occur are shown (left). Upon completion of loading, a locking rod was added to the fixture (right) to maintain the relative positions of the femoral pot and the compound sine plate, and the portion of the device between the two yellow planes was transferred to the CT scanner for imaging.
Testing: Intact specimens
Specimen 1 was tested in a heel-strike pose (16.3° flexion; -5.5° abduction; 5.4° external rotation), and Specimen 2 was positioned to simulate heel-strike, mid-stance (0° flexion; -8.3° abduction; 6.7° external rotation), and toe-off (-6.9° flexion; -4° abduction; 8.7° external rotation) of normal walking gait (Bergmann et al., 2001). At the beginning of each test, the MTS was used to distract the femur from the acetabulum for insertion of a calibrated hip-specific pressure sensor (Model 4402, Tekscan, Inc. Boston, MA) (Rudert et al., 2014). The sensor was lubricated with petroleum jelly to minimize shear damage. Two investigators held the sensor with the outermost ring of the sensor even with the lateral rim of the acetabulum while the MTS actuator pushed the femoral head into contact with the acetabulum with 50 N of force. This compressive force then held the sensor in place for testing. For each test, the actuator applied a ramp load to 1,000 N, and joint contact pressure data were then recorded by the Tekscan sensor.
With the load still applied, a threaded rod was installed to lock the relative positions of the sine plate and femur tube (Figure 1, right) so that the specimen and sensor could be removed from the MTS as a rigid construct and transported for CT scanning (0.39 mm × 0.39 mm × 0.5 mm voxels). The sensing elements of the Tekscan sensor were visible in the CT scans (Figure 2), allowing for the Tekscan sensor location to be spatially registered to the adjacent bony anatomy. After CT scanning, the locking rod was removed, the femur and the Tekscan sensor were removed from the acetabulum, and the specimen was remounted in the MTS for the next gait pose. A newly calibrated Tekscan sensor was inserted and the pressure recording/CT-scan sequence was repeated.
Figure 2.

CT scan slice with the conductive wires of the Tekscan sensor visible (arrows).
Testing: Mal-reduced fracture specimens
After completion of the experiments in the various gait poses, an acetabular fracture was created in each specimen using a combination of saw and osteotome cuts. Fractures were fixed by an orthopaedic trauma surgeon using two interfragmentary screws and a buttress plate supported by two distal and two proximal screws (Figure 3). In Specimen 1, the fracture was intentionally reduced with a uniform 2-mm recessed step-off, and in Specimen 2 the fracture was reduced with an intentional inter-fragmentary gap plus a 1-2 mm recessed step-off. These malreductions are surgically realistic and would likely be considered acceptable reductions in a clinical setting (Ebraheim et al., 2007; Matta et al., 1986). The loading/pressure recording/CT-scan sequence was repeated at each gait pose in the fractured specimens.
Figure 3.

Photographs of the two different posterior wall fracture malreductions used for validating DEA-computed contact stress. Specimen 1 had a fairly uniform 2 mm step-off around the entirety of the fragment (arrows), while the majority of the malreduction in Specimen 2 was deeper in the acetabulum (arrows). Along the acetabular rim, the fracture fragment was relatively well aligned (brackets), making this a very clinically realistic pattern of malalignment. The blue lines on the labrum in Specimen 1 were intended to assist returning the specimen to the MTS in the same femoral rotation after fracture. These lines are absent in Specimen 2 because instead of the tissue, the PMMA blocks were marked during testing for this purpose.
DEA Model Generation
Two sets of DEA models were generated for comparison to the physical loading experiments. The first set incorporated specimen-specific cartilage thickness information obtained from an MRI scan (dual echo steady-state; 0.5 mm isotropic voxels) (Abraham et al., 2015) acquired prior to testing while the specimen was intact and unloaded. Femoral head and acetabular articular cartilage surfaces and underlying bony anatomy were manually segmented from the MRI scans using OsiriX software (Pixmeo, Geneva, Switzerland) and converted into triangulated surfaces using Geomagic Studio (Geomagic Inc., Research Triangle Park, NC). Cartilage thickness was defined as the perpendicular distance from each triangular facet on the articular surface to the subchondral bone. An iterative closest point algorithm was used to align the MRI-derived bone surfaces with CT-derived bone surfaces obtained with the bones locked in each testing position. Those transformations were then applied to the MRI-derived specimen-specific cartilage surfaces in order to bring them into the orientations used during physical loading experiments.
The second set of DEA models was generated entirely from the CT scans obtained after each physical loading experiment, simulating the most realistic option for DEA model generation in acetabular fracture patients. For these models, the cartilage surface was generated from each post-testing CT scan by isolating femoral head and acetabular subchondral bone from the full bone surfaces, and projecting that subchondral bone geometry 1 mm into the joint space along local surface normals. These projected articular surfaces were then iteratively smoothed towards sphericity using a custom algorithm (Shivanna, 2006). The Euclidean distance of each cartilage surface vertex from the center of a sphere fit to the entire projected surface was calculated. The location of each cartilage surface vertex was adjusted along a ray connecting that vertex to the sphere center by a distance equal to the difference between the vertex's radius and the average radius of the neighboring vertices within a 2 mm neighbor threshold. A 0.05 mm maximum radial change for each of smoothing 5 iterations was allowed, permitting a total maximum radial change of 0.25 mm, approximately half the distance of a CT voxel. The number of smoothing iterations was determined empirically from the intact heel strike model of Specimen 1 by choosing the number of iterations after which the DEA-computed contact stresses were closest to the physically measured contact stress data. As the goal of this work was to validate the results of a standarized modeling approach, these parameters were applied uniformly to generate the other seven projected-cartilage DEA models.
Contact Stress Calculations
The Tekscan sensor was calibrated (Rudert et al., 2014) before and upon completion of testing, and equal weighting was applied to the pre-test and post-test calibration curves when converting Tekscan raw pressure values (0-255) into contact stress values (MPa). A sensor was used for a maximum of two tests to limit the effects of sensor degradation.
For all DEA models, cartilage was assigned isotropic linear-elastic material properties (E = 12 MPa, ν = 0.42) (Kern and Anderson, 2015). Boundary and loading conditions applied to the models were identical to the physical loading experiments. DEA contact stress solutions were computed using a Newton's method solver implemented in MATLAB (Mathworks, Natick, MA) to match DEA spring forces with applied boundary conditions (Kern and Anderson, 2015). Run time for each DEA model was approximately 10 seconds in Matlab 2013b running on a desktop computer (IntelCore i7-6700 3.4 Gz; 16384MB RAM; 64-bit operating system).
Contact Stress Comparisons
The piezoresistive wires of the Tekscan sensor were visible in each CT scan (Figure 2), permitting direct segmentation and 3D surfacing of the Tekscan sensor as it was positioned in the joint during testing. Tekscan pressure data were mapped onto the 3D sensor geometry by subdividing the triangulated 3D sensor surface (mesh size ∼0.0295 mm2) into the 21 circumferential rings and 52 radial spokes of the physical sensor (sensel size 1.923 mm2), which resulted in approximately 65 surface triangles per Tekscan sensel. Every triangular facet within a sensel was assigned the measured value of that sensel. A ray casting technique was then used to identify the surface vertex on the acetabular cartilage surface closest location of each Tekscan sensor vertex (Figure 4). Spatial agreement between Tekscan and DEA data sets was then assessed using point-to-point correlation, omitting locations where both DEA and Tekscan were reporting zero stress. Peak contact stress and contact area were also compared between DEA models and physical loading experiments.
Figure 4.

(a) Photograph of the Tekscan sensor positioned inside the acetabulum of Specimen 1 for experimental testing. The circumferential rings of the sensor (black) are visible. (b) Surface model corresponding to Specimen 1 illustrating the segmented acetabular cartilage surface (blue) and the segmented Tekscan sensor (green). (c) Tekscan data were project to the cartilage surface to spatially register the Tekscan pressure data for direct comparison with DEA-generated contact stress distributions.
Results
Specimen-Specific Cartilage Models
Average cartilage thickness for Specimen 1 was 0.96 mm on the femoral head and 1.34 mm on the acetabulum. The average cartilage thickness for Specimen 2 was 1.33 mm on the femoral head and 1.67 mm on the acetabulum. Contact stress values computed using specimen-specific cartilage DEA models were highly correlated with Tekscan-measured values for intact hips (correlations greater than 0.94 in all phases of the gait cycle – Table 1). Specimen-specific cartilage DEA models also accurately approximated Tekscan-measured peak contact stress (average difference of 11%; range: 4% - 25%) for the intact state. Contact areas from DEA were within an average of 33% (range: 18% - 48%) of the physical measurements for intact hips.
Table 1.
Comparative contact area, peak contact stress, and stress correlation data for the intact and malreduced posterior wall fracture experiments. HS – heel strike; MS – mid stance; TO – toe off.
| Contact Area (mm2) | Peak Contact Stress (MPa) | Stress Correlation | ||||||||
|---|---|---|---|---|---|---|---|---|---|---|
|
| ||||||||||
| Specimen | State | Position | Tekscan | Specimen- Specific Cartilage DEA |
Projected Cartilage DEA |
Tekscan | Specimen- Specific Cartilage DEA |
Projected Cartilage DEA |
Specimen- Specific Cartilage DEA |
Projected Cartilage DEA |
| 1 | Intact | HS | 1562 | 808 | 1174 | 2.8 | 3.5 | 2.0 | 0.95 | 0.97 |
| 2 | Intact | HS | 928 | 651 | 616 | 5.7 | 5.9 | 6.1 | 0.95 | 0.93 |
| 2 | Intact | MS | 667 | 419 | 455 | 6.8 | 6.4 | 6.5 | 0.94 | 0.93 |
| 2 | Intact | TO | 515 | 421 | 522 | 5.1 | 5.5 | 5.5 | 0.99 | 0.94 |
|
| ||||||||||
| 1 | Fractured | HS | 821 | 528 | 580 | 4.7 | 5.1 | 4.4 | 0.94 | 0.97 |
| 2 | Fractured | HS | 627 | 426 | 250 | 11.3 | 9.7 | 11.3 | 0.96 | 0.88 |
| 2 | Fractured | MS | 652 | 421 | 274 | 7.1 | 6.0 | 6.7 | 0.91 | 0.90 |
| 2 | Fractured | TO | 587 | 496 | 330 | 6.9 | 6.4 | 7.7 | 0.9 5 | 0.88 |
Contact stress values computed using specimen-specific cartilage DEA models of a malreduced posterior wall acetabular fracture were also highly correlated with Tekscan-measured values (correlations greater than 0.91 – Table 1). Peak contact stress values computed were also within an average of 11% (range: 9%-15%) of the Tekscan-measured values. DEA-computed contact areas were within 30% (range: 16% - 36%) of physical measurements for the malreduced fractures.
Point-by-point absolute difference maps show visually that cartilage-specific DEA predictions had similar contact stress distributions as the Tekscan measurements (Figure 5). Areas of high contact stress in the DEA models appeared to be in similar locations as high contract stresses measured during physical testing. In the malreduced fracture state, both specimens exhibited bimodal contact anterior and posterior to the fragment. The fracture fragment in Specimen #1 was uniformly recessed 2 mm and did not contact the femoral head at heel strike. The fracture fragment for Specimen #2 had a better reduction near the acetabular rim, and thus the fragment did experience load at all instances of gait investigated in this work.
Figure 5.

Contact stress distributions at heel strike for the intact and fractured states of both specimens obtained from DEA models generated with specimen-specific cartilage thickness. The leftmost column shows the acetabular cartilage in light gray and the Tekscan sensor surface in dark gray with the mapped contact stresses shown as indicated on the colorbar. Dark gray indicates that the Tekscan sensor registered no contact at that location under load. In the center column, the light gray shows all acetabular cartilage in the DEA models with a black line denoting the edge of the Tekscan sensor which is not shown. The rightmost column shows difference maps which are the absolute value of the Tekscan maps minus the DEA maps. Contact stress values above 8 MPa are represented in black, with a maximum contact stress value of 11.3 MPa. The presence of a fracture disrupts the peripheral contact distribution of the intact joints and appears to shift stresses anterosuperiorly and medially within the acetabulum.
CT-Projected Cartilage Models
DEA models of intact hips with cartilage surfaces that were projected from CT scans and smoothed using our algorithm were also able to accurately approximate physical measurements of contact stress and area. DEA-computed contact stress values were highly correlated with Tekscan-measured values for intact hips (correlations greater than 0.93 in all phases of the gait cycle – Table 1). Peak contact stress in the projected cartilage models was within an average of 12% (range: 4% - 29%) of the Tekscan measurements for the intact hips, and contact areas were within an average of 12% (range: 4% - 29%).
DEA-computed contact stress values for the malreduced posterior wall acetabular fractures also highly correlated with Tekscan-measured values (correlations greater than 0.88 in all phases of the gait cycle – Table 1). As for the specimen-specific cartilage models, peak contact stress computed with projected cartilage DEA models of malreduced posterior wall acetabular fractures had excellent agreement (average within 6%; range: 0%-12%) with the Tekscan-measured contact forces. Contact areas were within 48% (range: 29% - 60%) for the malreduced fractures.
Point-by-point absolute difference maps of the projected cartilage DEA contact stress maps (Figure 6) show agreement between DEA-generated and Tekscan measured contact stress that is very similar (though not identical) to the good agreement found using specimen-specific cartilage models. Areas of high contact stress on the acetabular cartilage appeared in similar locations on the projected-cartilage DEA models and the Tekscan sensor. Models of both malreduced fracture specimens exhibited similar contact stress and loading patterns as those seen with the cartilage-specific models and the Tekscan measurements.
Figure 6.

Contact stress distributions at heel strike for the intact and fractured states of both specimens obtained using DEA models generated by projecting cartilage from CT scans. The leftmost column shows the acetabular cartilage in light gray and the Tekscan sensor surface in dark gray with the mapped contact stresses shown as indicated on the colorbar. Dark gray indicates that the Tekscan sensor registered no contact at that location under load. In the center column, the light gray shows all acetabular cartilage in the DEA models with a black line denoting the edge of the Tekscan sensor which is not shown. The rightmost column shows difference maps which are the absolute value of the Tekscan maps minus the DEA maps. Contact stress values above 8 MPa are represented in black, with a maximum contact stress value of 11.3 MPa. The presence of a fracture disrupts the peripheral contact distribution of the intact joints and appeared to shift stresses posteromedially within the acetabulum.
Discussion
The goal of this work was to validate the use of a DEA methodology for estimating contact stress in the context of acetabular fractures. We demonstrated that with the use of specimen-specific cartilage thickness information, there was excellent agreement in terms of peak contact stress, contact area, and spatial correlation between DEA-computed and Tekscan-measured contact stress. Unfortunately, specimen-specific cartilage data is likely to remain unavailable when dealing with acetabular fractures patients, and implementation of DEA for obtaining contact stress in fractured joints will continue to rely on cartilage surface models extrapolated from clinical CT data. This work demonstrated that with an appropriate smoothing algorithm applied to a cartilage surface extrapolated from bony geometry, the resulting DEA contact stress estimations had excellent agreement with physically measured intra-articular contact stress values (r ≥ 0.93 for intact state, r ≥ 0.88 for fractured state).
While this work was to the best of our knowledge the first to use a Tekscan sensor to explore contact stress in the hip after an acetabular fracture, a variety of comparative information about joint contact stress in intact hips and in hips with acetabular fractures is available from studies using pressure-sensitive film. The average contact area across all DEA models in our work was 6.3 cm2 in intact hips and 4.1 cm2 in fractured hips, values similar to the range of contact areas that have been measured for intact hips (range: 4.3 cm2 – 6.8 cm2) and fractured hips (range: 2.9 cm2 – 5.3 cm2) using pressure-sensitive film (Hak et al, 1998; Konrath et al, 1998b; Olson et al, 1995; Olson et al, 1996). Peak contact stress values measured in this work ranged from 2.0 MPa – 6.5 MPa for intact hips and 4.4 MPa – 11.3 MPa for fractured hips. These peak stress values were on the lower end of the range reported for experiments using pressure-sensitive film (5.62 – 10.54 MPa for intact; 6.31- 20.5 MPa for fractured) (Hak et al, 1998; Konrath et al, 1998b; Olson et al, 1995). This is likely in part due to the higher spatial resolution of pressure-sensitive film compared to the Tekscan sensor permitting measurement of highly localized higher peak pressures and the fact that our loading experiments used approximately half of the applied load of those previous studies.
Despite the excellent agreement between the DEA-computed and the experimentally measured contact stresses in a variety of hip positions, this work has several limitations. Neither the DEA model nor the cadaveric testing included an acetabular labrum. Omitting a labrum was determined acceptable for this work because while the labrum affects intra-articular fluid pressure and joint lubrication (Ferguson et al., 2003; Song et al., 2012), cadaveric and computational studies have indicated that absence of an intact acetabular labrum minimally affect hip stability or intra-articular contact stress in normal hips (Crawford et al., 2007; Henak et al., 2011; Konrath et al., 1998a; Myers et al., 2011). Furthermore, the labrum is likely to be disrupted in a fractured hip.
The 1 mm projected cartilage thickness was thinner than the MRI-measured cartilage thickness in our specimens, and on the very low end of literature values reported for acetabular or femoral head cartilage thickness (Adam et al., 1998; Athanasiou et al., 1994; Shepherd and Seedhom, 1999). This thickness was selected because it resulted in DEA contact patch locations being most consistent with the physically measured contact. Thicker cartilage projections seemed to prevent the femoral head from seating in the acetabulum, and the DEA computed contact stress pattern appeared as rim loading (Figure 7) that did not correspond to the measured spatial pattern of contact stress (Figure 6). Peak contact stress and contact area were most sensitive to changes in cartilage modulus with a 1 mm cartilage projection, yet even then, key measures of contact stress were minimally affected by variation in cartilage Young's modulus (Figure 7). This greater effect of geometry than material properties on stress is similar to findings in other orthopaedic soft tissues (Hansen et al., 2017).
Figure 7.
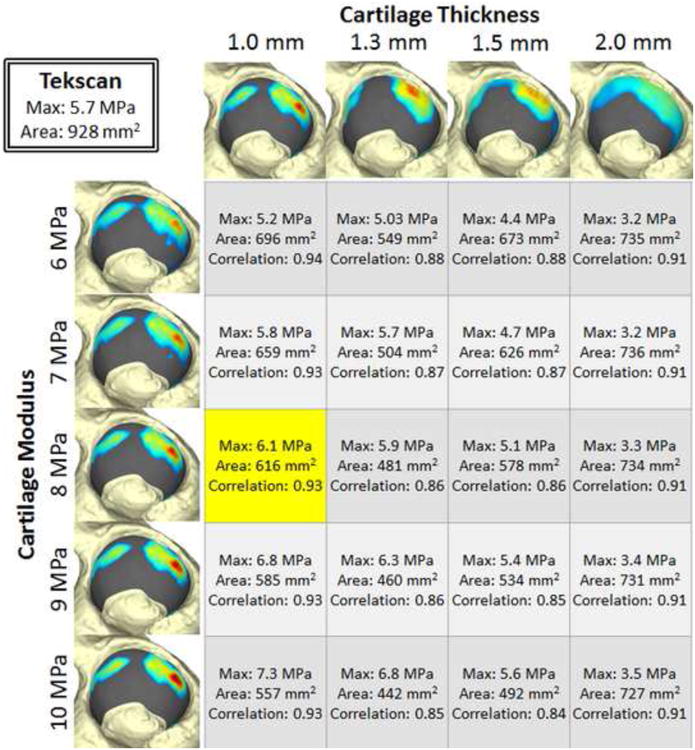
Sensitivity of computed contact stresses on projected cartilage thickness and cartilage modulus values. All models are of Specimen 2 at heel strike, with the Tekscan measured data shown in the box on the upper left. Contact stress maps on the left are from models with 1 mm cartilage projections and variable Young's Modulus for cartilage. Contact stress maps along the top are for variable thickness cartilage projections and a constant 8 MPa Young's modulus. The data shown in yellow result from the modeling parameters that were validated.
While the loading conditions used in this work were similar to loads seen in vivo, some of the loading characteristics and model assumptions limit generalization to a wider clinical population. While we did vary the position of the hip to simulate multiple instances of the stance phase of gait, we did not vary the applied load (1000 N). Furthermore, hip positions used in this work were based upon the average of the instrumented hip data acquired by Bergmann, et al. (Bergmann et al., 2001; Bergmann et al., 1999), and thus were representative of hip orientation in elderly individuals rather than those typically suffering acetabular fractures. Thus, joint contact data determined in this work should be considered representative examples of contact patterns that may develop in a fractured acetabulum rather than a complete description of contact stress occurring in the acetabulum after a posterior wall fracture.
We elected to report the agreement between DEA and contact stress measurements in positions simulating gait, however we also tested Specimen 1 in several arbitrary abduction poses not representative of gait and found similar agreement between DEA and physically measured contact stresses. Peak contact stress at 11° of abduction was 6.84 MPa and 6.80 MPa for the DEA and Tekscan, respectively. At 5° abduction, DEA predicted a maximum contact stress of 4.88 MPa compared to Tekscan measurement of 4.66 MPa. At 4° adduction, DEA predicted a maximum contact stress of 5.53 MPa and Tekscan measured 5.27 MPa. Testing was performed in the ab/adducted poses only with an intact acetabulum due to concerns about stability of the experimental setup with the fracture fragment location relative to the acetabular loading pattern in these poses.
The use of DEA to assess contact stress in the hip has previously been validated (Abraham et al., 2013) using comparisons to FE models and to pressure-sensitive film measurements of contact stress in cadavers (Anderson et al., 2007; Henak et al., 2014b). That work emphasized the non-spherical nature of the femoral head and encouraged the use of specimen-specific cartilage thickness to obtain realistic results (Abraham et al., 2013). However, in cases of intra-articular fractures, specimen-specific cartilage thickness is unavailable. In this work, we have shown that our DEA methodology is valid for cases of an incongruent fractured acetabulum, and further, if a suitable smoothing algorithm is applied, a cartilage surface projected from underlying subchondral bone will yield valid contact stress information. This allows for implementation of DEA in cases of intra-articular hip fractures in which standard clinical CT imaging is the standard of care, thereby facilitating large, patient-specific population studies of contact stress in studies of acetabular fractures.
Acknowledgments
This work was funded by NIH grant AR055533. The NIH had no role in study design or in the collection, analysis, interpretation, or presentation of the data. The authors would like to thank Mr. Thomas Baer for his assistance with photography and Mr. Kevin Dibbern for his assistance with data visualization.
Footnotes
Conflict of Interest: No author has a conflict of interest with this work resulting from commercial relationships.
Publisher's Disclaimer: This is a PDF file of an unedited manuscript that has been accepted for publication. As a service to our customers we are providing this early version of the manuscript. The manuscript will undergo copyediting, typesetting, and review of the resulting proof before it is published in its final citable form. Please note that during the production process errors may be discovered which could affect the content, and all legal disclaimers that apply to the journal pertain.
References
- Abraham CL, Bangerter NK, McGavin LS, Peters CL, Drew AJ, Hanrahan CJ, Anderson AE. Accuracy of 3D dual echo steady state (DESS) MR arthrography to quantify acetabular cartilage thickness. J Magn Reson Imaging. 2015;42:1329–1338. doi: 10.1002/jmri.24902. [DOI] [PMC free article] [PubMed] [Google Scholar]
- Abraham CL, Maas SA, Weiss JA, Ellis BJ, Peters CL, Anderson AE. A new discrete element analysis method for predicting hip joint contact stresses. Journal of biomechanics. 2013;46:1121–1127. doi: 10.1016/j.jbiomech.2013.01.012. [DOI] [PMC free article] [PubMed] [Google Scholar]
- Adam C, Eckstein F, Milz S, Putz R. The distribution of cartilage thickness within the joints of the lower limb of elderly individuals. Journal of anatomy. 1998;193(Pt 2):203–214. doi: 10.1046/j.1469-7580.1998.19320203.x. [DOI] [PMC free article] [PubMed] [Google Scholar]
- Anderson AE, Ellis BJ, Maas SA, Weiss JA. Effects of idealized joint geometry on finite element predictions of cartilage contact stresses in the hip. Journal of biomechanics. 2010a;43:1351–1357. doi: 10.1016/j.jbiomech.2010.01.010. [DOI] [PMC free article] [PubMed] [Google Scholar]
- Anderson DD, Goldsworthy JK, Li W, James Rudert M, Tochigi Y, Brown TD. Physical validation of a patient-specific contact finite element model of the ankle. Journal of biomechanics. 2007;40:1662–1669. doi: 10.1016/j.jbiomech.2007.01.024. [DOI] [PMC free article] [PubMed] [Google Scholar]
- Anderson DD, Iyer KS, Segal NA, Lynch JA, Brown TD. Implementation of discrete element analysis for subject-specific, population-wide investigations of habitual contact stress exposure. Journal of applied biomechanics. 2010b;26:215–223. doi: 10.1123/jab.26.2.215. [DOI] [PMC free article] [PubMed] [Google Scholar]
- Anderson DD, Van Hofwegen C, Marsh JL, Brown TD. Is elevated contact stress predictive of post-traumatic osteoarthritis for imprecisely reduced tibial plafond fractures? Journal of orthopaedic research : official publication of the Orthopaedic Research Society. 2011;29:33–39. doi: 10.1002/jor.21202. [DOI] [PMC free article] [PubMed] [Google Scholar]
- Anderson IA, MacDiarmid AA, Lance Harris M, Mark Gillies R, Phelps R, Walsh WR. A novel method for measuring medial compartment pressures within the knee joint in-vivo. Journal of biomechanics. 2003;36:1391–1395. doi: 10.1016/s0021-9290(03)00158-1. [DOI] [PubMed] [Google Scholar]
- Athanasiou KA, Agarwal A, Dzida FJ. Comparative study of the intrinsic mechanical properties of the human acetabular and femoral head cartilage. Journal of orthopaedic research : official publication of the Orthopaedic Research Society. 1994;12:340–349. doi: 10.1002/jor.1100120306. [DOI] [PubMed] [Google Scholar]
- Bergmann G, Deuretzbacher G, Heller M, Graichen F, Rohlmann A, Strauss J, Duda GN. Hip contact forces and gait patterns from routine activities. Journal of biomechanics. 2001;34:859–871. doi: 10.1016/s0021-9290(01)00040-9. [DOI] [PubMed] [Google Scholar]
- Bergmann G, Graichen F, Rohlmann A, Deuretzbacher G, Morlock M, Heller M, Duda GN. GAIT98 version June99 The hip joint: Contact forces, gait data and load cycles. Feie Universitat, Berlin, Germany, CD-ROM; 1999. [Google Scholar]
- Bhandari M, Matta J, Ferguson T, Matthys G. Predictors of clinical and radiological outcome in patients with fractures of the acetabulum and concomitant posterior dislocation of the hip. The Journal of bone and joint surgery. British volume. 2006;88:1618–1624. doi: 10.1302/0301-620X.88B12.17309. [DOI] [PubMed] [Google Scholar]
- Borrelli J, Jr, Goldfarb C, Ricci W, Wagner JM, Engsberg JR. Functional outcome after isolated acetabular fractures. Journal of orthopaedic trauma. 2002;16:73–81. doi: 10.1097/00005131-200202000-00001. [DOI] [PubMed] [Google Scholar]
- Chao EY, Volokh KY, Yoshida H, Shiba N, Ide T. Discrete element analysis in musculoskeletal biomechanics. Mol Cell Biomech. 2010;7:175–192. [PubMed] [Google Scholar]
- Crawford MJ, Dy CJ, Alexander JW, Thompson M, Schroder SJ, Vega CE, Patel RV, Miller AR, McCarthy JC, Lowe WR, Noble PC. The 2007 Frank Stinchfield Award. The biomechanics of the hip labrum and the stability of the hip. Clin Orthop Relat Res. 2007;465:16–22. doi: 10.1097/BLO.0b013e31815b181f. [DOI] [PubMed] [Google Scholar]
- Dirschl DR, Marsh JL, Buckwalter JA, Gelberman R, Olson SA, Brown TD, Llinias A. Articular fractures. The Journal of the American Academy of Orthopaedic Surgeons. 2004;12:416–423. doi: 10.5435/00124635-200411000-00006. [DOI] [PubMed] [Google Scholar]
- Ebraheim NA, Patil V, Liu J, Sanford CG, Jr, Haman SP. Reconstruction of comminuted posterior wall fractures using the buttress technique: a review of 32 fractures. Int Orthop. 2007;31:671–675. doi: 10.1007/s00264-006-0246-0. [DOI] [PMC free article] [PubMed] [Google Scholar]
- Ferguson SJ, Bryant JT, Ganz R, Ito K. An in vitro investigation of the acetabular labral seal in hip joint mechanics. Journal of biomechanics. 2003;36:171–178. doi: 10.1016/s0021-9290(02)00365-2. [DOI] [PubMed] [Google Scholar]
- Genda E, Iwasaki N, Li G, MacWilliams BA, Barrance PJ, Chao EY. Normal hip joint contact pressure distribution in single-leg standing--effect of gender and anatomic parameters. Journal of biomechanics. 2001;34:895–905. doi: 10.1016/s0021-9290(01)00041-0. [DOI] [PubMed] [Google Scholar]
- Hadley NA, Brown TD, Weinstein SL. The effects of contact pressure elevations and aseptic necrosis on the long-term outcome of congenital hip dislocation. Journal of orthopaedic research : official publication of the Orthopaedic Research Society. 1990;8:504–513. doi: 10.1002/jor.1100080406. [DOI] [PubMed] [Google Scholar]
- Hak DJ, Hamel AJ, Bay BK, Sharkey NA, Olson SA. Consequences of transverse acetabular fracture malreduction on load transmission across the hip joint. Journal of orthopaedic trauma. 1998;12:90–100. doi: 10.1097/00005131-199802000-00005. [DOI] [PubMed] [Google Scholar]
- Hansen W, Shim VB, Obst S, Lloyd DG, Newsham-West R, Barrett RS. Achilles tendon stress is more sensitive to subject-specific geometry than subject-specific material properties: A finite element analysis. Journal of biomechanics. 2017;56:26–31. doi: 10.1016/j.jbiomech.2017.02.031. [DOI] [PubMed] [Google Scholar]
- Harris MD, Anderson AE, Henak CR, Ellis BJ, Peters CL, Weiss JA. Finite element prediction of cartilage contact stresses in normal human hips. Journal of orthopaedic research : official publication of the Orthopaedic Research Society. 2012;30:1133–1139. doi: 10.1002/jor.22040. [DOI] [PMC free article] [PubMed] [Google Scholar]
- Henak CR, Abraham CL, Anderson AE, Maas SA, Ellis BJ, Peters CL, Weiss JA. Patient-specific analysis of cartilage and labrum mechanics in human hips with acetabular dysplasia. Osteoarthritis Cartilage. 2014a;22:210–217. doi: 10.1016/j.joca.2013.11.003. [DOI] [PMC free article] [PubMed] [Google Scholar]
- Henak CR, Ellis BJ, Harris MD, Anderson AE, Peters CL, Weiss JA. Role of the acetabular labrum in load support across the hip joint. Journal of biomechanics. 2011;44:2201–2206. doi: 10.1016/j.jbiomech.2011.06.011. [DOI] [PMC free article] [PubMed] [Google Scholar]
- Henak CR, Kapron AL, Anderson AE, Ellis BJ, Maas SA, Weiss JA. Specimen-specific predictions of contact stress under physiological loading in the human hip: validation and sensitivity studies. Biomechanics and modeling in mechanobiology. 2014b;13:387–400. doi: 10.1007/s10237-013-0504-1. [DOI] [PMC free article] [PubMed] [Google Scholar]
- Hodge WA, Carlson KL, Fijan RS, Burgess RG, Riley PO, Harris WH, Mann RW. Contact pressures from an instrumented hip endoprosthesis. J Bone Joint Surg Am. 1989;71:1378–1386. [PubMed] [Google Scholar]
- Hodge WA, Fijan RS, Carlson KL, Burgess RG, Harris WH, Mann RW. Contact pressures in the human hip joint measured in vivo. Proc Natl Acad Sci U S A. 1986;83:2879–2883. doi: 10.1073/pnas.83.9.2879. [DOI] [PMC free article] [PubMed] [Google Scholar]
- Kern AM, Anderson DD. Expedited patient-specific assessment of contact stress exposure in the ankle joint following definitive articular fracture reduction. Journal of biomechanics. 2015;48:3427–3432. doi: 10.1016/j.jbiomech.2015.05.030. [DOI] [PMC free article] [PubMed] [Google Scholar]
- Konrath GA, Hamel AJ, Olson SA, Bay B, Sharkey NA. The role of the acetabular labrum and the transverse acetabular ligament in load transmission in the hip. J Bone Joint Surg Am. 1998a;80:1781–1788. doi: 10.2106/00004623-199812000-00008. [DOI] [PubMed] [Google Scholar]
- Konrath GA, Hamel AJ, Sharkey NA, Bay BK, Olson SA. Biomechanical consequences of anterior column fracture of the acetabulum. Journal of orthopaedic trauma. 1998b;12:547–552. doi: 10.1097/00005131-199811000-00003. [DOI] [PubMed] [Google Scholar]
- Li W, Anderson DD, Goldsworthy JK, Marsh JL, Brown TD. Patient-specific finite element analysis of chronic contact stress exposure after intraarticular fracture of the tibial plafond. Journal of orthopaedic research : official publication of the Orthopaedic Research Society. 2008;26:1039–1045. doi: 10.1002/jor.20642. [DOI] [PMC free article] [PubMed] [Google Scholar]
- Malkani AL, Voor MJ, Rennirt G, Helfet D, Pedersen D, Brown T. Increased peak contact stress after incongruent reduction of transverse acetabular fractures: a cadaveric model. The Journal of trauma. 2001;51:704–709. doi: 10.1097/00005373-200110000-00013. [DOI] [PubMed] [Google Scholar]
- Martin CT, Heiner AD, Baer TE, Pugely AJ, Noiseux NO. Protrusio After Medial Acetabular Wall Breach in Total Hip Arthroplasty. The Iowa orthopaedic journal. 2015;35:99–107. [PMC free article] [PubMed] [Google Scholar]
- Matta JM. Fractures of the acetabulum: accuracy of reduction and clinical results in patients managed operatively within three weeks after the injury. J Bone Joint Surg Am. 1996;78:1632–1645. [PubMed] [Google Scholar]
- Matta JM, Mehne DK, Roffi R. Fractures of the acetabulum. Early results of a prospective study. Clin Orthop Relat Res. 1986:241–250. [PubMed] [Google Scholar]
- Maxian TA, Brown TD, Weinstein SL. Chronic stress tolerance levels for human articular cartilage: two nonuniform contact models applied to long-term follow-up of CDH. Journal of biomechanics. 1995;28:159–166. doi: 10.1016/0021-9290(94)00054-8. [DOI] [PubMed] [Google Scholar]
- Moed BR, Carr SE, Gruson KI, Watson JT, Craig JG. Computed tomographic assessment of fractures of the posterior wall of the acetabulum after operative treatment. J Bone Joint Surg Am. 2003;85-a:512–522. doi: 10.2106/00004623-200303000-00018. [DOI] [PubMed] [Google Scholar]
- Myers CA, Register BC, Lertwanich P, Ejnisman L, Pennington WW, Giphart JE, LaPrade RF, Philippon MJ. Role of the acetabular labrum and the iliofemoral ligament in hip stability: an in vitro biplane fluoroscopy study. Am J Sports Med. 2011;39 Suppl:85S–91S. doi: 10.1177/0363546511412161. [DOI] [PubMed] [Google Scholar]
- Olson SA, Bay BK, Chapman MW, Sharkey NA. Biomechanical consequences of fracture and repair of the posterior wall of the acetabulum. J Bone Joint Surg Am. 1995;77:1184–1192. doi: 10.2106/00004623-199508000-00007. [DOI] [PubMed] [Google Scholar]
- Olson SA, Bay BK, Pollak AN, Sharkey NA, Lee T. The effect of variable size posterior wall acetabular fractures on contact characteristics of the hip joint. Journal of orthopaedic trauma. 1996;10:395–402. doi: 10.1097/00005131-199608000-00006. [DOI] [PubMed] [Google Scholar]
- Rhyu KH, Kim YH, Park WM, Kim K, Cho TJ, Choi IH. Application of finite element analysis in pre-operative planning for deformity correction of abnormal hip joints--a case series. Proc Inst Mech Eng H. 2011;225:929–936. doi: 10.1177/0954411911407247. [DOI] [PubMed] [Google Scholar]
- Rudert MJ, Ellis BJ, Henak CR, Stroud NJ, Pederson DR, Weiss JA, Brown TD. A new sensor for measurement of dynamic contact stress in the hip. Journal of biomechanical engineering. 2014;136:035001. doi: 10.1115/1.4026103. [DOI] [PMC free article] [PubMed] [Google Scholar]
- Saterbak AM, Marsh JL, Nepola JV, Brandser EA, Turbett T. Clinical failure after posterior wall acetabular fractures: the influence of initial fracture patterns. Journal of orthopaedic trauma. 2000;14:230–237. doi: 10.1097/00005131-200005000-00002. [DOI] [PubMed] [Google Scholar]
- Segal NA, Anderson DD, Iyer KS, Baker J, Torner JC, Lynch JA, Felson DT, Lewis CE, Brown TD. Baseline articular contact stress levels predict incident symptomatic knee osteoarthritis development in the MOST cohort. Journal of orthopaedic research : official publication of the Orthopaedic Research Society. 2009;27:1562–1568. doi: 10.1002/jor.20936. [DOI] [PMC free article] [PubMed] [Google Scholar]
- Segal NA, Kern AM, Anderson DD, Niu J, Lynch J, Guermazi A, Torner JC, Brown TD, Nevitt M. Elevated tibiofemoral articular contact stress predicts risk for bone marrow lesions and cartilage damage at 30 months. Osteoarthritis Cartilage. 2012;20:1120–1126. doi: 10.1016/j.joca.2012.05.013. [DOI] [PMC free article] [PubMed] [Google Scholar]
- Shepherd DE, Seedhom BB. Thickness of human articular cartilage in joints of the lower limb. Annals of the rheumatic diseases. 1999;58:27–34. doi: 10.1136/ard.58.1.27. [DOI] [PMC free article] [PubMed] [Google Scholar]
- Shivanna K. Automating Patient-Specific Diarthrodial Joint Contact Model Development. University of Iowa; 2006. [Google Scholar]
- Song Y, Ito H, Kourtis L, Safran MR, Carter DR, Giori NJ. Articular cartilage friction increases in hip joints after the removal of acetabular labrum. Journal of biomechanics. 2012;45:524–530. doi: 10.1016/j.jbiomech.2011.11.044. [DOI] [PubMed] [Google Scholar]
- Volokh KY, Chao EY, Armand M. On foundations of discrete element analysis of contact in diarthrodial joints. Mol Cell Biomech. 2007;4:67–73. [PMC free article] [PubMed] [Google Scholar]
- Yoshida H, Faust A, Wilckens J, Kitagawa M, Fetto J, Chao EY. Three-dimensional dynamic hip contact area and pressure distribution during activities of daily living. Journal of biomechanics. 2006;39:1996–2004. doi: 10.1016/j.jbiomech.2005.06.026. [DOI] [PubMed] [Google Scholar]