Abstract
Conventional multiple track location shear wave elasticity imaging (MTL-SWEI) is a powerful tool for noninvasively estimating tissue elasticity. The resolution and noise levels of MTL-SWEI systems, however, are limited by ultrasound speckle. Single track location SWEI (STL-SWEI) is a novel variant which fixes the position of the tracking beam and modulates the push location to effectively cancel out the effects of speckle-induced bias. We present here a three-dimensional STL-SWEI system which provides full suppression of lateral and elevation speckle bias for high resolution volumetric elasticity imaging, and requires no spatial smoothing to make accurate measurements of shear wave speed. We demonstrate and analyze the system’s performance in homogeneous and layered elasticity phantoms.
I. Introduction
Estimating the elastic properties of tissue using ultrasound shear wave techniques has been an area of increasing interest to the clinical and research communities over the past two decades. The ability to non-invasively map the mechanical properties of internal organs holds great promise for disease detection, staging, and real-time procedure guidance. Broadly, shear wave techniques fall into two categories - those designed to quantitatively estimate an organ’s regional elasticity [1]–[5], and those designed to make images of the local elasticity [6]–[8]. Both estimate the velocity from a series of images of the wave propagating through some region, but the relationship of noise and resolution in these two scenarios is vastly different. In the quantification scenario, the engineer strives to use as large a region as possible to average out the effects of noise and obtain a stable estimate. In the imaging scenario, the propagation must be estimated on a local level, often over just a few pixels, whereby resolution and noise suppression form a distinct sensitivity-specificity trade-off. If the estimates are too localized, noise will dominate and targets become indistinguishable. However, if the estimates are too smoothed out, small targets become lost in the blurring. It is on this second scenario that we focus our attention, and in particular its application in three-dimensional imaging. For as three dimensional ultrasound imaging becomes more widely available, interest is growing in three-dimensional elasticity imaging as well [9]–[14]. Such imaging may be of value for detecting and characterizing lesions or spatial variations of elasticity in organs such as liver or breast. We propose a method for making accurate and high resolution volumetric shear wave images, extending the technique called Single-Track-Location Shear Wave Elasticity Imaging (STL-SWEI) into three dimensions.
II. Methods
A. Single-Track-Location Shear Wave Elasticity Imaging (STL-SWEI)
Shear Wave Elasticity Imaging (SWEI) uses long, focused ultrasound pulses to deliver momentum through acoustic radiation force to focal regions in the tissue. Each focused pulse creates a body force which generates focal displacements on the order of microns in magnitude. Those displacements evolve into transversely-propagating shear waves that travel away from the focal region. The shape and position of the focal region of each “pushing” pulse are determined by the transmit beamforming and the absorption of the tissue. For long depths of field, the shape is often approximated as a cylinder radiating outward in the lateral-elevation directions. Conventional SWEI, hereby denoted as multiple-track-location SWEI (MTL-SWEI) uses a series of offset “track” beams to rapidly image the tissue motion corresponding to the traveling shear wave. The process of constructive and destructive interference of ultrasound signals from many randomly distributed scatters in tissue, which gives rise to the stationary speckle texture in B-Mode images, also affects shear wave tracking. Just as the specific amplitude of an IQ ultrasound sample is determined by both a stationary random component and the local strength of the scatterers within the corresponding resolution cell, the spatial sensitivity pattern of a given ultrasound sample has a randomized peak or peaks within the corresponding resolution cell [15]. Such an unknown spatial sensitivity pattern has increasingly deleterious consequences on the accuracy of shear wave speed estimation as the region over which the speed is to be estimated gets smaller and the utilized beams more closely spaced. Furthermore, repeat interrogations do nothing to reduce speckle-induced bias, as the unknown offset in effective position of each beam relative to its targeted location is fixed. Speckle-induced bias, therefore, limits the resolution of MTL-SWEI systems [16], [17] requiring beam separation or linear regression over multiple speckles to make reliable estimates of shear wave speed.
Single track location shear wave elasticity imaging (STL-SWEI) images are formed similarly to MTL-SWEI images, except that instead of the basic unit being a single push and many track beams, the shear waves are tracked with a single beam, and the location of the push beam is changed after each recording. In this way, a synthetic shear wave is constructed from the map of the displacements and push beam positions. An MTL-SWEI image can be acquired from a single excitation using parallel or plane wave beamforming, although in practice multiple excitations are used to improve averaging or field of view. STL-SWEI images require many excitations, so take longer to acquire, but also benefit from parallel beamforming because an STL-SWEI image can be created independently from each track beam. Because the position of push beams are unaffected by speckle, their geometry is better known than the effective shape of each track beam, and as a result, the distances between beams are known with much greater precision than in MTL-SWEI. Therefore, STL-SWEI is able to suppress speckle noise and enables elasticity imaging systems with significantly higher resolution than their MTL-SWEI counterparts [18]–[22].
B. Three-Dimensional STL-SWEI
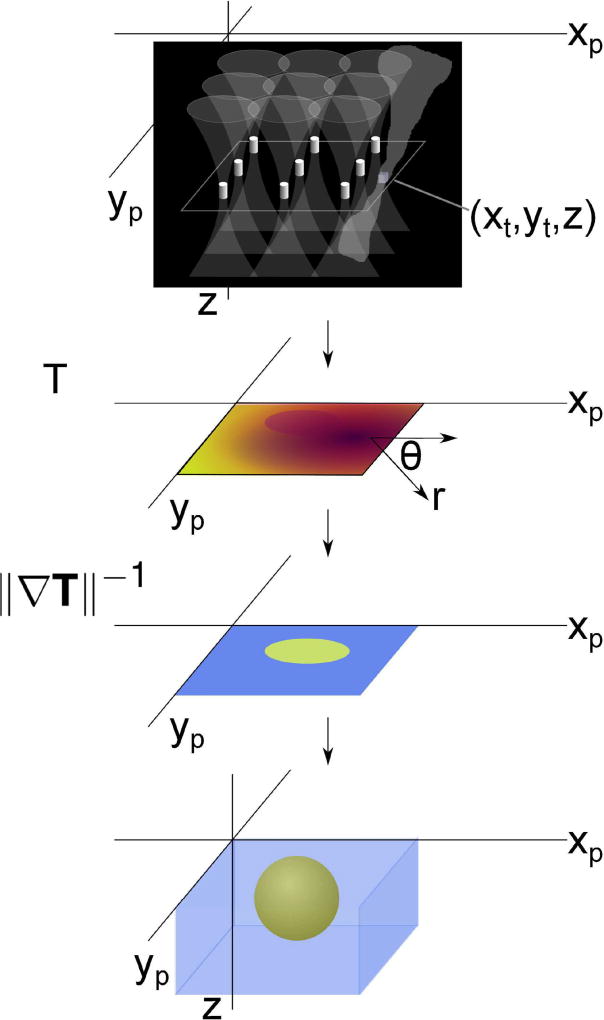
To extend STL-SWEI to three-dimensions, one needs only to be able to adjust the position of the pushing beam independent of one or more tracking beams. A diagram of 3D STL-SWEI algorithm is shown in figure 1. The track beam is held fixed and sequentially records the motion generated by each push beam on the grid. Note how the tracking beam is not aligned with the push beams - any voxel in the tracking field of view will reconstruct the plane formed by the push locations at its depth, regardless of orientation (of course, some component of the induced displacement must be detected at that voxel, so a perpendicular tracking beam is not likely to work without lateral tracking). Once the grid of pushes has been successively excited and recorded, each tracking voxel (in the case of parallel beamforming) in the plane of pushes may be processed separately. When indexed by push location, a C-scan synthetic shear wave is created at each voxel, with the shear wave “radiating” out from the tracking voxel’s position. The displacements may then be temporally or spatially filtered, including across the different push locations, in an equivalent manner to how MTL-SWEI data are filtered in tracking space and time. In this work, a characteristic arrival time is computed for each sample, and the inverse of the gradient magnitude with respect to push location ║(∇xpT,∇ypT)║−1 provides the estimate of the shear wave velocity.
Fig. 1.
Diagram of the STL-SWEI processing sequence in three dimensions (right). A set of pushes are sequentially delivered to positions (xp,yp), tracking the response at one or more locations (xt,yt). A characteristic time of flight Txp,yp is found between each push location and the single track location. The shear wave speed estimate is the inverse of the local gradient of arrival times ∥∇xp,ypT∥−1. A volume is made by combining the slices from multiple depths.
C. Experimental Setup
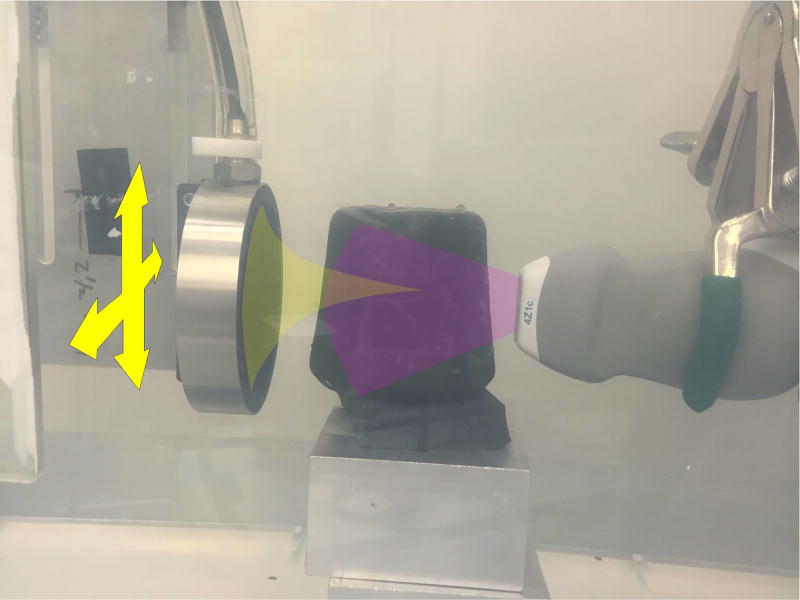
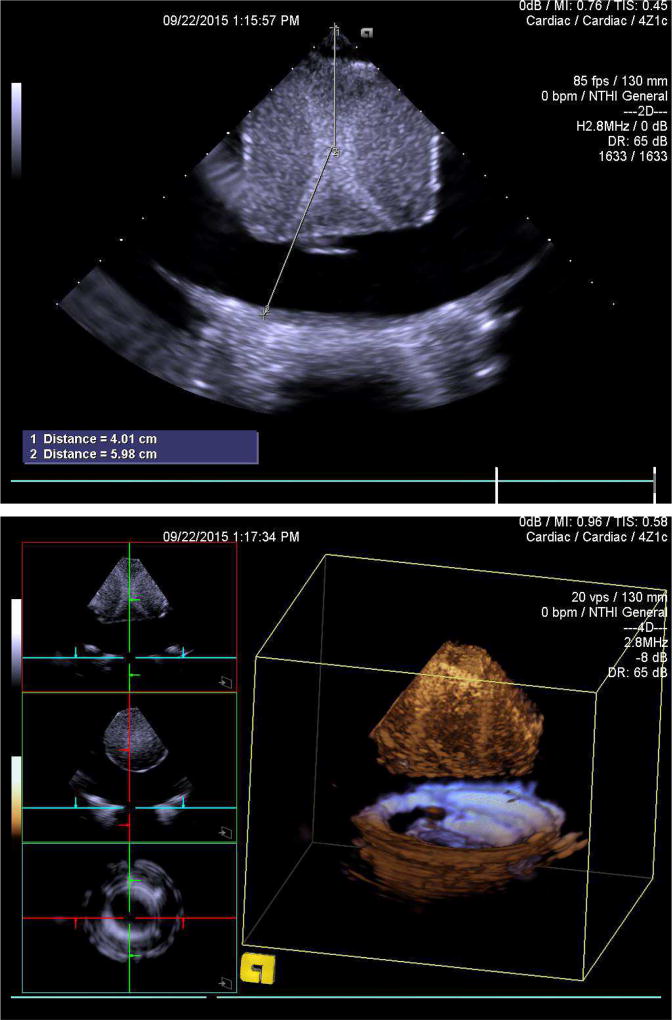
We mounted a concave 1.1 MHz HIFU piston ((H-101, Sonic Concepts, Bothell, WA) to a translation stage, pointing sideways at the target phantom, and positioned a Siemens 4z1c matrix array ultrasound transducer opposite the target, looking back through at the sample (figure 2). The 4z1c has an array of 36 × 48 sub-apertures, each consisting of a 3 × 3 element block that is beamformed in hardware. Each sub-aperture is 0.4 mm × 0.4 mm, with a frequency bandwidth of 1–4 MHz. The HIFU piston has a fixed focal depth of 6 cm and an F-number of 1. The piston was aligned with the center of the phantom using the 4z1c’s 2 and 3D B-mode on the Siemens SC2000 ultrasound scanner (Siemens Medical Systems, Is-saquah, Wa) (figure 3). The HIFU piston was driven with a function generator (Agilent 33522B, Agilent Technologies, Santa Clara, CA) through a matching network and RF power amplifier (E&I A150, Electronics & Innovation, Rochester, NY). The line-sync output of the SC2000 was connected to the external trigger input of the waveform generator used to drive the HIFU piston. For each position of the HIFU piston, a series of 96 sequential 2.5 MHz ultrasound volumes were captured by the matrix array, each comprising an 128 × 8 × 8 sample volume, with 128-sample A-lines steered between −8° and 8° in both the θ and ϕ directions using parallel receive beamforming. A diverging wave transmit allowed all 64 beams to be simultaneously acquired for each transmit, providing a tracking volume rate of 6,250 vps. Upon detecting the first track transmit of each ensemble, the function generator waited 0.56 ms and then sent a 200 Vpp, 300-cycle, 1.1 MHz pulse to the HIFU piston, timed to be simultaneous with 5th volume in the tracking sequence. This process collected a coarsely-sampled 3D MTL-SWEI dataset for each push position. To enable STL-SWEI processing, this process was repeated many times, holding the tracking transducer fixed, while using the translation stage to move the HIFU position sequentially over the grid of push locations.
Fig. 2.
Experimental Setup. The concave HIFU piston is moved with a translation stage to steer the push beam, while the 4Z1C matrix array transducer is fixed on the opposite side of the sample. Each A-line in the tracked volume will be used to independently reconstruct the 3D STL-SWEI volume.
Fig. 3.
2-D (top) and 3-D (bottom) B-Mode images from the SC2000. The HIFU piston is visible, distal to the phantom.
D. Homogenous Phantom Acquisition
For the first scan, a homogeneous gelatin phantom with graphite scatterers was used. The focal depth of the HIFU piston was positioned in the middle of the phantom, at a depth of 40 mm in the tracking volume (F/2). The HIFU piston was scanned in the lateral-elevation plane in 0.5 mm increments over a field of view of 2.5 × 2.5 cm. A total of 2601 tracking ensembles were saved for this acquisition, with a scan time of three hours.
E. Layered Phantom Acquisition
To create a layered target, two homogeneous gelatin phantoms (the phantom from the first experiment and another, stiffer phantom) were stacked on top of one another in the water tank, with the boundary positioned near the center of the scan. The layer was positioned at approximately x = −5 mm. The HIFU piston was moved with the same 0.5 mm spacing in the xp and yp dimensions, with a 2.1 cm × 2.1 cm field of view, for 1461 acquisitions with a scan time of just under two hours.
F. Image Formation and Post-Processing
Loupas’s algorithm [23] was used with a 1.5 mm (5λ) kernel to estimate axial displacement relative to an anchored reference frame prior to excitation. Displacements were negated for visual purposes, because the opposing geometry of the HIFU piston and matrix array meant that the induced displacements were towards the 4z1c, which would result in a negative-amplitude shear wave. The displacements were band-pass filtered through tracking time (“slow time”) at each voxel with a 3rd order Butterworth filter with cutoff frequencies of 50 and 1000 Hz.
1) Directional Filtering
Frequency domain directional filtering is described in the literature [12], [24], [25]. For this application, instead of applying the filter in the lateral-time plane, we adapt it to apply in the radial-time plane, which requires transforming the data into cylindrical coordinates with reference to the track beam location. The location of the track beam in each STL-SWEI displacement movie was manually specified as the central point from which the shear wave emanates, forming a rough grid. For certain track locations, the primary location of the track beam was not at the main lobe of the track beam, but at a grating lobe. These grating lobes arose from the sub-array beamforming that occurs in the handle of the 4z1c - sets of physical elements are pre-steered on receive down the central line of the parallel receive set, which in this case was straight in front of the transducer. The subarray-summed IQ data were then beamformed to the parallel receive locations, resulting in grating lobes for aggressively-steered beams, as observed in the results. To improve estimates and reduce reflection artifacts, the data at each track beam were transformed into cylindrical coordinates about each track beam location using bilinear interpolation, so that the radial direction aligned with the STL shear wave propagation. The displacements were fed through a directional filter [12], [24] for each track location (STL-SWEI), removing components traveling in the δr/δt < 0 direction to remove reflection artifacts. The filtered data were then transformed back to the original Cartesian grid.
2) Arrival Time and Velocity Estimation
Prior to estimation of arrival times, the data were masked to remove displacements for which r/t was greater than 5 or less than 0.5 m/s to exclude artifactual reverberations outside of the expected range. The arrival time of the shear wave at each location was found from the peak of the displacement signal at each voxel, using quadratic subsample estimation. The gradient of arrival times was found in the xp and yp dimensions and the shear wave speed was estimated as:
| (1) |
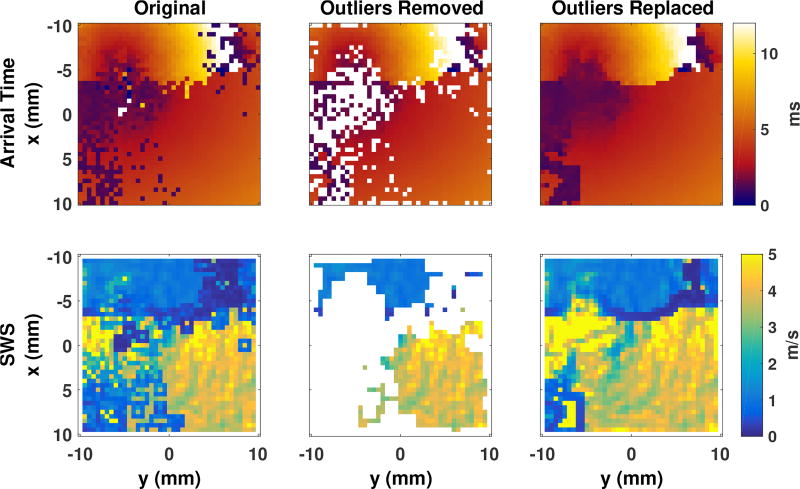
Because the gradient uses a 3 × 3 neighborhood, outliers in arrival time create a “halo” artifact in the shear wave speed image, affecting neighboring gradients but not their own. To clean up outlier arrival times at each depth, a median-filtered version of the slice was created using a 3 × 3 pixel kernel. Each original pixel was compared to its median-filtered neighbors in the xp and yp directions. If the difference between the pixel value and the median of its filtered neighbors was greater than the standard deviation of the filtered neighbors, the pixel was replaced by the median-filtered value, otherwise it was left alone. The scheme and effect of this outlier rejection is illustrated in figure 13 in the results.
Fig. 13.
“Halo” artifacts and outlier rejection. The top row shows arrival times, while the bottom row shows corresponding reconstructed shear wave speed maps. Arrival times identified as outliers are selectively replaced by the median of their neighbors, leaving the inlier arrival times unaffected.
This experimental setup could be described as “3D × 2D“, as we use three dimensional volumes for tracking the data, and scan the the HIFU piston (with a finite depth of field) over a 2-D grid. The use of 64 parallel tracking beams on a grid is superfluous for the generation of a 3D STL-SWEI image, as each voxel in the tracking volume is used to generate the C-scan of the 3D STL-SWEI volume at that depth independently of all other tracking voxels. The position of each voxel in the reconstructed volume is therefore dictated by a combination of push-beam and track-beam positions: the axial position is determined by the tracking depth, while the lateral and elevational positions are determined entirely by the push locations - the azimuthal and elevational position of the track beam aren’t even used! Indeed, a single focused ultrasound piston could be used as the tracking element in combination with a steerable pushing element or array for a “1D × 2D“ volumetric scan that would still be full 3D STL-SWEI. However, there is substantial benefit to be gained from the parallel receive beams, as each track beam acts as an independent STL shear wave “source” positioned at the track beam’s location, allowing for combinational averaging to suppress noise and fill in gaps in the reconstruction, much in the same way as multiple push locations are used to build up shear wave images [26].
III. Results
A. Synthesized STL Shear Waves
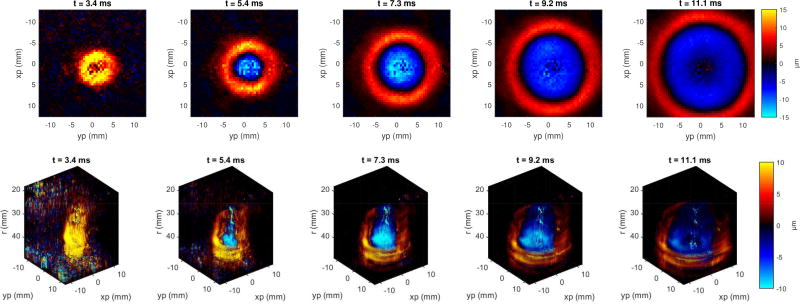
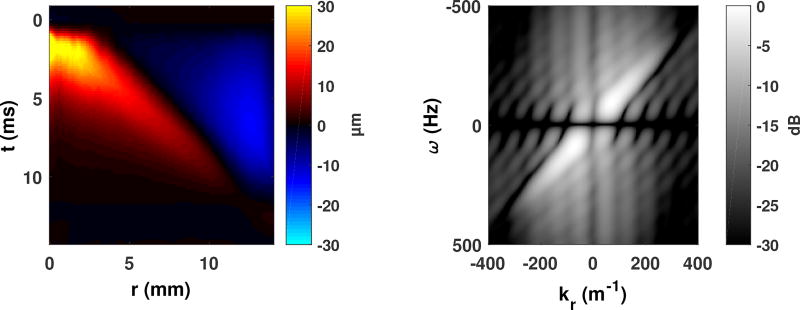
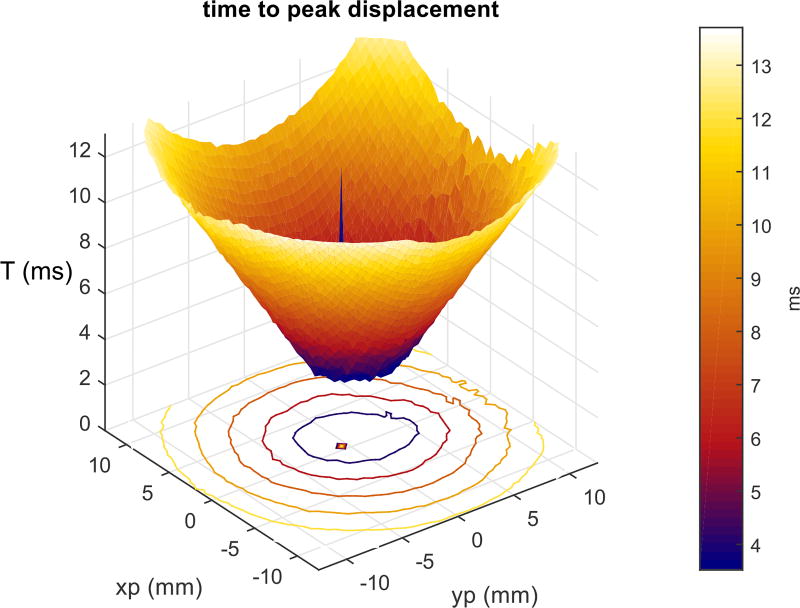
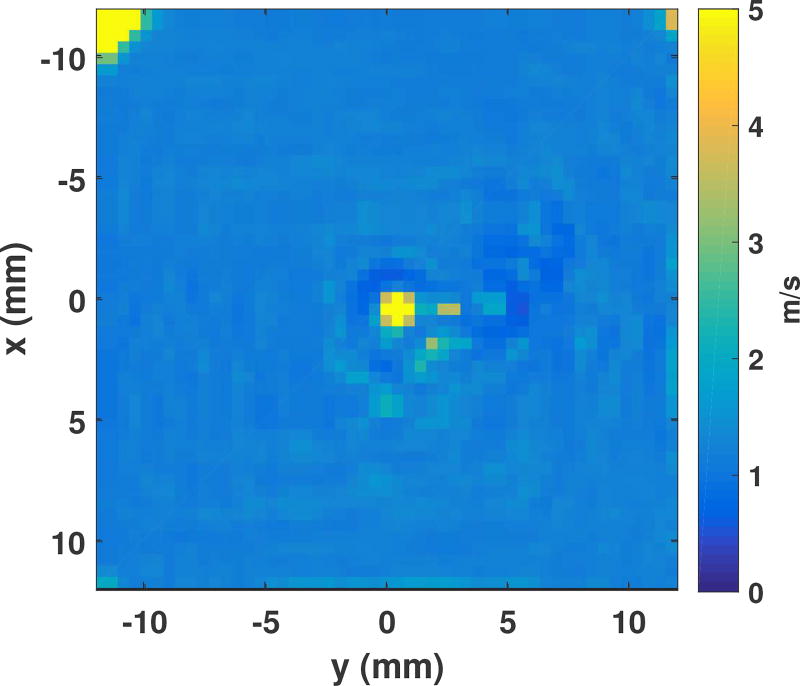
Figure 4 shows five frames from the synthetic shear wave movie generated from a single tracking voxel at 4 cm depth in the upper strip, steered in front of the 4z1c. The induced shear wave has an initial magnitude of 15 microns, but the peak displacement cannot be measured because of reverberations from the ARFI transmission. The track voxel was positioned such that the synthetic shear wave radiates out from near the center of the grid, and “propagation” of the shear wave in the xp and yp dimensions is clear and smooth. The volume renders in the lower film strip pane help visualize the geometry of the push. The shape of the wavefront varies through depth per the effective shape of the track beam, but the propagation across push locations is smooth. Both movies are available online at http://ieeexplore.ieee.org. Figure 5 shows the trajectory of the shear wave displacements, and the Fourier transform of the velocities. The spatial wavelength of the shear wave is about 4 mm (3 wavelengths), and it has frequency content between 50 and 300 Hz. Figure 6 shows the STL-SWEI arrival times in a c-scan computed at a depth of 40 mm as a surface, with projected contours. The shape of the cone is uniform, even with no spatial filtering. Only a few pixels in the middle, where the push and track beams align, show artifactual arrival times, but these regions are not typically used for shear wave speed estimation. Figure 7 shows shear wave speed map created from the arrival times in figure 6. The shear wave speed has been computed as the inverse of the magnitude of the gradient of the arrival times. At the corners of the image, the ensemble did not track long enough to capture the passing wave, and near (xp = xt, yp = yt), approximately (0, 0), the push and track locations are aligned, so there is no propagating shear wave in that region, rendering those pixels invalid.
Fig. 4.
C-Scan frames (top) and volumes (bottom) from the 3D STL-SWEI movie, using the tracking voxel in the center of the tracking field of view at 4 cm. The shear wave is visible propagating in the xp and yp directions, with very clear and uniform geometry. The movies are available as a multimedia supplement at http://ieeexplore.ieee.org.
Fig. 5.
Shear wave trajectory and velocity frequency content for the shear wave in figure 4, averaged through angles. The shear wave has a center frequency of 160 Hz and a wavelength of approximately 4 mm.
Fig. 6.
STL-SWEI arrival times in C-scan from the center tracking beam voxel. The slope of the cone is inversely proportional to the shear wave speed. No filtering has been applied to the arrival times, and the cone maintains a uniform appearance.
Fig. 7.
STL-SWEI shear wave speed C-scan from the center tracking beam voxel, at the focal depth. The shear wave speed is reconstructed without any spatial smoothing from in the inverse of the slope of the arrival times in figure 6:
B. Homogeneous Phantom
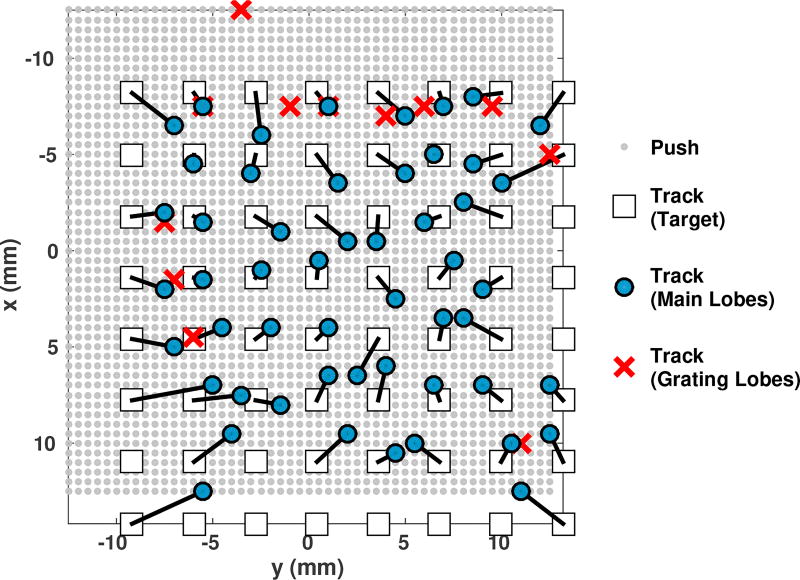
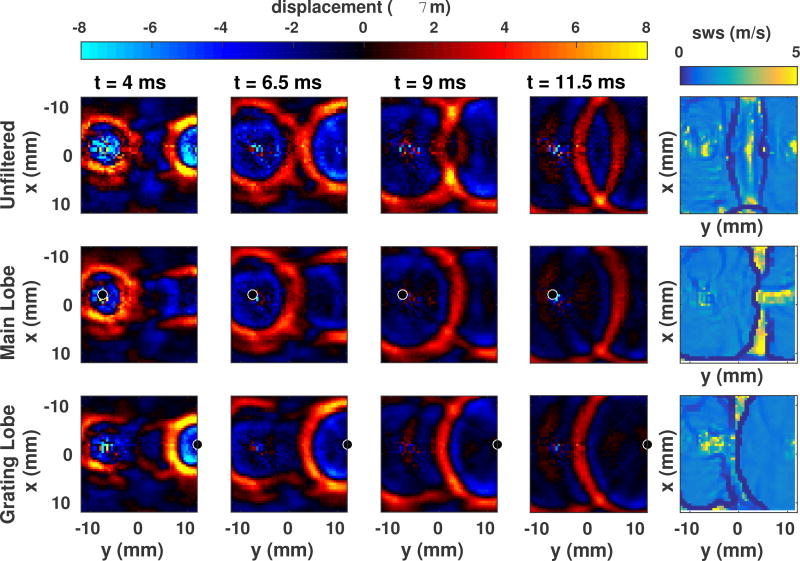
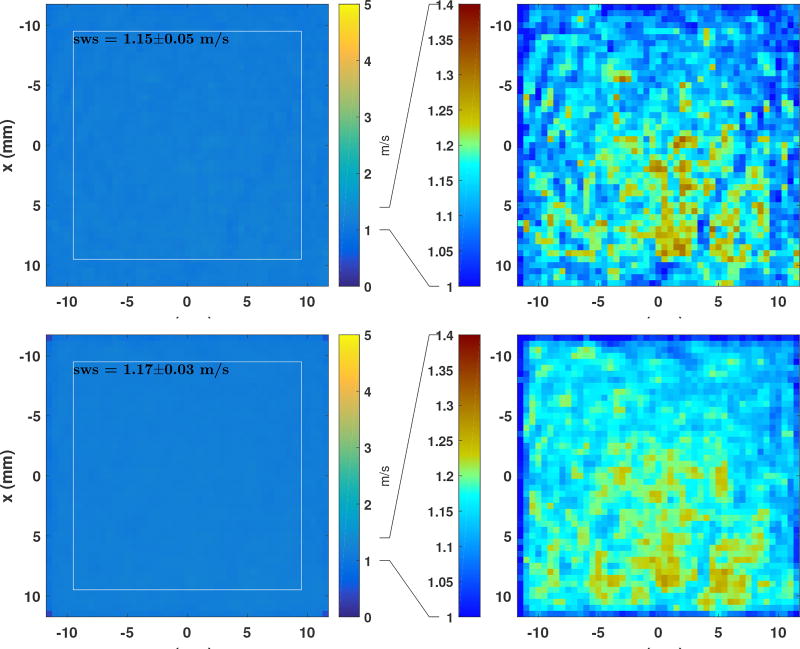
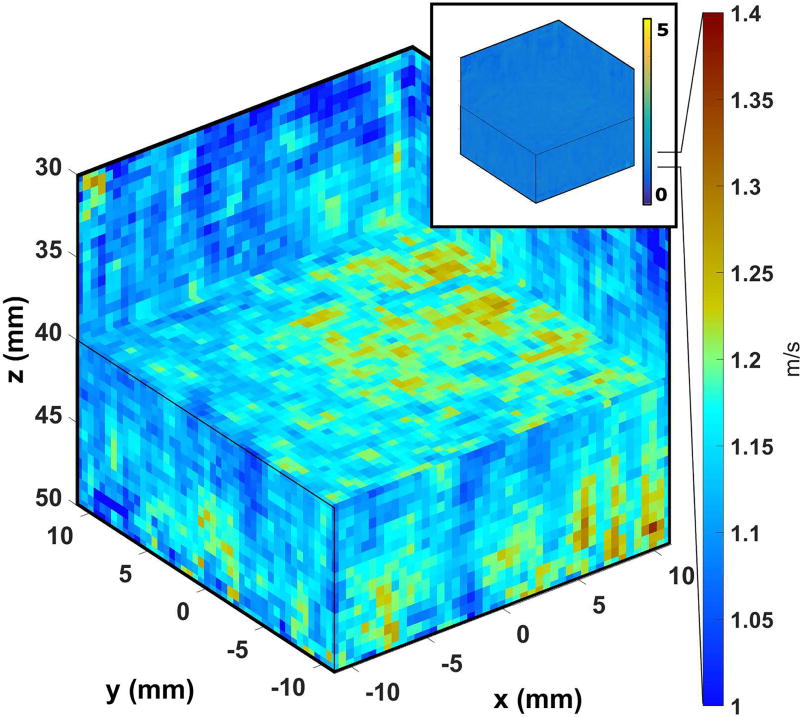
Figure 8 shows the shear wave speed maps for each of the 64 tracking voxels at 4 cm depth. No directional filters have been applied, so the interfering shear waves tracked with grating lobes create artifacts in some of the images, particularly those with aggressive receive beam steering. Estimated wave speeds are also invalid around the location of each of the track voxels (where tracking positions and shear wave sources overlap), and at distances greater than 15 mm from the wave source, as the tracking time was not long enough to capture the peak. Figure 9 shows the predicted and actual locations of the push and track beams. Because the transducers were only aligned by hand, the push and track grids are not aligned, though each was regularly spaced. Speckle bias in beamforming moves each track position around its expected location, with an overall trend of the beams being dragged towards the center of the push grid by 1 to 5 mm, consistent with the angular sensitivity of a forward-steered plane wave. Track positions whose “primary” STL shear wave originated from a grating lobe have been marked as red “x”s. Figure 10 shows an example of a synthetic shear wave “originating” from a grating lobe and how the grating lobe wave appears to propagate similarly to the mainlobe waves. By using a cylindrical-coordinate directional filter, the wave centered on either the main or grating lobe can be isolated, and followed for the full duration of the ensemble (14 ms, or approximately 15 mm in this case). Figure 11 shows the median shear wave speed across all of the voxels for the uniform phantom. The top row is without directional filtering, and the bottom row is with directional filtering. The right set of images have reduced dynamic ranges and different colormaps to highlight the suppression of variability with directional filtering. Figure 12 shows the rendered volume of the shear wave speed, cut through the focal depth (z = 40 mm). The inset image shows the [0,5] m/s color scale, which is almost completely uniform. The volume extends axially over the depth of field, and in the lateral and elevation dimensions by the span of the push beams.
Fig. 8.
Estimated shear wave speed maps for each of the 64 tracking voxels at 4 cm depth. Steered voxels show corruption from grating lobes formed from sub-array beamforming in the transducer handle, manifesting as multiple shear wave “sources”.
Fig. 9.
Predicted and estimated beam positions, at a depth of 4 cm. Each gray dot represents a push beam position. Each track beam is represented by a white square for the location specified by the transmit-receive delays, while the teal circle is the estimated (biased) position, based on the origin of the corresponding STL shear wave. For some track positions, the primary STL shear wave originated from a grating lobe of the tracking beam, and those locations have been marked as red “x”s
Fig. 10.
Example of intentionally filtering for a grating lobe shear wave. By positioning the directional filter on the grating lobe, we can suppress the mainlobe shear wave and preferentially detect the grating lobe wave, which provides a similarly accurate map.
Fig. 11.
Median shear wave speed map across all 64 voxels at the focal depth. The top row shows the results without directional filtering, and the bottom row shows the results with directional filtering. While the left-hand images show no qualitative differences, the right-hand images show versions with a dramatically reduced dynamic range, colored to highlight the variation about the mean (sws = 1.2 m/s).
Fig. 12.
Rendered volume of shear wave speeds for the homogeneous phantom. The color axis has been reduced to visualize the shear wave speed variations. The volume with the original color scale is displayed in the inset, showing very little variation. An animated version of this volume can be found at http://ieeexplore.ieee.org.
C. Boundary Phantom
Figure 13 shows the outlier-rejection method applied to an example track location dataset from the boundary phantom. The outliers are removed in the center column and replaced with median-filtered values in the right column. The shear wave velocity map is unaffected away from the outliers, and the “halo” artifacts around the outliers are removed.
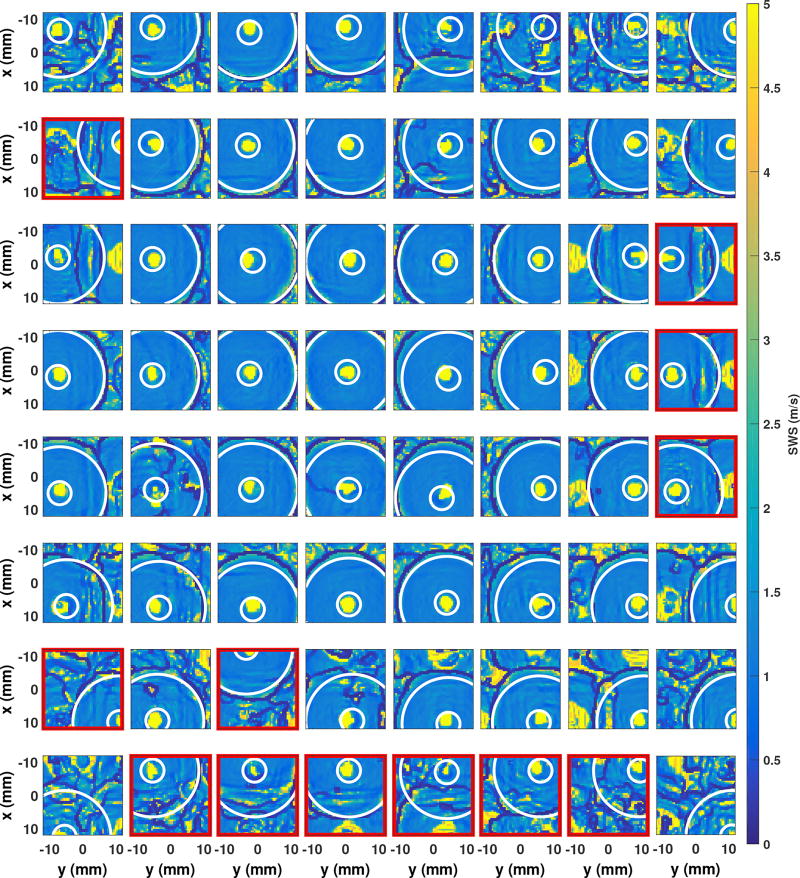
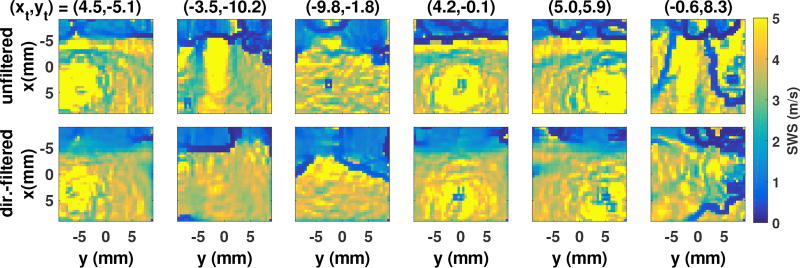
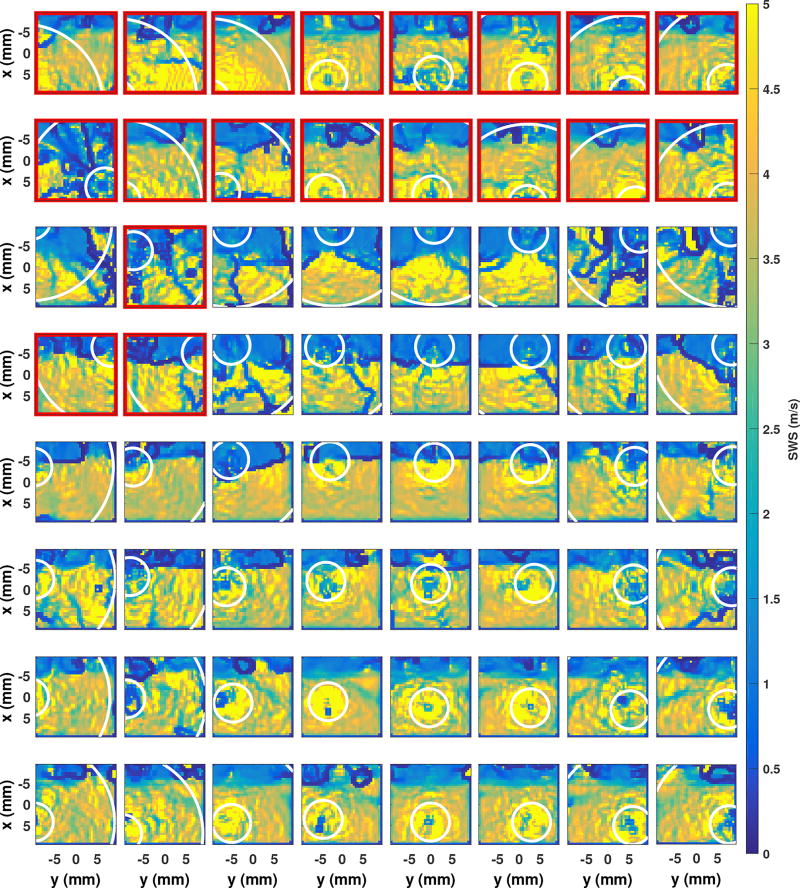
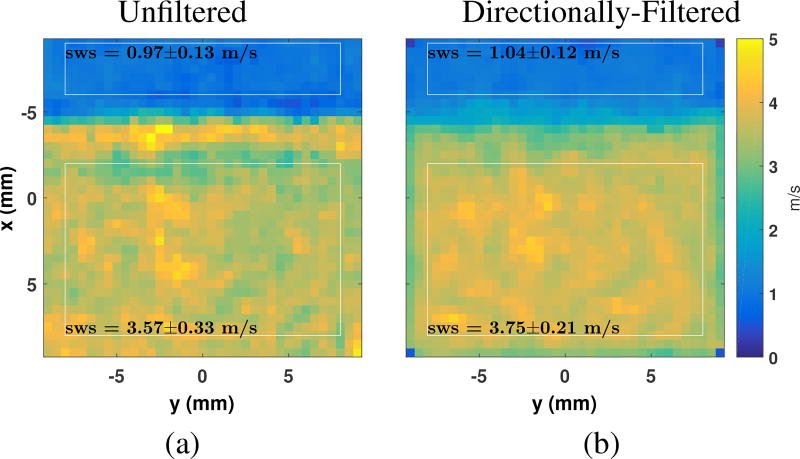
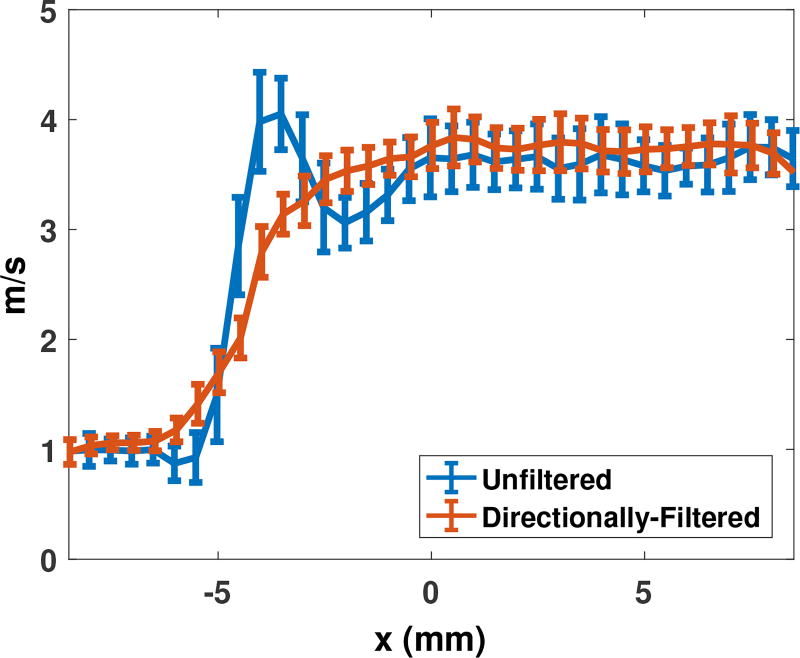
Figure 14 shows 6 of the 64 C-scans of the reconstructed layer volume, corresponding to 6 representative tracking beam locations. The top row shows the raw shear wave speed maps, without radial directional filtering, and the bottom row shows the same maps, but computed after the directional filtering was applied to the displacements. For some of the tracking locations, the directional filter provides substantial improvement, while for others, artifacts remain. Figure 15 shows the shear wave speed maps created from each of the 64 tracked voxels at the focal depth. Faint white circles indicates the radial distances from each “source” track position for which the values are included in the average. Track locations that deviate from the expected grid (19/64) indicate the presence of grating lobes in those tracking beams, and have been outlined in red. Many of the grating lobes yield consistent maps of shear wave speed. Figure 16 shows the slice of the shear wave speed volume at the focal depth. The mean and standard deviation of each region are labeled. The standard deviation of each region is less than 0.2 m/s. Some blurring is apparent across the boundary. Figure 17 shows plots of the shear wave speed at the focal depth, with errorbars showing the mean and standard deviation across yp. The unfiltered data show ringing artifacts on the boundary, while the directionally-filtered reconstructions show some smoothing of the boundary.
Fig. 14.
Shear wave speed maps for six different tracking voxels, demonstrating the impact of radial directional filtering on the shear wave speed maps. The filter removes artifacts created by reflections off of the boundary and interference between shear waves created by main and grating lobes in the track beams. Some distortion of the boundaries passes though the filter.
Fig. 15.
Shear wave speed maps for each tracking voxel. Radial directional filtering has been applied to suppress artifacts from reflections and grating lobes. Sub-plots where primary “source” tracking position came from a grating lobe are outlined in red.
Fig. 16.
(a) Unfiltered and (b) Directionally-filtered median shear wave speed map across all 64 voxels at 4 cm depth in the boundary phantom. The contributions of each tracking voxel were limited to push-track separation distances between 4 and 19 mm. The boundary is clearly visible at x = −5 mm, with reflection artifacts enhancing boundary contrast in (a).
Fig. 17.
Resolution of the boundary, with and without directional filtering, at the focal depths. Errorbars show mean and standard deviation across y. Without directional filtering, ringing of the shear wave speed value is seen around the boundary, leading to the boundary “enhancement” visible in figure 16.
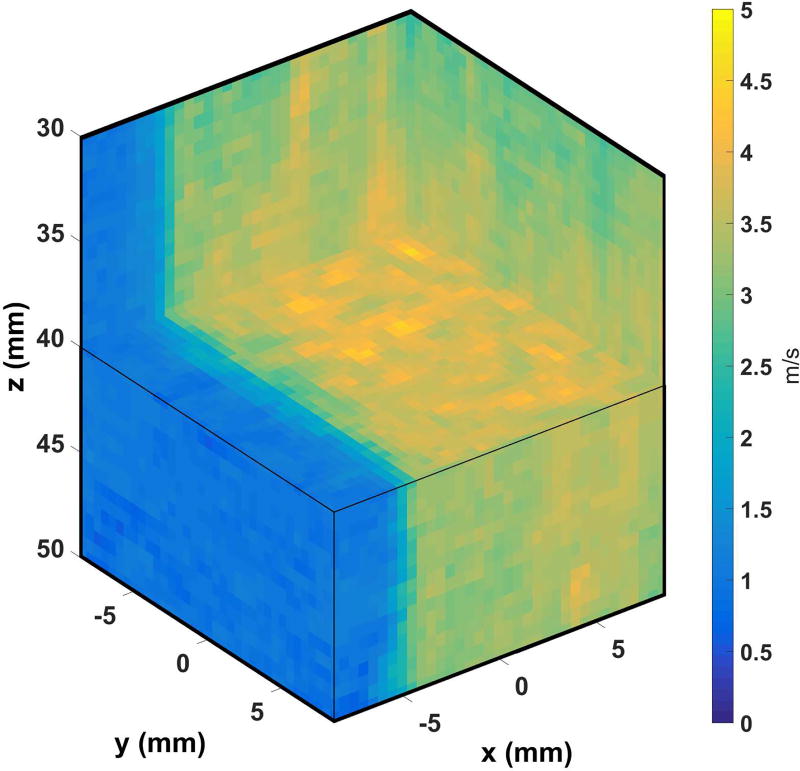
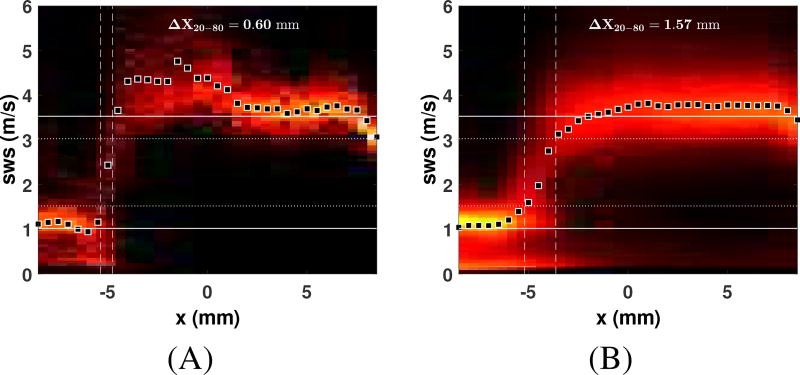
Figure 18 shows the rendered volume of the shear wave speed, cut through the focal depth (z = 40 mm). The boundary at x = −5 mm is sharply defined and readily apparent. The volume extends axially over the depth of field, and in the lateral and elevation dimensions by the span of the push beams. Figure 19 shows the histogram of shear wave speeds computed at each lateral position, computed over a depth of 35–45 mm. Panel A shows the histograms for a single track beam, showing a sharp transition between each side of the layer. Panel B shows the histogram over all of the track beams with interpolated 20–80% rise widths- while the overall shape is similar, the 20–80% width of boundary has increased from 0.60 mm (approximately one push beam step) for a single track beam to 1.57 mm from the median across multiple tracks.
Fig. 18.
Rendered volume of shear wave speeds for a layered phantom with a boundary at x = −5 mm. A sharp edge is visible between the two layers across all slices. An animated version of this volume can be found at http://ieeexplore.ieee.org
Fig. 19.
(A) Heat-map histogram of shear wave speed at each lateral position for a single track beam (θ = 1.13°, ϕ = 1.13°). The boundary at x = −5 mm is apparent with high resolution, having a 20–80% rise spacing of just 0.60 mm. (B) Heat-map histogram of shear wave speed, averaged over all track beams. The resolution of the boundary is degraded, showing a width of 1.57 mm.
IV. Discussion
A. Speckle Elimination and High Resolution Imaging
The proposed method, 3D STL-SWEI, has excellent potential for generating quantitative elasticity volumes at very high lateral and elevational spatial resolutions. The ultrasound resolution of the tracking beams at the focal depth (F/2, 2.5 MHz), is only 1.2 mm, and the beamwidth of the ARFI beam is 1.4 mm (1.1 MHz, F/1), yet the edge resolution in 3D STL-SWEI is as small as 0.6 mm when the boundary is aligned with the imaging plane and no artifacts are present. Averaged over all tracking positions, the edge resolution is still 1.57 mm, which is only slightly larger than the tracking beamwidth, and substantially tighter than what would be expected from MTL-SWEI, which requires multiple speckles of averaging to overcome speckle bias. All of these numbers are expected to scale with frequency, so that when combined with high resolution imaging, 3D STL-SWEI should be able to visualize very small structures. The elimination of speckle noise from the images also creates a dramatic improvement in the smoothness of the arrival time maps over previous results with MTL-SWEI [10]. Speckle noise is still present, as the positions of the track beams form an irregular grid (figure 9), corresponding to the actual, biased positions of the track beams within the medium. However, the exact location of the track beams only sets the location of the STL shear wave “source”, after which the wave appears to propagate across the precisely-prescribed push locations very smoothly. MTL-SWEI arrival times, on the other hand, are typically smoothed, or fit to models over large spatial kernels to form viable estimates that utilize multiple speckles, but STL-SWEI requires no such inherent smoothing (of course, smoothing can still be applied in postprocessing to achieve a desired appearance). The use of directional filters does appear to apply a slight spatial smoothing to the data, as seen in figures 11,16 and 14, but this effect is small compared to the improvements in suppression of reflection artifacts. The resolution of the boundary is driven by a couple of effects, including the push and track beam focal size, any post-processing filtering, and averaging of incompletely-suppressed reflection artifacts. Notably, while the boundary appears somewhat sharper without directional filtering in figure 16(a), the “enhanced” boundary definition is revealed to be ringing in figure 17. The utility of allowing such reflection artifacts to enhance the contrast of targets in the target medium beyond their nominal values would depend on the application being one of detection rather than quantification.
B. Effect of multiple track beams
For well-beamformed track beams such as those in the center of the image, the maps are excellent in both the homogeneous and boundary phantoms- indeed for these voxels, the matrix nature of the tracking array is irrelevant - a focused piston could readily record a full shear wave speed map. The use of such a two-element 3D STL-SWEI system will be the focus of future work. However, the information gained from multiple tracking beams can be combined to both extend the field view and suppress noise, much in the same way that multiple push locations work for MTL-SWEI. In figure 19, we see that this averaging suppresses noise. However, it is also of interest that the boundary appears in slightly different locations in different tracking beams. We hypothesize that this is due to wave interactions with the boundary and the finite size of the push and track beams. For pushes located on the boundary, they generate shear waves in both media, and we expect that the arrival time will represent whichever side the track beam is primarily located on. For track beams located on the boundary, we expected sensitivity to waves on both sides with preferential tracking based on the amplitude of the waves and the (biased and stationary) sensitivity pattern of the tracking beam. The blurring of the boundary might then be assumed to be related to speckle bias, as tracking positions near the boundary would latch on to components from the edge of the generated shear waves because of their own sensitivity pattern, but in figure 19, this is not observed. A single tracking voxel image shows a very sharp boundary, so we might expect that when we looked at the histogram for all the tracking voxels, we would see a bimodal distribution about the two accurate values. However, the histogram smoothly transitions through intermediate velocities, indicating that the blurring isn’t coming strictly from a spatial offset. We suspect that reflection and refraction play a particularly large role, especially at oblique angles. For sharp angles, the amount of shear wave energy that refracts across the boundary to the tracking location is very small, which we believe results in the distortions shown in the third column of figure 14. In the top row of that image, we can see that the shear wave speed estimation breaks down near the boundary when path between the tracking and pushing locations approaches or crosses the boundary at an angle. Future work will use this system to examine reflection and refraction of shear waves off of angled boundaries, as 3D STL-SWEI may provide a valuable tool to effectively visualize these phenomena.
C. Grating Lobes
The effect of grating lobes on the steered tracking beams was remarkably pronounced. These lobes, formed by steering receive beams after the sub-array beamforming in the transducer handle, turn out to have both beneficial and deleterious effects. Because the track beam is effectively imaging more than a single position at the same time, it creates a plurality of synthetic wave sources. When these wave sources interfere with one another, they disrupt the gradient of the arrival times, as seen in some panels of figure 8 and figure 14. To some extent, incoming waves can be suppressed by the directional filter in cylindrical coordinates. Because we are using an arrival time estimator to create the shear wave speed maps, our algorithm simply picks up on whatever the strongest wave passing through the position is, so waves traveling at an angle to the filtering direction, though not completely opposed to it, may pass (at least in part) through the directional filter and interfere with the arrival time gradients. On the other hand, these extra STL shear wave “sources” extend the usable field of view by appearing as large-amplitude shear waves originating from remote locations. For the boundary phantom, this proves especially helpful when one lobe appears on either side of the layer, so that ballistic shear waves were observed in both media. In fact, the grating lobes can even be used to provide extra shear wave speed maps, if their positions are detected and directionally filtered, as shown in figure 10. When marking the positions of each track beam for filtering and masking, we opted for the lobe with the strongest shear wave signal, independent of whether this was a main or grating lobe. In many cases (12/64 for the homogeneous phantom and 19/64 for the boundary phantom), the grating lobe created the stronger signal. We note here, however, that while many of the grating lobe maps create viable shear wave speed maps, in many cases the the shear waves are weakly visualized by the grating lobe(s) or the interference of multiple STL shear waves is too much for our simple arrival time estimators and directional filters.
D. Practical Limitations
The system built here is impractical for in vivo imaging, as few targets would fit between the transducers and remain stationary for the duration of the scan (nearly three hours), but this is only a function of the limitations of currently available hardware. The ideal transducer would be a robust matrix array capable of reliably generating significant radiation force without damaging itself, and initial results by Gennison et. al indicate promise for using a matrix array to excite shear waves [12]. With such a transducer, the push beams could be steered electronically, and the whole acquisition could be done from a single transducer. This would dramatically reduce the acquisition time, though a 51 × 51 grid of sequential pushes would admittedly still take 40 seconds at 15 ms per ensemble, creating potential heat management challenges and requiring very stable placement of the probe to maintain speckle correlation over the acquisition duration. Acquisition time could be reduced with intentional multiple simultaneous pushes such as are used in Comb-Push Ultrasound Elastography [27], [28] and the use of directional filters. With a proper ARFI matrix array, an optimized grid, a reduced field of view, and/or simultaneous pushes, a 3D system viable for in vivo imaging could be realized and used for very high resolution elasticity imaging. Furthermore, using a narrowband HIFU transducer to excite our shear waves, the high energy, long pulses created a substantial amount of ring-down reverberation in the first millisecond of tracking. This is consistent with other ARFI studies, but creates an issue when we decide on the mask to use when averaging the images together. The region “around” the track beam is typically excluded, as the push and track beams overlap and no shear wave propagation can be observed. When the beginning of the tracking ensemble is obscured by reverberation, the excluded region must grow, as the shear wave will have propagated some distance before we can begin to monitor it. For stiffer materials, the region we must exclude grows in proportion to the shear wave speed. This is visible in figure 15, as the large, yellow artifactual regions extend much farther into the field of view than they do in figure 8. At the other end of tracking limitations, the duration of our tracking ensemble affected our ability to see the slowest-moving shear waves. Because the displacement-to-noise ratio was so high, we had no trouble visualizing the shear waves propagate over the entire field of view. However, because the soft material had a shear wave speed close to 1 m/s and our tracking ensemble only tracked for 14 ms after the push, our tracking ensembles ended with the slow-moving shear wave still in the field of view, especially for diagonally-traveling waves. Figure 8 shows this particularly well, as a circular pattern with radius 15 mm appears around each track location, beyond which the estimates become artifactual. Future implementations will need to track longer, and find ways of starting to track sooner, to maximize the usable field of view from each track beam
V. Conclusion
A 3D STL-SWEI system has been proposed and demonstrated in two phantoms. The resulting synthetic shear waves provide precise measurements of shear wave velocity with no inherent spatial smoothing required. The speckle-biased real positions of the tracking beams were extracted from the synthetic STL shear waves. The maps reconstructed for each track voxel are smooth, but some are corrupted by reflection or the presence of grating lobes. Directional filtering in cylindrical coordinates is used to suppress these artifacts to some degree, which eliminates the heightened boundary contrast in the layer phantom. Grating lobes are shown to generate distinguishable STL shear waves which can be tracked and directionally filtered to provide valid shear wave velocity maps. Combining redundant information from multiple, filtered track-location datasets, using the strongest of either the main or grating lobes, suppresses noise in the image without introducing significant blurring, resulting in a precise and smooth shear wave velocity map. The system presented here is suitable for research into very high resolution three dimensional elasticity imaging, which will be used guide the design of future matrix-array based shear wave imaging systems.
Supplementary Material
Acknowledgments
The authors would like to thank Siemens Medical Systems for technical support, the Duke Coulter Translational Research Partnership, and NIH grants R37HL096023 and R01EB012484.
Footnotes
Disclosure
The authors have intellectual property relating to this work.
References
- 1.Palmeri M, Wang M, Dahl J, Frinkley K, Nightingale K. Quantifying hepatic shear modulus in vivo using acoustic radiation force. Ultrasound Med Biol. 2008;34:546–558. doi: 10.1016/j.ultrasmedbio.2007.10.009. [DOI] [PMC free article] [PubMed] [Google Scholar]
- 2.Muller M, Gennisson J-L, Deffieux T, Tanter M, Fink M. Quantitative viscoelasticity mapping of human liver using supersonic shear imaging: Preliminary in vivo feasability study. Ultrasound in medicine & biology. 2009;35(2):219–229. doi: 10.1016/j.ultrasmedbio.2008.08.018. [DOI] [PubMed] [Google Scholar]
- 3.Amador C, Urban MW, Chen S, Greenleaf JF. Shearwave dispersion ultrasound vibrometry (sduv) on swine kidney. IEEE transactions on ultrasonics, ferroelectrics, and frequency control. 2011;58(12) doi: 10.1109/TUFFC.2011.2124. [DOI] [PMC free article] [PubMed] [Google Scholar]
- 4.Ferraioli G, Tinelli C, Dal Bello B, Zicchetti M, Filice G, Filice C. Accuracy of real-time shear wave elastography for assessing liver fibrosis in chronic hepatitis c: a pilot study. Hepatology. 2012;56(6):2125–2133. doi: 10.1002/hep.25936. [DOI] [PubMed] [Google Scholar]
- 5.Lee SY, Cardones AR, Doherty J, Nightingale K, Palmeri M. Preliminary results on the feasibility of using arfi/swei to assess cutaneous sclerotic diseases. Ultrasound in medicine & biology. 2015;41(11):2806–2819. doi: 10.1016/j.ultrasmedbio.2015.06.007. [DOI] [PMC free article] [PubMed] [Google Scholar]
- 6.Bercoff J, Pernot M, Tanter M, Fink M. Monitoring thermally-induced lesions with supersonic shear imaging. Ultrasonic imaging. 2004;26(2):71–84. doi: 10.1177/016173460402600201. [DOI] [PubMed] [Google Scholar]
- 7.Tanter M, Bercoff J, Athanasiou A, Deffieux T, Gennisson J-L, Montaldo G, Muller M, Tardivon A, Fink M. Quantitative assessment of breast lesion viscoelasticity: initial clinical results using supersonic shear imaging. Ultrasound Med Biol. 2008 Sep;34(9):1373–1386. doi: 10.1016/j.ultrasmedbio.2008.02.002. [DOI] [PubMed] [Google Scholar]
- 8.Rosenzweig S, Palmeri M, Rouze N, Lipman S, Kulbacki E, Madden J, Polascik T, Nightingale K. Ultrasonics Symposium (IUS), 2012 IEEE International. IEEE; 2012. Comparison of concurrently acquired in vivo 3d arfi and swei images of the prostate; pp. 97–100. [Google Scholar]
- 9.Wang M, Byram B, Palmeri M, Rouze N, Nightingale K. Imaging transverse isotropic properties of muscle by monitoring acoustic radiation force induced shear waves using a 2-d matrix ultrasound array. Medical Imaging, IEEE Transactions on. 2013;32(9):1671–1684. doi: 10.1109/TMI.2013.2262948. [DOI] [PMC free article] [PubMed] [Google Scholar]
- 10.Wang M, Byram B, Palmeri M, Rouze N, Nightingale K. On the precision of time-of-flight shear wave speed estimation in homogeneous soft solids: initial results using a matrix array transducer. Ultrasonics, Ferroelectrics, and Frequency Control, IEEE Transactions on. 2013;60(4):758–770. doi: 10.1109/TUFFC.2013.2624. [DOI] [PMC free article] [PubMed] [Google Scholar]
- 11.Lipman SL, Rouze NC, Palmeri ML, Nightingale KR. Evaluating the improvement in shear wave speed image quality using multidimensional directional filters in the presence of reflection artifacts. IEEE Transactions on Ultrasonics, Ferroelectrics, and Frequency Control. 2016;63(8):1049–1063. doi: 10.1109/TUFFC.2016.2558662. [DOI] [PMC free article] [PubMed] [Google Scholar]
- 12.Gennisson J-l, Provost J, Deffieux T, Papadacci C, Imbault M, Pernot M, Tanter M, et al. 4-d ultrafast shear-wave imaging. Ultrasonics, Ferroelectrics, and Frequency Control, IEEE Transactions on. 2015;62(6):1059–1065. doi: 10.1109/TUFFC.2014.006936. [DOI] [PubMed] [Google Scholar]
- 13.Sinkus R, Tanter M, Xydeas T, Catheline S, Bercoff J, Fink M. Viscoelastic shear properties of in vivo breast lesions measured by {MR} elastography. Magnetic Resonance Imaging. 2005;23(2):159–165. doi: 10.1016/j.mri.2004.11.060. proceedings of the Seventh International Conference on Recent Advances in {MR} Applications to Porous MediaProceedings of the Seventh International Conference on Recent Advances in {MR} Applications to Porous Media. [Online]. Available: // //www.sciencedirect.com/science/article/pii/S0730725X05000391. [DOI] [PubMed] [Google Scholar]
- 14.Manduca A, Oliphant TE, Dresner M, Mahowald J, Kruse S, Amromin E, Felmlee JP, Greenleaf JF, Ehman RL. Magnetic resonance elastography: non-invasive mapping of tissue elasticity. Medical image analysis. 2001;5(4):237–254. doi: 10.1016/s1361-8415(00)00039-6. [DOI] [PubMed] [Google Scholar]
- 15.McAleavey SA, Osapoetra LO, Langdon J. Shear wave arrival time estimates correlate with local speckle pattern. IEEE transactions on ultrasonics, ferroelectrics, and frequency control. 2015;62(12):2054–2067. doi: 10.1109/TUFFC.2015.007171. [DOI] [PMC free article] [PubMed] [Google Scholar]
- 16.Rouze NC, Wang MH, Palmeri ML, Nightingale KR. Parameters affecting the resolution and accuracy of 2-d quantitative shear wave images. Ultrasonics, Ferroelectrics and Frequency Control, IEEE Transactions on. 2012;59(8):1729–1740. doi: 10.1109/TUFFC.2012.2377. [DOI] [PMC free article] [PubMed] [Google Scholar]
- 17.Palmeri ML, Rouze NC, Wang MH, Ding X, Nightingale KR. Ultrasonics Symposium (IUS), 2010 IEEE. IEEE; 2010. Quantifying the impact of shear wavelength and kernel size on shear wave speed estimation; pp. 13–16. [Google Scholar]
- 18.Elegbe EC, McAleavey SA. Single tracking location methods suppress speckle noise in shear wave velocity estimation. Ultrasonic imaging. 2013;35(2):109–125. doi: 10.1177/0161734612474159. [DOI] [PMC free article] [PubMed] [Google Scholar]
- 19.Hollender P, Rosenzweig S, Nightingale K, Trahey G. Single-and multiple- track location shear wave and acoustic radiation force impulse imaging: Matched comparison of contrast, cnr, and resolution. Ultrasound in Medicine & Biology. 2015;41:1043–1057. doi: 10.1016/j.ultrasmedbio.2014.11.006. [DOI] [PMC free article] [PubMed] [Google Scholar]
- 20.McAleavey SA, Menon M, Orszulak J. Shear-modulus estimation by application of spatially-modulated impulsive acoustic radiation force. Ultrasonic imaging. 2007;29(2):87–104. doi: 10.1177/016173460702900202. [DOI] [PubMed] [Google Scholar]
- 21.McAleavey S, Menon M, Elegbe E. Shear modulus imaging with spatially-modulated ultrasound radiation force. Ultrasonic imaging. 2009;31(4):217–234. doi: 10.1177/016173460903100401. [DOI] [PMC free article] [PubMed] [Google Scholar]
- 22.McAleavey S, Collins E, Kelly J, Elegbe E, Menon M. Validation of smurf estimation of shear modulus in hydrogels. Ultrasonic imaging. 2009;31(2):131–150. doi: 10.1177/016173460903100204. [DOI] [PMC free article] [PubMed] [Google Scholar]
- 23.Loupas T, Peterson R, Gill R. Experimental evaluation of velocity and power estimation for ultrasound blood flow imaging, by means of a two-dimensional autocorrelation approach. IEEE Trans. Ultrason. 1995 Jul;42(4):672–688. [Google Scholar]
- 24.Manduca A, Lake DS, Kruse S, Ehman RL. Spatio-temporal directional filtering for improved inversion of mr elastography images. Medical image analysis. 2003;7(4):465–473. doi: 10.1016/s1361-8415(03)00038-0. [DOI] [PubMed] [Google Scholar]
- 25.Deffieux T, Gennisson J-L, Bercoff J, Tanter M. On the effects of reflected waves in transient shear wave elastography. Ultrasonics, Ferroelectrics and Frequency Control, IEEE Transactions on. 2011;58(10):2032–2035. doi: 10.1109/TUFFC.2011.2052. [DOI] [PubMed] [Google Scholar]
- 26.Song P, Manduca A, Zhao H, Urban MW, Greenleaf JF, Chen S. Fast shear compounding using robust 2-d shear wave speed calculation and multi-directional filtering. Ultrasound in medicine & biology. 2014;40(6):1343–1355. doi: 10.1016/j.ultrasmedbio.2013.12.026. [DOI] [PMC free article] [PubMed] [Google Scholar]
- 27.Song P, Zhao H, Manduca A, Urban MW, Greenleaf JF, Chen S. Comb-push ultrasound shear elastography (cuse): a novel method for two-dimensional shear elasticity imaging of soft tissues. IEEE transactions on medical imaging. 2012;31(9):1821–1832. doi: 10.1109/TMI.2012.2205586. [DOI] [PMC free article] [PubMed] [Google Scholar]
- 28.Song P, Urban MW, Manduca A, Zhao H, Greenleaf JF, Chen S. Comb-push ultrasound shear elastography (cuse) with various ultrasound push beams. IEEE transactions on medical imaging. 2013;32(8):1435–1447. doi: 10.1109/TMI.2013.2257831. [DOI] [PMC free article] [PubMed] [Google Scholar]
Associated Data
This section collects any data citations, data availability statements, or supplementary materials included in this article.


