

Abstract
Key points
Spinal compression injury targeted to the neonatal upper lumbar spinal cord, the region of highest hindlimb locomotor rhythmogenicity, leads to an initial paralysis of the hindlimbs.
Behavioural recovery is evident within a few days and approaches normal function within about 3 weeks.
Fictive locomotion in the isolated injured spinal cord cannot be elicited by a neurochemical cocktail containing NMDA, dopamine and serotonin 1 day post‐injury, but can 3 days post‐injury as readily as in the uninjured spinal cord.
Low frequency coordinated rhythmic activity can be elicited in the isolated uninjured spinal cord by NMDA + dopamine (without serotonin), but not in the isolated injured spinal cord.
In both the injured and uninjured spinal cord, eliciting bona fide fictive locomotion requires the additional presence of serotonin.
Abstract
Following incomplete compression injury in the thoracic spinal cord of neonatal mice 1 day after birth (P1), we previously reported that virtually normal hindlimb locomotor function is recovered within about 3 weeks despite substantial permanent thoracic tissue loss. Here, we asked whether similar recovery occurs following lumbar injury that impacts more directly on the locomotor central pattern generator (CPG). As in thoracic injuries, lumbar injuries caused about 90% neuronal loss at the injury site and increased serotonergic innervation below the injury. Motor recovery was slower after lumbar than thoracic injury, but virtually normal function was attained by P25 in both cases. Locomotor CPG status was tested by eliciting fictive locomotion in isolated spinal cords using a widely used neurochemical cocktail (NMDA, dopamine, serotonin). No fictive locomotion could be elicited 1 day post‐injury, but could within 3 days post‐injury as readily as in age‐matched uninjured control spinal cords. Burst patterning and coordination were largely similar in injured and control spinal cords but there were differences. Notably, in both groups there were two main locomotor frequencies, but injured spinal cords exhibited a shift towards the higher frequency. Injury also altered the neurochemical dependence of locomotor CPG output, such that injured spinal cords, unlike control spinal cords, were incapable of generating low frequency rhythmic coordinated activity in the presence of NMDA and dopamine alone. Thus, the neonatal spinal cord also exhibits remarkable functional recovery after lumbar injuries, but the neurochemical sensitivity of locomotor circuitry is modified in the process.
Keywords: spinal cord injury, recovery, adaptive plasticity, network re‐organization, sprouting
Key points
Spinal compression injury targeted to the neonatal upper lumbar spinal cord, the region of highest hindlimb locomotor rhythmogenicity, leads to an initial paralysis of the hindlimbs.
Behavioural recovery is evident within a few days and approaches normal function within about 3 weeks.
Fictive locomotion in the isolated injured spinal cord cannot be elicited by a neurochemical cocktail containing NMDA, dopamine and serotonin 1 day post‐injury, but can 3 days post‐injury as readily as in the uninjured spinal cord.
Low frequency coordinated rhythmic activity can be elicited in the isolated uninjured spinal cord by NMDA + dopamine (without serotonin), but not in the isolated injured spinal cord.
In both the injured and uninjured spinal cord, eliciting bona fide fictive locomotion requires the additional presence of serotonin.
Introduction
Most experimental studies of spinal cord injury have focused on cervical and thoracic injuries, presumably because these are the most prevalent in humans. Lumbar injuries, which comprise only about a fifth of all human spinal cord injuries (Singh et al. 2014), have received less attention. Because the lumbar spinal cord contains the circuitry responsible for generating patterned locomotor output to the lower extremities in humans (hindlimbs in quadrupedal animals, reviewed by Kiehn, 2006, 2011; Rybak et al. 2015), injuries in the lumbar region of the spinal cord risk compromising that circuitry. Thus, lumbar spinal cord injuries may be more resistant to recovery of locomotion.
Recovery from spinal cord injuries is substantially higher in neonatal animals than adult animals (Stelzner et al. 1975; Bregman & Goldberger, 1982; Saunders et al. 1995, 1998; Z'Graggen et al. 2000; Tillakaratne et al. 2010; Wheaton et al. 2011; Noor et al. 2013). To obtain more comprehensive information about the enhanced plasticity that occurs in the neonatal spinal cord, we developed a neonatal mouse model for spinal cord injury in which standardized injuries can be made and a variety of methodologies ranging from genetic to cellular to network to behavioural can be implemented (Boulland et al. 2013; Züchner et al. 2016). In this model, we have shown that following a single‐segment thoracic compression injury that results in marked diminution of white matter volume, the obliteration of 90% of neurons at the epicentre of the injured segment, a considerable loss of synaptic contacts onto lumbar motoneurons and an initial paralysis of the hindlimbs, a remarkable behavioural recovery ensues that reinstates essentially normal locomotor function. This is paralleled by re‐establishment and reorganization of synaptic connections, some of which are novel (Boulland et al. 2013; Chawla et al. 2017). Several permissive cellular sequelae evidently contribute to the recovery, including a general lack of inflammation, lack of reactive gliosis, and a time window that precedes the formation of myelin and perineuronal nets (Chawla et al. 2017). Neurogenesis does not contribute, but an increase in the density of serotonergic terminals caudal to the injury provides a potential facilitating influence (Chawla et al. 2017).
Thoracic spinal cord injuries damage multiple descending, ascending and propriospinal axon populations and can thus greatly hinder the activation of musculature in the lower extremities, but they do not impact directly on the motor circuitry that generates rhythmic locomotor output in those extremities. Given the plasticity of the neonatal spinal cord, the question arises whether the degree of recovery we have documented after thoracic injuries is possible irrespective of the level of injury. In particular, can the neonatal spinal cord achieve similar motor recovery following an injury located in the region where hindlimb locomotor central pattern generator (CPG) circuitry appears to be most highly concentrated? In this study, we have addressed this question by placing single‐segment compression injuries within the segmental range T13–L2, the upper and most rhythmogenic portion of the region believed to encompass the locomotor CPG circuitry that drives the hindlimbs (T13–L6, reviewed in Kiehn, 2006, 2011; Rybak et al. 2015). We subsequently assessed the function of the hindlimb locomotor CPG by recording fictive locomotion from the L2 and L5 ventral roots, as has been done in numerous studies of the uninjured spinal cord previously. Our results indicate that substantial locomotor recovery is possible after lumbar injuries, and also highlight coincident changes in neurochemical dependence that underscore the potential of pharmacological manipulation as an avenue for treatment of spinal cord injury.
Methods
Ethical approval
Animal experiments were approved by the Norwegian Animal Research Authority (Forsøksdyrutvalget, FDU ID. 4591) and followed the Federation of European Laboratory Animal Science Associations (FELASA) guidelines. In compliance with these regulations all efforts were made to minimize the number of mice used and their suffering. All experiments were performed on wild type ICR mice (Jackson Laboratories, Bar Harbor, ME, USA). Adult females were housed in individual cages or together with a dedicated male partner with 12 h light–dark cycle. Water and food access was ad libitum.
Surgery and spinal cord compression
Surgery and spinal cord compression (SCC) was performed on postnatal day 1 (P1) mice as previously described (Boulland et al. 2013; Züchner et al. 2016). Injuries were targeted either to spinal segments T8–T10 (Th‐SCC) or T13–L2 (Lb‐SCC), with each injury affecting a single segment within the indicated range (Fig. 1; variation in targeted segment is due to imprecision in localizing specific level prior to surgical incision). Briefly, after a deep sedation using 4% isoflurane (Forene; Abbott Norge, Fornebu, Norway) and local anaesthesia with bupivacaine (AstraZeneca Norge, Oslo, Norway), a laminectomy was performed to expose 1–2 segments of spinal cord and SCC was generated using a modified Yasargil temporary aneurism mini‐clip (Aesculap, FE681K, Tuttlingen, Germany). The compression was made for 2 × 15 s with a reversal of clip orientation in between to ensure symmetry. The wound was closed, painkillers administered (buprenorphine, Temgesic, Schering‐Plough, Belgium) and the operated mice were returned to the litter.
Figure 1. Schematic diagram summarizing the different experiments performed in this study.
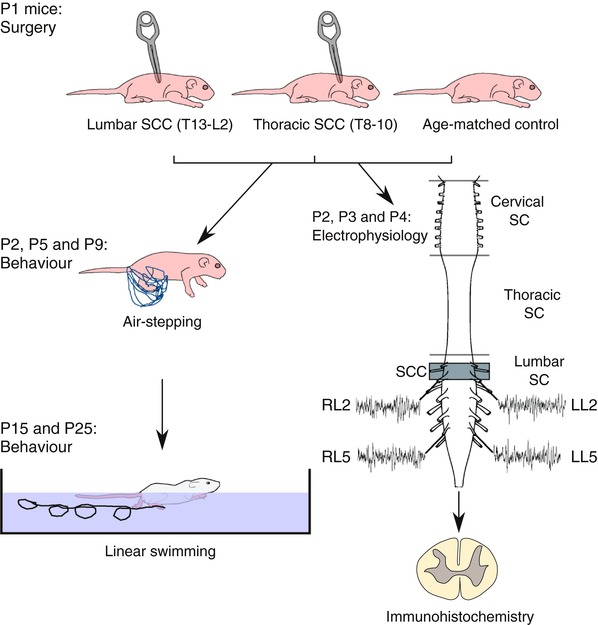
A spinal cord compression injury (SCC) was generated in 1‐day‐old (P1) mice at thoracic (T8–10, Th‐SCC) or lumbar (T13–L2, Lb‐SCC) levels. The behavioural locomotor tests, air‐stepping (P2, P5 and P9) and linear swimming (P15 and P25) were performed on injured and uninjured age‐matched control mice. Spinal cords from Lb‐SCC and control mice were dissected out at P2, P3 and P4 and electrophysiological recordings were made simultaneously from right and left L2 roots (RL2 and LL2, respectively) and right and left L5 roots (RL5 and LL5, respectively). The isolated spinal cords were then fixed and processed for immunohistochemistry and confocal microscopy. [Color figure can be viewed at wileyonlinelibrary.com]
Behavioural tests
Two sets of tests were performed at different ages in each group of mice (Fig. 1). The non‐weight‐bearing air‐stepping test provides an assessment of limb movements in neonatal mice during the early postnatal period (P2–P9) when their musculature is not strong enough to support body weight and permit ground locomotion (Fady et al. 1998; Boulland et al. 2013). Briefly, P2, P5 and P9 mice were placed in a fitted latex harness and suspended from a horizontal bracket. The mice rapidly assumed a resting posture with no sign of discomfort or agitation. Gentle tactile stimulation of the snout was then used to trigger escape‐like movements, during which hindlimb trajectories were recorded at 100 Hz (3 × 10 s) with a NX3‐S1 high speed video camera (IDT, Tallahassee, FL, USA) fitted with a macro objective (Micro‐Nikkor 55 mm, 1:3.5, Nikon). To assess non‐weight‐bearing limb movements in older mice (from P15 to P25) which resist suspension in a harness, linear swimming was employed and recorded at 200 Hz using the same camera fitted with a Canon EF‐S 18–200 mm f/3.5–5.6 IS objective. The mice were allowed three practice swimming attempts before their performance was recorded subsequently in three consecutive swims. For both tests, marks were placed at the paw, ankle, knee, hip and iliac crest using a black permanent marker to facilitate video tracking.
Tracking and analysis
Frame‐by‐frame tracking of the paw, ankle, knee, hip and iliac crest was performed semi‐automatically using either the program provided by the camera manufacturer (Motion Studio, IDT, Tallahassee, FL, USA) or manually using an ImageJ (Rasband, 1997) plug‐in (“Manual tracking”, https://imagej.nih.gov/ij/plugins/track/Manual%20Tracking%20plugin.pdf). The resulting x–y co‐ordinates were fed into an in‐house‐built template for Libreoffice (an open source and cross platform office suite, www.libreoffice.org) to calculate variables such as trajectories, speeds and joint angles and to plot these kinematically.
Isolated spinal cord preparation
Mice were deeply anaesthetized with an overdose of isoflurane and decapitated. Evisceration, ventral laminectomy and removal of the spinal cord from C5 to S4 were performed in ice‐cold oxygenated low Ca2+ artificial cerebrospinal fluid (“low Ca2+ ACSF”, in mm: 128 NaCl, 4 KCl, 1 CaCl2, 1 MgSO4, 0.5 NaH2PO4, 21 NaHCO3, 30 d‐glucose). Special care was taken during the dissection to preserve the lumbar ventral roots. The preparation was transferred to a silicone elastomer (Sylgard)‐coated recording chamber, where it was pinned down and continuously superfused with oxygenated normal Ca2+ ACSF (in mm: 2 CaCl2) at a rate of 2–5 ml min−1 at ambient temperature (24–26˚C). The preparation was left to rest for 30 min before recording.
Spinal cord electrophysiology
Ventral root potentials were recorded via tightly fitting suction electrodes (Ag–AgCl wire; borosilicate glass with filament; Harvard Apparatus, Holliston, MA, USA), filled with ACSF. Potentials were amplified with DPA differential amplifiers (NPI electronic, Tamm, Germany), AC‐mode bandpass filtered 100 Hz to 1.7 kHz, digitized at 10 kHz (Digidata 1322A, Axon Instruments or PicoScope 5442A, Pico Technology) and recorded with WinWCP (University of Strathclyde, Glasgow, UK) or Picoscope 6 (Pico Technology, Cambrige, UK).
Based on earlier studies, the L2 and L5 ventral root discharges correspond predominantly to activity in hindlimb flexor and extensor motoneurons (MNs), respectively (Kiehn & Kjaerulff, 1996; Whelan et al. 2000). Right and left roots were recorded to assess segmental alternation, and ipsilateral roots were recorded to assess flexor–extensor alternation. Regular, alternating discharge in left versus right and L2 versus L5 ventral roots was interpreted to indicate locomotor CPG activity (defined as fictive locomotion when expressed at a frequency of at least 0.1 Hz).
To control for preparation viability, 1–5 Hz stimulation of the ventral funiculus at the mid‐thoracic level using a tungsten monopolar surface electrode was employed to elicit activity in ventral roots. Fictive locomotion was triggered using a cocktail of the neurotransmitters/neurotransmitter agonists N‐methyl‐d‐aspartic acid (NMDA, 5 μm), serotonin (5‐hydroxytryptamine creatinine sulfate, or 5‐HT, 10 μm) and dopamine (DA, 50 μm), as previously described (Jiang et al. 1999; Hinckley et al. 2005). A stock solution of NMDA was aliquoted and kept frozen for several days of recording while stocks of serotonin and dopamine were freshly prepared. The resulting regular rhythm of ventral root discharges was sustained for up to 2 h. For analysis, sequences of stable rhythmic activity starting at about 30 min after cocktail application were used.
To examine the dependence of locomotor CPG output on serotonin in control and injured preparations, the following protocol was used: the preparation was superfused with a cocktail of NMDA (5 μm) and DA (50 μm) for 30 min, then 5‐HT (10 μm) was added to the superfusate. Analyses of ventral root activity (see below) were made 30 min after NMDA/DA application and 30 min after addition of serotonin.
For assessing the NMDA dose dependence of CPG output, preparations were superfused with DA (50 μm) and then increasing concentrations of NMDA were added (5, 6, 7 and 8 μm). For each increase in NMDA concentration, ventral root activity was recorded for 30 min. Following the 30 min recording in 8 μm NMDA, 5‐HT (10 μm) was added and a final 30 min recording was made.
Analysis of ventral root recordings
To analyse ventral root discharge patterns, a custom algorithm of quasi‐periodic oscillation analysis was used. Traces were filtered, rectified, resampled and smoothed using a weighted central moving average method (Hamming function) in Sigview (SignalLab, Mitov Software, Moorpark, CA, USA) and SciDAVis (open source and cross platform, http://scidavis.sourceforge.net/). This represented bursting discharges as quasi‐periodic wave oscillation events. Primary analysis of these oscillation events was performed using Clampfit 10.2 software (Molecular Devices, Sunnyvale, CA, USA) and parameters such as burst duration and cycle period were determined. Rhythm and inter‐root phase relationships were further analysed as described in more detail below using three different methods: (1) circular analysis, to obtain a statistical measure of L2–L5 coordination, (2) cross‐correlation analysis, to assess phase relationships between flexor and extensor bursts, and (3) autocorrelation analysis, to assess periodicity (Whelan et al. 2000).
We also analysed the discharge frequencies of each individual root during fictive locomotion in P4 injured and control preparations after 30 min superfusion with NMDA/DA/5‐HT, that is, once the rhythm had stabilized. Time intervals of 5–15 min were used to plot frequency distribution graphs (normalized to peak value, bean distribution fitted by a kernel smooth fit).
Circular analysis
Each cycle of rhythmic ventral root discharge was divided into burst and inter‐burst intervals as previously described (Kiehn & Kjaerulff, 1996). Phase was defined as the time shift between burst start time points in two compared roots within a cycle period. The mean of the individual phases, F1 to FN, where N is the number of cycles during ≥200 s, was calculated. In circular plots the phase is indicated by the direction of the vector originating from the centre of the circle. The length of the vector, ranging from 0 to 1, indicates the concentration of individual phase values around the mean. Circular analysis and statistical analysis were performed in OriginPro 10 (OriginLab, Northampton, MA, USA) using a custom written algorithm. Circular representation of phase was used to indicate the statistical significance of the phase relationships between left–right and flexor–extensor bursts (Kiehn & Kjaerulff, 1996). Phase diagrams were constructed by plotting phases within the 0–360 deg range, the number of events within each group were normalized to the total, and the preferred phase “R‐vector” was calculated. The direction of this vector represents the averaged preferred phase of the ventral root discharge, and its length is a measure of the statistical significance of the preferred phase. Vectors with a phase of 180 deg and 0/360 deg correspond to perfect alternation and perfect synchrony, respectively, between the compared ventral roots.
Correlation analyses
Autocorrelation and cross‐correlation functions were used to characterize continuous quasi‐periodic oscillations according to their periodicity, rhythmic stability and correlation of rhythms between compared ventral roots. The periodicity of flexor activity was tested by autocorrelation analysis whereas the phase relationship between flexor and extensor activity was tested by cross‐correlation analysis. Rhythm regularity was calculated from cross‐correlation functions (CCF), which were calculated and plotted for RL2/LL5, LL5/LL2, RL5/LL5 ventral root pairs and other ventral root pairs of interest. The cross‐correlation peaks are the extreme y values (both max and min) from the averaged CCF. The negative values from min peaks were converted into absolute values. The sum of the products of peak amplitudes and corresponding time lags was defined as the coefficient of cross‐correlation and calculated for each root pair. For each recording, an interval of at least 200 s was taken after 30 min of superfusion with the neurochemical cocktail, and auto‐correlations and cross‐correlations were computed and analysed with OriginPro 10. Mean and standard deviation (SD) values were obtained from the entire set. In autocorrelations, a stable alternating rhythm is characterized by a high positive correlation coefficient at zero phase lag followed by multiple peaks with little decrement with increasing phase lag (Whelan et al. 2000). In cross‐correlations, a positive value for the peak at time lag “0” indicates that the two signals are relatively in phase, whereas a negative value indicates that they are relatively out of phase.
Fixation, immunohistochemistry and imaging
Isolated spinal cords were immersion fixed with 4% paraformaldehyde in phosphate buffered saline (PBS, pH 7.4) for 3‐4 h, cryo‐protected with 30% sucrose in PBS, and sectioned with a freezing microtome at 30 μm per section. Immunohistochemistry was performed as previously described (Boulland et al. 2004). Briefly, free‐floating transverse sections were blocked for 1 h with 10% normal goat serum (NGS) in Tris‐buffered saline containing 0.5% (w/v) Triton X‐100, pH 7.4 (TBSTx). Sections were further incubated overnight in 1% NGS in TBSTx with mouse anti‐NeuN (Millipore MAB377, diluted 1/300) or rabbit anti‐serotonin (Sigma S5545, diluted 1/2000). The sections were then rinsed 3× with 1% NGS in TBSTx and incubated with secondary antibodies (Alexa‐488 goat anti‐mouse and/or Alexa‐555 goat anti‐rabbit, diluted 1/500) for 1 h at room temperature. The sections were then rinsed twice with 1% NGS in TBSTx and incubated for 5 min in the nuclear stain Hoechst 33258 (1 μg ml−1 in PBS). The sections were then rinsed for 5 min in PBS and mounted under coverslips in PBS:glycerol 1:1. The sections were examined and imaged with a Zeiss LSM 700 confocal microscope using tiled stacks to fully reconstruct the cross‐sectional area.
Quantification of immunohistochemistry data
Serotonin immunostaining was quantified by counting the number of 5‐HT‐positive pixels in thresholded immunohistochemistry images using ImageJ as previously described (Chawla et al. 2017). Initial analyses were performed on entire cross‐sectional areas. Secondary analyses were performed on regions of interest (ROIs) of equal size, positioned within the area of the grey matter that contained the highest pixel density, as assessed first visually and then by repositioning the ROI to obtain the maximum pixel density value. The number of NeuN‐positive neurons was obtained by automated cell counting using an ImageJ macro as previously described (Boulland et al. 2012; Chawla et al. 2017).
Statistics
Statistical comparison of means was performed using the non‐parametric Mann–Whitney U test. Information on sample size for the different groups is provided in the Results.
Results
General overview of experimental procedures
An overview of the experimental procedures performed is shown in Fig. 1, and an overview of the numbers of mice used for behavioural and fictive locomotion analyses (see below) is shown in Tables 1 and 2.
Table 1.
Number of mice used for behavioural tests
| Control | Th‐SCC | Lb‐SCC | Total | |
|---|---|---|---|---|
| P2 | 9 | 8 | 6 | 23 |
| P5 | 9 | 10 | 7 | 26 |
| P9 | 5 | 7 | 4 | 16 |
| P15 | 5 | 4 | 4 | 13 |
| P25 | 5 | 4 | 4 | 13 |
| Total | 33 | 33 | 25 | 91 |
Table 2.
Number of preparations used for assessing hindlimb locomotor CPG output in isolated spinal cords
| Control | Lb‐SCC | Total | |
|---|---|---|---|
| P2 | 6 | 7 | 13 |
| P3 | 9 | 10 | 19 |
| P4, NMDA/DA/5HT together | 18 | 20 | 38 |
| P4, NMDA/DA together and 5HT later | 10a | 6b | NR |
| P4, NMDA dose–response | 8 | 9 | 17 |
| Total | 41 | 46 | 87 |
aExhibited low frequency coordinated rhythmic activity in the presence of NMDA/DA that transitioned into fictive locomotion after addition of 5‐HT. bExhibited no low frequency coordinated rhythmic activity in the presence of NMDA/DA, but fictive locomotion after addition of 5‐HT. NR, not relevant because these preparations are a subpopulation of those tabulated in the previous row.
Slower functional recovery after lumbar versus thoracic spinal cord compression
We have reported previously that following a compression injury of a single segment within the lower thoracic spinal cord (Th‐SCC, injuries located from T8 to T12), neonatal mice spontaneously exhibit substantial functional recovery, including recovery of locomotion, despite severe and permanent loss of spinal cord tissue (Boulland et al. 2013; Züchner et al. 2016; Chawla et al. 2017). Since injuries in this thoracic region disrupt longitudinal axon tracts important for initiating and modulating locomotion, but do not directly impact the spinal circuitry responsible for generating patterned locomotor output in the hindlimbs, we wanted to test the capacity for functional recovery following injuries to the upper lumbar spinal cord, which is believed to contain a large proportion of the hindlimb locomotor CPG network. Compression injuries affecting a single segment were therefore generated at P1 in the region encompassing T13–L2 (Lb‐SCC, n = 12) and for comparison in the region T8–T10 (Th‐SCC, n = 19), followed by behavioural testing at P2–P9.
Initial assessment of motor performance was made using the non‐weight‐bearing air‐stepping test at P2, P5 and P9 (Fig. 2). Kinematic analysis showed a delayed recovery of hindlimb movements in Lb‐SCC mice compared to Th‐SCC mice, and a lower movement amplitude in the Lb‐SCC mice at all tested time points (Fig. 2 A). Analysis of the hindlimb paw trajectory provided an accurate descriptor of this difference (Fig. 2 B). At P2, both Lb‐SCC (n = 6) and Th‐SCC (n = 8) mice had strikingly diminished hindlimb paw trajectories relative to uninjured control mice (n = 9). At P5, hindlimb paw trajectory was still significantly lower in both injured groups compared to the control group (n = 9, P < 0.01), but was also significantly lower in the Lb‐SCC group (n = 7) than in the Th‐SCC group (n = 10, P < 0.001). At P9, the Th‐SCC (n = 7) and control (n = 5) groups were no longer statistically different (P > 0.05), but the hindlimb paw trajectory was still significantly lower in the Lb‐SCC group (n = 4, P < 0.05) compared to the control group.
Figure 2. Slower behavioural recovery occurs after Lb‐SCC than after Th‐SCC.
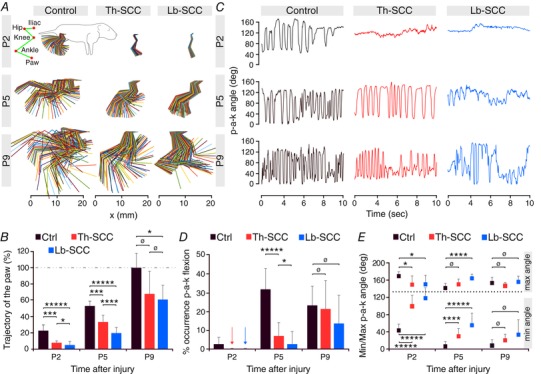
A, kinematic analysis of hindlimb movements at P2, P5 and P9 showing hindlimb movement amplitudes in Th‐SCC, Lb‐SCC and age‐matched uninjured control mice. B, paw trajectory in injured mice as a percentage of that in P9 control mice. C, variation of the paw‐ankle‐knee (p‐a‐k) angle. D, percentage of flexion as assessed within the range of 0–45 deg of the p‐a‐k angle. Arrows represent nil values. E, minimum and maximum values of the p‐a‐k angle. Error bars represent SD. * P < 0.05; *** P < 0.01; **** P < 0.005; ***** P < 0.001; ø P > 0.05.
In agreement with these data the variation of the hindlimb paw–ankle–knee (p‐a‐k) angle during air‐stepping also recovered more slowly in the Lb‐SCC group than in the Th‐SCC group (Fig. 2 C). At P2, neither injured group exhibited any changes in the p‐a‐k angle, in accordance with the general lack of hindlimb motility at that time point. At P5, the Th‐SCC mice were able to vary the p‐a‐k angle rhythmically nearly as well as did the uninjured control mice, whereas Lb‐SCC mice displayed only low amplitude and low frequency p‐a‐k angle changes. At P9 both Th‐SCC and Lb‐SCC mice exhibited similar p‐a‐k angle variation. Because we observed several cases of tonic extension or flexion of the ankle in the Lb‐SCC group but never in the Th‐SCC group, we quantified the occurrence of ankle flexion (p‐a‐k angle between 0 and 45 deg) during air‐stepping (Fig. 2 D). At P2, the p‐a‐k angle was always greater than 45 deg, indicating little flexion, in both groups of injured mice. At P5, Th‐SCC mice exhibited ankle flexion that was significantly more frequent than in Lb‐SCC mice (P < 0.05). By P9, the occurrence of full flexion was similar to control values in both groups of injured mice (P > 0.05).
We further determined the minimum and maximum values of the p‐a‐k angle in the three groups of mice (Fig. 2 E). At P2, the minimum angle was significantly lower in uninjured control mice (44 deg, n = 9) than in Th‐SCC mice (100 deg, P < 0.001, n = 8) and Lb‐SCC mice (117 deg, P < 0.001, n = 6). The situation was similar at P5, although the minimum angles in both injured groups started to approach those in uninjured control mice. By P9 there were no significant differences in minimum p‐a‐k angle among the three groups.
Although maximum p‐a‐k angles were much more similar at all time points in the three groups, there was nevertheless a statistically significant difference at P2 between each injured group and the uninjured control group. At P5, there was still a significant difference between uninjured control and Lb‐SCC mice (P < 0.005) but not between uninjured control and Th‐SCC mice (P > 0.05). At P9, as was the case for minimum p‐a‐k angles, the maximum p‐a‐k angles of both groups of injured mice were not statistically different from the control group (P > 0.05).
Recovery of fictive locomotion
Based on the results of the behavioural tests showing that hindlimb movements and ankle joint flexion started to recover in Lb‐SCC mice by P5, we wondered to what degree the lumbar locomotor CPG was capable of producing rhythmic, alternating discharge patterns post‐injury. To test this, we recorded from L2 and L5 ventral roots in ex vivo whole spinal cord preparations using a standardized protocol that employed a cocktail of NMDA/DA/5‐HT to trigger fictive locomotion. Recordings were made from a total of 87 preparations obtained from 41 Lb‐SCC mice at P2–P4 and 46 age‐matched uninjured control mice (Table 2). We note that injuries located in L2 led to a diminished calibre of the L2 ventral roots (consistent with injury‐induced loss of MNs), but still permitted recording of activity. Despite the compression injuries, stimulation of the thoracic ventral funiculus consistently evoked lumbar ventral root responses in injured spinal cords, demonstrating that ventral roots were physiologically intact.
Introducing the neurochemical cocktail always caused an immediate increase in ventral root discharge in both Lb‐SCC and uninjured control spinal cords. A steady rhythm was obtained after about 30 min of continuous superfusion as previously reported (Christie & Whelan, 2005; Gordon et al. 2008; Stil et al. 2011; Griener et al. 2013; Milan et al. 2014). Representative recordings from L2 and L5 ventral roots in an uninjured control spinal cord (Fig. 3 A) show the typical regular, alternating rhythm obtained. Further analysis was made on filtered, rectified and smoothed traces (shown in red) from a 200 s interval of activity. Autocorrelation and cross‐correlation, respectively, demonstrate the stability of the rhythm in all four ventral roots (Fig. 3 B), and the expected out‐of‐phase relationship between same‐level left and right roots and between ipsilateral L2 and L5 roots (Fig. 3 C). This was further supported by circular analysis of phase relationships for different ventral root pairs (Fig. 3 D). The right L2/left L5 (RL2/LL5) pair showed a preferred phase of about 30 deg, corresponding to in‐phase bursting, and the left L2/left L5 (LL2/LL5) pair showed a preferred phase of about 170 deg, corresponding to out‐of‐phase firing, as has been described previously (Dunbar et al. 2010). The durations of both flexor and extensor motor bursts were positively correlated with cycle period (Fig. 3 E), as reported previously (Juvin et al. 2007).
Figure 3. Properties of neurochemically (NMDA/DA/5‐HT) induced fictive locomotion in neonatal control mice.
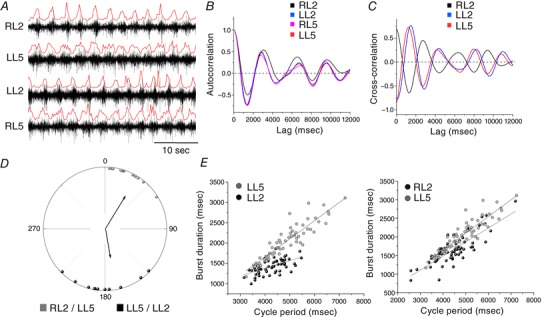
A, raw traces from ventral root recordings showing a long‐lasting episode of rhythmic locomotor activity with left–right (RL2–LL2/RL5–LL5) and flexor–extensor (RL2–RL5/LL2–LL5) alternation. A rectified and smoothed version (red line) of the raw trace was used to determine burst onset and cycle period. B, autocorrelograms corresponding to each ventral root shown in A. C, cross‐correlograms shown for left–right and flexor–extensor ventral root pairs. D, circular graph showing phase lag relationships for RL2 versus LL5 (in phase) and LL2 versus LL5 (out of phase). Vectors show the mean phase values and r values, their orientations indicate preferred phase of firing and their lengths are proportional to coupling strength. E, scatter diagrams of burst duration versus cycle period, with linear regression lines indicated.
Successful recordings were not always obtained from all four of the LL2/RL2/LL5/RL5 ventral roots. For simplicity, throughout the remainder of this report we use the term fictive locomotion for rhythmic activity recorded in two or more of these roots in which the recorded roots exhibited the appropriate phase relationships as described above. This is in keeping with previous studies, which typically do not include all four ventral roots when documenting fictive locomotion (Dunbar et al. 2010; Bouvier et al. 2015; Rybak et al. 2015; Mandadi et al. 2016). To compare the capability of Lb‐SCC and control spinal cords to generate fictive locomotion, we first determined the success rate for initiating fictive locomotion as defined above (Fig. 4).
Figure 4. Transient and reversible loss of fictive locomotion after Lb‐SCC.
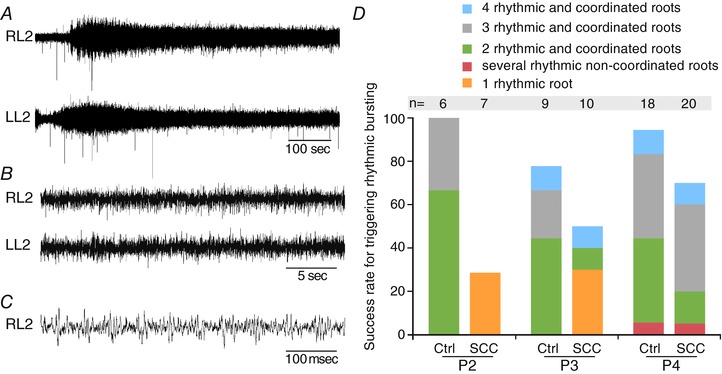
A, representative recordings from RL2 and LL2 ventral roots 1 day post‐injury immediately following application of the NMDA/DA/5‐HT cocktail used to trigger fictive locomotion. B, recordings from RL2 and LL2 ventral roots showing lack of coordinated rhythmic activity at P2 in Lb‐SCC preparations. C, higher temporal resolution sequence from the RL2 ventral root recording shown in B. Activity is not coordinated into rhythmic bursts. D, diagram showing the success rate for triggering fictive locomotion in Lb‐SCC and in age‐matched uninjured control spinal cords (P2, P3 and P4). Note that even control spinal cords do not always exhibit rhythmic activity in all 4 ventral roots.
Fictive locomotion was induced by the neurochemical cocktail in all tested uninjured control spinal cords at P2 (n = 6), in about 80% at P3 (n = 9) and in about 90% at P4 (n = 18) (Fig. 4 D). The success rate fell to about 50% at P5, however (n = 4, data not shown). This age‐related decrement was not due to diminished viability of ventral roots, since spontaneous non‐rhythmic activity was still evident and discharges could be elicited reliably by ventral funiculus stimulation. Rather, it reflects a diminished capacity for neurochemically induced fictive locomotion, likely due to anoxia in the central core of the isolated spinal cord (Wilson et al. 2003). In all uninjured control spinal cords in which fictive locomotion was induced, irrespective of age, we observed the expected phase relationships in flexor–extensor and left–right alternation (Fig. 3).
In Lb‐SCC preparations at P2 (n = 7), a massive but transient increase in discharge occurred upon addition of the neurochemical cocktail to the superfusate (Fig. 4 A–C), but fictive locomotion never occurred through 60 min of continuous recording (Fig. 4 B–D). Nevertheless, in two preparations some rhythmic firing occurred in one of the recorded ventral roots after 40 min of neurochemical exposure (RL2 in one case and LL5 in the other). At P3 (n = 10), fictive locomotion was elicited in one preparation, LL2/LL5 alternation in another (Fig. 4 D), and rhythmic firing in a single root in three preparations. In five preparations, no rhythmic activity was induced. At P4 (n = 20), bona fide fictive locomotion was induced in 13 preparations (65%), less than the success rate seen in the P4 uninjured control group but still substantial (Figs 4 D and 5 A).
Figure 5. Fictive locomotion has similar properties at P4 in Lb‐SCC and control preparations.
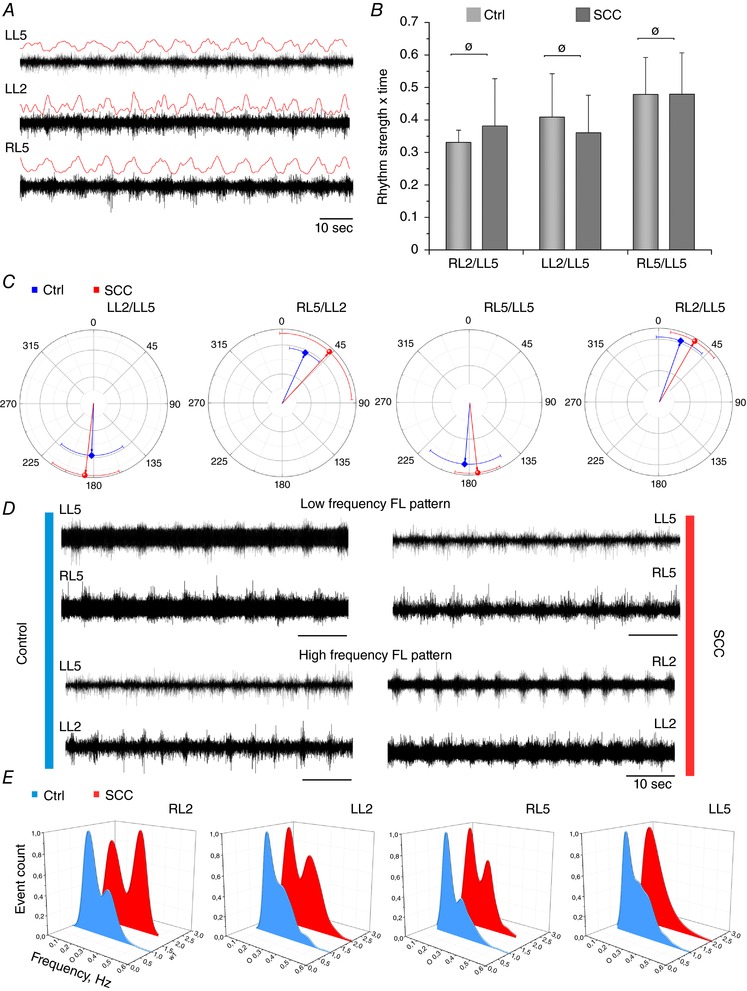
A, representative ventral root recordings P4 from an injured spinal cord show obvious rhythmicity characteristic of fictive locomotion (FL). Rectified and smoothed versions of the raw traces are shown in red. B, comparison of rhythm strength for different ventral root pairs in control and Lb‐SCC preparations at P4. There was no statistically significant difference between rhythm strength of control and Lb‐SCC recordings for the RL2/LL5, LL2/LL5 and RL5/LL5 ventral root pairs (ø P > 0.05). Error bars represent SD. C, circular plots showing the preferred phase relationships for different ventral root pairs at P4 (red line, injured; blue line, controls). Vector orientation and error bars represent mean and SD, respectively, of the phase for each indicated ventral root pair. D, representative ventral root recordings showing low and high bursting frequency in control (left panel) and Lb‐SCC (right panel) spinal cord preparations. E, distribution of rhythm frequencies in different roots during fictive locomotion at P4 (red line, injured; blue line, controls).
Rhythm regularity was calculated from cross‐correlation functions for the RL2/LL5, LL2/LL5 and RL5/LL5 ventral root pairs in all P4 preparations that exhibited fictive locomotion (as described in the Methods). None of the ventral root pairs exhibited a statistical difference on comparison of uninjured control and Lb‐SCC groups (P > 0.05; Fig. 5 B).
In P4 Lb‐SCC preparations that exhibited fictive locomotion, the regression coefficients and slopes calculated from linear regression plots of burst duration versus cycle period were not statistically different from those of age‐matched uninjured control preparations (P > 0.05, Table 3). Nor were preferred phase relationships of ventral root pairs significantly different (Table 4, Fig. 5 C).
Table 3.
Regression coefficients and slopes calculated from plots of burst duration versus cycle period represented as mean ± SD
| LL2 | RL5 | LL5 | ||
|---|---|---|---|---|
| Regression coefficient | P4 control | 0.39 ± 0.24 | 0.45 ± 0.33 | 0.51 ± 0.25 |
| P4 Lb‐SCC | 0.58 ± 0.20 | 0.40 ± 0.25 | 0.56 ± 0.21 | |
| P value | >0.05 | >0.05 | >0.05 | |
| Slope | P4 control | 0.31 ± 0.23 | 0.35 ± 0.23 | 0.37 ± 0.16 |
| P4 Lb‐SCC | 0.39 ± 0.11 | 0.31 ± 0.14 | 0.35 ± 0.14 | |
| P value | >0.05 | >0.05 | >0.05 |
Table 4.
Mean preferred phase relationships (in degrees) between indicated pairs of ventral roots represented as mean ± SD
| RL5–LL5 | LL5–LL2 | LL2–RL5 | |
|---|---|---|---|
| P4 control | 184.2 ± 35.7 | 182.3 ± 36.4 | 24.7 ± 17.1 |
| P4 Lb‐SCC | 173.0 ± 18.6 | 187.1 ± 27.8 | 42.7 ± 44.7 |
| P values | >0.05 | >0.05 | >0.05 |
Taken together, these results show that neurochemically induced fictive locomotion following Lb‐SCC is completely lost at P2, but largely recovers at P4, at which point it exhibits many of the characteristics of the fictive locomotion expressed by age‐matched uninjured control spinal cords.
Change in the frequency profile of fictive locomotion following Lb‐SCC
The frequency of neurochemically induced fictive locomotion previously reported in the mouse varies from 0.07 to 0.54 Hz, depending on the neurochemical cocktail used and the genetics of the mouse strain, with a mode of about 0.20–0.25 Hz (Table 5). We have used a cocktail of NMDA/DA/5‐HT (5/50/10 μm concentrations) that has previously been shown to drive a stable rhythm within this mode in wild type mice (0.24 Hz, Whelan et al. 2000).
Table 5.
Overview of different neurochemical cocktail recipes used and fictive locomotion cycle frequencies reported in earlier publications in various strains of mice
| Concentration of neurochemicals used to induce fictive locomotion (μm) | |||||
|---|---|---|---|---|---|
| Mean frequency, Hz | NMDA | 5‐HT | DA | Mouse strain | Reference |
| 0.07 | 5–10 | 10 | 50 | C57BL/6 | (Stil et al. 2011) |
| 0.16 | 5–10 | 5–10 | 25–50 | Chx10‐EGFP transgenic mice | (Dougherty & Kiehn, 2010) |
| 0.18 | 5–10 | 5–10 | |||
| 0.2 | 3–10 | 6–12 | 15–20 | Transgenic mice Hb9 | (Anderson et al. 2012) |
| 0.22 | 3–10 | 6–12 | 15–20 | ICR mice | (Zhong et al. 2007) |
| 0.22 | 16 | 16 | 50 | SOD1 and WT | (Milan et al. 2014) |
| 0.23 | 9 | 12 | 18 | Hb9‐GFP and Chx10‐CFP | (Kwan et al. 2010) |
| 0.24 | 5 | 10 | Dbx1:Cre | (Dyck & Gosgnach, 2009) | |
| 0.24 | 5 | 10 | 50 | Swiss Webster mice | (Whelan et al. 2000) |
| 0.25 | 5–10 | 5–10 | Chx10‐EGFP transgenic mice | (Dougherty & Kiehn, 2010) | |
| 0.27 | 5 | 8 | Hb9:Cre | (Caldeira et al. 2017) | |
| 0.33 | 7 | 8 | |||
| 0.33 | 15 | 10 | SOD1 and WT | (Milan et al. 2014) | |
| 0.36 | 10 | 8 | Hb9:Cre | (Caldeira et al. 2017) | |
| 0.38 | 8 | 8 | Chx10:CFP mice | (Zhong et al. 2011, 2012) | |
| 0.54 | 10 | 10 | |||
In both control and injured preparations, we observed two main frequency domains (Fig. 5 D). The average frequency of fictive locomotion in P4 control versus Lb‐SCC preparations was not statistically different (0.22 ± 0.002 Hz (n = 11) versus 0.23 ± 0.002 Hz (n = 9), respectively, P > 0.05). To further assess the effects of Lb‐SCC on locomotor CPG rhythm, we measured the frequency distribution in each individual root during an extensive period of recording (8–15 min) after rhythm stabilization. We found two main frequency peaks at 0.15–0.18 and 0.27–0.36 Hz in all roots in both uninjured and injured spinal cords, with the most obvious bimodal divergence in RL2 and RL5 (Fig. 5 E). In the injured spinal cords there was a pronounced shift to the higher frequency mode in all roots except LL5 (Fig. 5 E).
Functional recovery despite pronounced neuronal loss within the region of highest locomotor rhythmicity
In our recent study of Th‐SCC we showed that about 90% of neurons are lost at the injury epicentre (Chawla et al. 2017). Here, using immunolabelling for NeuN and quantification of the total number of NeuN‐positive cells 3 days after Lb‐SCC, we similarly found an 86% loss of neurons at the epicentre of the injury compared to age‐matched P4 control mice (Fig. 6 A–C; P < 0.025; n = 4 for both groups). Thus, behavioural recovery and reinstatement of fictive locomotion occurs despite a substantial, general loss of neurons within part of the region containing the highest locomotor rhythmicity (Cazalets et al. 1995), and by inference a major portion of the CPG network driving the hindlimbs (T13–L6, reviewed by Kiehn, 2006).
Figure 6. Neuronal loss and sprouting of serotonergic fibres at P4 in Lb‐SCC.
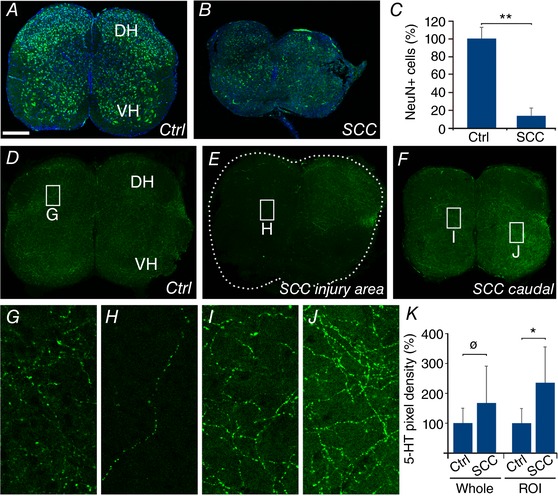
Representative confocal images from transverse sections of uninjured control (A) and Lb‐SCC (B) spinal cords immunostained for NeuN (green) and counterstained with Hoechst 33258 (blue). C, quantification of the total number of NeuN‐positive cells in Lb‐SCC and age‐matched uninjured control spinal cord sections at the level of injury shown as percentage of control. D–J, confocal images from spinal cord cross‐sections from control (D and G) and Lb‐SCC (E, F, H, I and J) spinal cords immunostained for serotonin (5‐HT). G–J show higher magnification images from the regions indicated by white rectangles in D–F. K, quantification of the 5‐HT‐immunopositive pixel density in the control and Lb‐SCC sections over the entire section (whole) and in selected regions of interest (ROIs) containing the highest pixel density. Error bars represent SD. * P < 0.05; ** P < 0.025; ø P > 0.05; DH, dorsal horn; VH, ventral horn.
Changes in the density of serotonergic innervation following Lb‐SCC
We showed in our earlier study that by 3 weeks following a thoracic compression injury, substantial sprouting of serotonergic fibres had occurred below the injury, leading to a 2.5‐fold increase in the density of 5‐HT‐immunopositive pixels in images of transverse sections (Chawla et al. 2017). Here, we compared serotonergic innervation in the lumbar spinal cord at P4 in Lb‐SCC mice and control mice, within and 1 mm caudal to the injury site (Fig. 6 D–J). Following Lb‐SCC, there was a pronounced decrease of 5‐HT immunostaining in large swathes of the grey matter within the injury site, which we did not quantify (Fig. 6 E and H). By contrast, there was an increase of 5‐HT immunostaining 1 mm caudal to the injury site (Fig. 6 F, I and J). This increase was spatially heterogeneous, however, such that quantification over the entire area of transverse sections (n = 4 preparations for each group) gave a non‐significant difference (P < 0.05, Fig. 6 K). We therefore performed a second quantification focused on regions of interest (ROIs) positioned within the grey matter area with the highest 5‐HT immunopositive pixel density in each section. This gave a statistically significant difference (135% increase in injured compared to uninjured, P < 0.05, Fig. 6 K). The general impression is that the injury damages a large proportion of serotonergic fibres and that sprouting of the spared serotonergic fibres has begun by P4 but not yet reached the levels attained by 3 weeks post‐injury in the case of Th‐SCC (Chawla et al. 2017).
Altered neurochemical dependence of locomotor CPG output after Lb‐SCC
Since serotonin plays an important role in regulating the locomotor CPG, the post‐injury changes in serotonergic innervation at P4 prompted us to examine the serotonin dependence of fictive locomotion at the same time point. For this, we used a cocktail of NMDA/DA (5/50 μm), which in preliminary experiments we found to induce in a majority of cases a low frequency rhythmic output that provided a basis for modulation by the subsequent addition of 5‐HT (10 μm). In age‐matched uninjured control spinal cords (P4, n = 10, Table 2), NMDA/DA induced episodes of low‐frequency rhythmic activity in 9 of 10 preparations (averaged for all roots: 0.063 ± 0.09 Hz) with clear left–right and flexor–extensor alternation (Fig. 7 A and B). Subsequent addition of 5‐HT resulted in a pronounced transition to the higher frequency characteristic of bona fide fictive locomotion (0.18 ± 0.08 Hz, n = 10, Fig. 7 C and D).
Figure 7. Increased serotonin dependence of hindlimb locomotor CPG output following Lb‐SCC.
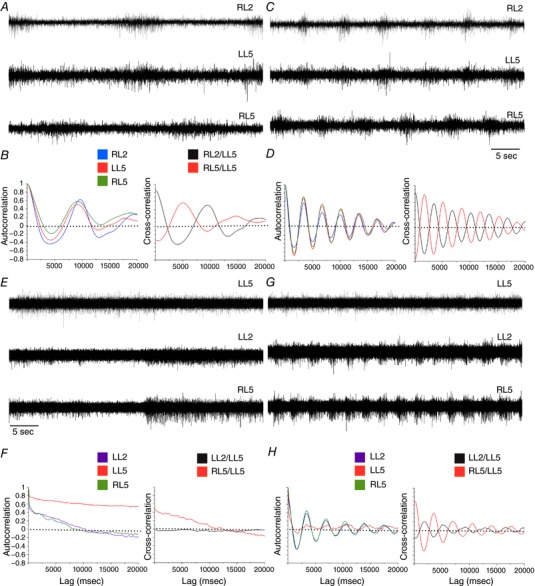
A–D, serotonin dependence in control spinal cords. Representative raw ventral root recordings from control spinal cords prior to (A) and after serotonin application (C) during rhythmic activity elicited by a reduced neurochemical cocktail (NMDA, 5 μm; DA, 50 μm). B and D, auto‐ and cross‐correlations for the traces shown in A and C, respectively. A slow rhythmic output can be elicited without serotonin, but addition of serotonin increases frequency markedly to match that of bona fide fictive locomotion. E–H, serotonin dependence in P4 Lb‐SCC preparations. Representative raw ventral root recordings from a Lb‐SCC spinal cord prior to (E) and after serotonin application (G) while in the presence of the reduced neurochemical cocktail (NMDA, 5 μm; DA, 50 μm). F and H, auto‐ and cross‐correlations for the traces shown in E and G, respectively. The non‐oscillatory, decaying cross‐correlations in F indicate a lack of rhythmicity in the absence of serotonin. Rhythmicity is instated following serotonin application, as shown by the oscillatory auto‐ and cross‐correlation functions in H.
In contrast, in P4 injured spinal cords (n = 6, Table 2), NMDA/DA typically induced only long episodes of unpatterned activity with no obvious rhythm (4 of 6 Fig. 7 E and G). Subsequent addition of 5‐HT induced fictive locomotion with an average frequency of 0.22 ± 0.1 Hz (n = 6, Fig. 7 F and H) within 14.0 ± 4.6 min (less than the approximately 30 min it typically takes to induce fictive locomotion when introducing the complete NMDA/DA/5‐HT cocktail).
The frequency of fictive locomotion is known to be highly dependent on NMDA concentration (Talpalar & Kiehn, 2010). Since injury is likely to impact on a variety of glutamatergic connections, it may involve more than just changes in serotonin sensitivity. We decided therefore to characterize the NMDA dependency of locomotor CPG output in the absence of serotonin by performing a dose–response assessment using step increases in NMDA concentration (5, 6, 7 and 8 μm) in the presence of a constant DA concentration (50 μm, Fig. 8 A–D). We chose 8 μm as the highest NMDA concentration because in pilot experiments on uninjured spinal cords, increasing NMDA concentration from 5 to 10 μm led to synchronization of bursts in all ventral roots (data not shown) with fictive locomotion observed only in some cases after addition of serotonin. Using autocorrelation and cross‐correlation analyses as described above, we found that in control spinal cords low frequency coordinated rhythmic activity was almost always obtained in the presence of 5 μm NMDA (7 of 8 preparations). The proportion of preparations exhibiting this low frequency activity decreased as the NMDA concentration was increased, and rhythm coordination began to be disrupted when NMDA concentration reached 7 and 8 μm. Despite this disruption, adding 10 μm serotonin after increasing the NMDA concentration to 8 μm quickly elicited bona fide fictive locomotion (Fig. 8 A, C, E and F).
Figure 8. Dose dependence of NMDA on the rhythmic output of the locomotor CPG in isolated spinal cords from P4 Lb‐SCC and uninjured control mice.
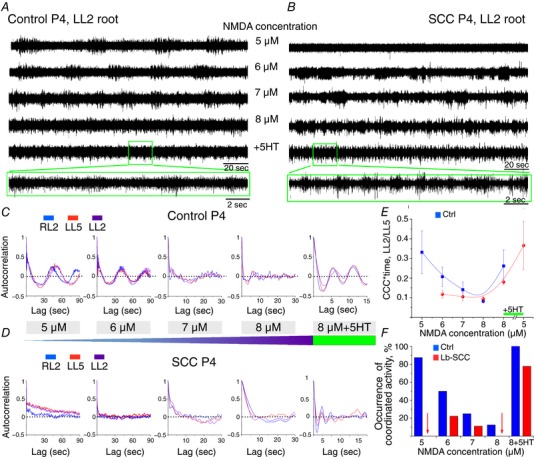
Representative LL2 root activity elicited by exposure to a constant DA concentration (50 μm) with step increases in NMDA concentration (5–8 μm), with 10 μm serotonin added as a last step, in P4 control (A) and Lb‐SCC (B) preparations. Autocorrelation of rhythmic activity in RL2, LL5 and LL2 ventral roots with step increase in NMDA concentration and subsequent addition of serotonin in P4 control (C) and P4 Lb‐SCC (D) preparations. E, NMDA dose–response on cross‐correlation coefficient (CCC) integrated by time for the ventral root pair LL2/LL5. F, occurrence of coordinated rhythmic activity in control (n = 8) and Lb‐SCC (n = 9) preparations with step increases of NMDA concentration and subsequent addition of serotonin. The data represent the percentage of coordinated activity within each group. Red arrows indicate nil value.
By contrast, in Lb‐SCC preparations low frequency coordinated rhythmic activity was not elicited at all by 5 μm NMDA (7 of 7 preparations) and only in a few cases by 6 or 7 μm NMDA (2 of 7 and 1 of 7 preparations, respectively; Fig. 8 B, D, E and F). As in controls, rhythmicity was disrupted at 7 and 8 μm NMDA (Fig. 8 E and F). Adding 10 μm serotonin after reaching 8 μm NMDA nevertheless instated high frequency coordinated rhythmic activity characteristic of fictive locomotion in a large proportion of cases (7/9 preparations, Fig. 8 F) albeit with lower rhythm strength than in uninjured controls (Fig. 8 E). Interestingly, subsequently lowering the NMDA concentration from 8 μm to 5 μm increased rhythm strength (4 of 4 preparations, Fig. 8 E), suggesting that robustness of the rhythm following injury requires a proper balance of serotonin and NMDA concentrations (Cowley & Schmidt, 1997).
These results indicate that the locomotor CPG in uninjured spinal cords has a latent rhythmicity that can be expressed in the presence of low NMDA concentrations and in the absence of exogenous serotonin, and which can be augmented to full‐blown fictive locomotion by adding serotonin. This latent rhythmicity is diminished following Lb‐SCC, such that rhythmic output is almost never seen in the absence of serotonin, over a range of NMDA concentrations.
Nearly full behavioural recovery by 24 days post‐injury
To assess whether behavioural recovery continued beyond P9, we conducted additional behavioural tests at P15 and P25. We again used high‐speed cinematography, focusing on hindlimb kinematics and translational speed during linear swimming (Fig. 9). We had, for comparison, unpublished data (E. Kondratskaya and J.‐L. Boulland) from previous experiments, which showed that the cycle frequency of hindlimb flexion–extension during swimming by uninjured P4 control mice is 2.1 ± 0.5 Hz (n = 9). Swimming frequency increased in uninjured control mice to 6.2 ± 0.5 Hz by P15, and further to 7.7 ± 1.3 Hz by P25 (P < 0.025). Moreover, swimming efficiency showed a developmental improvement in uninjured control mice from P15 (n = 5) to P25 (n = 5). There was no obvious difference in the hindlimb paw trajectories, but paw speed, translational speed and the rate of p‐a‐k angle change were all greater in the older uninjured control mice, indicating a more efficient stroke (Fig. 9 A–D).
Figure 9. Nearly complete functional recovery of linear swimming within 3 weeks post‐injury by Th‐SCC and Lb‐SCC mice.
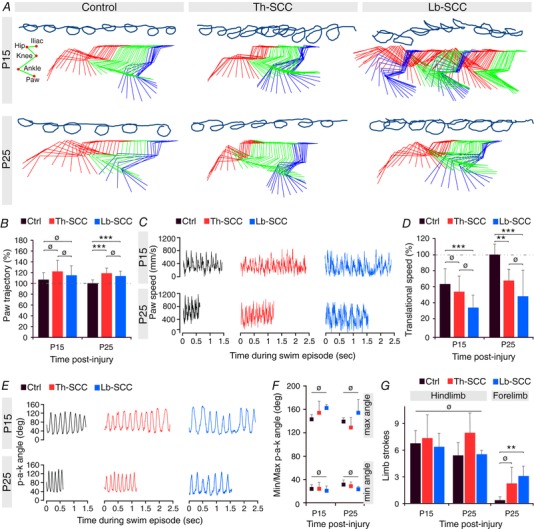
A, representative hindpaw trajectories and kinematics of the paw, ankle, knee, hip and iliac crest during linear swimming at P15 and P25 in injured and control mice. B, mean hindpaw trajectory expressed as percentage of age‐matched control mice. C, instantaneous variation of paw velocity. D, paw trajectory as percentage of age‐matched uninjured control mice. E, instantaneous variation of paw‐ankle‐knee angle. F, minimum and maximum paw‐ankle‐knee angles. G, number of limb strokes. Error bars represent SD. ** P < 0.025; *** P < 0.01; ø P > 0.05.
By contrast, at P15 both Th‐SCC (n = 4) and Lb‐SCC (n = 4) mice had less smooth and less circular hindlimb paw trajectories than the age‐matched uninjured control mice. This was particularly evident in the Lb‐SCC mice, which often exhibited strokes that were hardly more than a back‐and‐forth motion of the limb with little efficiency (Fig. 9 A). By P25, both injured groups had improved, with smoother and nearly normal hindlimb trajectories, higher paw speeds and greater rates of p‐a‐k angle change (Fig. 8 A–C and E). Despite developmental improvement, however, neither injured group attained translational speeds as high as the age‐matched uninjured control group (Fig. 9 D). Mean values for minimum and maximum p‐a‐k angle were not significantly different among the three groups (Fig. 9 F), nor were the number of hindlimb strokes per swim trial (Fig. 9 G). However, both Th‐SCC and Lb‐SCC mice more often used auxiliary forelimb strokes than age‐matched uninjured control mice (reaching statistical significance for Lb‐SCC mice; P < 0.025) (Fig. 9 G), suggesting a greater need to supplement hindlimb performance to maintain effective forward motion.
Taken together, these results indicate that although some deficits remain, recovery after a compression injury to the upper lumbar spinal cord continues into young adult life, is substantial and approaches normal locomotor function.
Discussion
The results we report here underscore the capacity for functional recovery in the neonatal rodent spinal cord. Most likely due to a convergence of multiple permissive factors, motor function begins to be reinstated within a few days despite an injury that permanently destroys spinal cord tissue in the most highly rhythmogenic region for lumbar locomotor output, including a decimation of neurons at the injury epicentre. Recovery continues over a few weeks to virtually restore normal function at the behavioural level, although some minor deficits can be revealed by detailed kinematic analysis. Here we have taken the analysis of locomotor recovery a step further by assessing the capacity of the lumbar‐injured spinal cord to generate fictive locomotion. We find that the ability to produce neurochemically induced fictive locomotion also recovers in parallel with the behavioural recovery, but is accompanied by altered features. These include a shift of the normal bimodal frequency profile to accentuate the higher frequency peak, and a change in neurochemical dependence. The latter involves both NMDA and serotonin dependence, and is almost certainly related to the destruction of many glutamatergic and serotonergic inputs and the significant sprouting of serotonergic fibres that subsequently occurs below the injury.
As an ancillary observation, we found that the swimming cycle frequency in uninjured P4 animals (about 2 Hz) is substantially higher (by about 5‐fold) than the higher cycle frequency mode exhibited by neurochemically induced fictive locomotion in uninjured spinal cords at P4 (about 0.4 Hz). This underscores the drawback of using fictive locomotion as a model for actual locomotion and the importance of sensory and descending inputs in regulating the output of the locomotor CPG even at early postnatal stages.
Slower recovery after lumbar than thoracic compression injury
We have reported previously that by 4 days after Th‐SCC in the neonatal mouse, behavioural recovery is evident and accompanied by re‐establishment of initially lost synaptic contacts onto MNs and a reorganization of vestibulospinal connections to lumbar medial and lateral motor columns (Boulland et al. 2013). Here we show that behavioural recovery is slower after lumbar injury relative to thoracic injury. The reasons for this are likely to be diverse. With respect to recovery of locomotion per se, we presume that a key difference lies in the neural elements that are directly damaged. The thoracic injuries (located in the T9–11 range) damage primarily descending and propriospinal tracts innervating the hindlimb locomotor CPG, whereas the lumbar injuries (located in the T13–L2 range) impact directly on the CPG itself. Moreover, the lumbar injuries were targeted to the rostral region of the lumbar enlargement, which is known to be more rhythmogenic than more caudal regions (reviewed by Kiehn, 2006, 2011; Rybak et al. 2015). It is thus remarkable that already at P4 Lb‐SCC mice exhibited rhythmic flexion/extension movements, albeit with low amplitude, and that they exhibited virtually complete behavioural recovery by P25. Exactly how the CPG circuitry is affected by the injury, and what compensatory changes underlie the recovery, remains to be determined (we provide some educated speculation below). In any case, the absence of fictive locomotion in isolated spinal cords 1 day after lumbar injury (at P2), and its substantial recovery by P4, indicate that the CPG is indeed initially compromised yet rapidly regains the capacity to generate appropriately patterned rhythmic output.
Several mechanisms probably contribute to this recovery, including a reorganization of synaptic connections within the CPG network, a stronger recruitment of redundant CPG circuit modules (given that the CPG network extends beyond the lesioned segment), and changes in the amount and distribution of neuromodulators (such as serotonin) and the number and distribution of their receptors. Serotonin receptors (5‐HTRs) are of particular interest here since they are known to mediate direct effects of serotonin on locomotion in rats (Liu & Jordan, 2005; Liu et al. 2009; Cabaj et al. 2017) and the amount and distribution of serotonergic terminals clearly change in the neonatal mouse as a consequence of injury. However, the injury evidently impacts on all neuron and axon types in the targeted segment, so there is likely to be a combination of neurotransmitter systems involved. In this regard, our finding here that NMDA becomes less potent in the presence of DA in inducing low frequency rhythmic activity after injury is relevant (see below).
Although Lb‐SCC mice do not recover as fast, they ultimately perform nearly as well as Th‐SCC mice. By contrast, adult rats exhibit chronic locomotor deficits following compression or excitotoxic injuries to the upper lumbar spinal cord (Magnuson et al. 1999, 2005; Collazos‐Castro et al. 2005). In one of these studies, injuries to mid‐thoracic and upper lumbar regions were directly compared. Adult rats showed pronounced recovery after a thoracic (T9) injury induced by injection of kainic acid, but no recovery when kainic acid was injected at L2 (Magnuson et al. 1999). Neurodegenerative sequelae following adult spinal cord injuries differ from those after neonatal injuries, primarily because the neonatal spinal cord has not yet developed myelin and perineuronal nets and largely lacks an inflammatory response (reviewed in Chawla et al. 2017). Moreover, kainic acid‐induced lesions differ from compression injuries in that they affect primarily the grey matter while sparing white matter to a greater extent. Loss of function following kainic acid injection in adult rats is moreover poorly correlated with motoneuron loss, suggesting that it is largely due to lesion of lumbar interneurons (Hadi et al. 2000). This supports the idea that an efficient treatment for lumbar spinal cord injury would need to target lumbar interneuronal networks in addition to descending fibres (van Gorp et al. 2013).
Change in the rhythm frequency profile of fictive locomotion following recovery from lumbar injury
Fictive locomotion can be triggered in the isolated spinal cord by electrical stimulation at various sites (brainstem, dorsal roots, sacral cord) or by exposure to neurochemicals. Several neurochemical cocktails have been used in earlier studies in mouse, differing in both composition and concentrations. Studies that have employed the NMDA/DA/5‐HT combination have reported two different patterns of activity in isolated neonatal rodent spinal cord preparations: (1) fictive locomotion, ranging from 0.15 to 0.4 Hz, with the most commonly reported frequency being about 0.2 Hz, and (2) slow locomotor‐like activity, at about 0.05 Hz (Zhong et al. 2007, 2011; Dougherty & Kiehn, 2010; Stil et al. 2011; Anderson et al. 2012; Griener et al. 2013; Milan et al. 2014).
Yet another study in neonatal rats reported that a cocktail containing only NMDA and DA elicited fictive locomotion or “slow locomotion‐like activity” in about half of the preparations and a slow rhythmic bursting that lacked the coordination pattern of fictive locomotion in the other half (Gozal et al. 2014). Thus, different frequencies and coordination patterns of rhythmic bursting can be obtained depending on the neurochemical cocktail used and the rodent species, and probably also strain.
Using the NMDA/DA/5‐HT cocktail, we have obtained similar results in uninjured control spinal cords relative to earlier reports, with fictive locomotion frequencies ranging from about 0.1 to 0.6 Hz and a bimodal frequency distribution with a major peak at about 0.2 Hz and a minor peak at double this frequency. Following recovery from a lumbar injury, the profile shifts towards the minor, higher frequency peak of 0.4 Hz. Many of the same mechanisms that we have noted above for explaining recovery of locomotion could contribute to this shift. Since we know that spinal circuitry is modified following neonatal spinal compression injuries (Boulland et al. 2013), mechanisms involving changes to synaptic connectivity are likely to play a role. Drawing from several findings, including an increase in the frequency of fictive locomotion with increasing concentrations of NMDA or d‐glutamate (Talpalar & Kiehn, 2010) and a decrease in frequency following selective vesicular glutamate transporter VGLUT2 inactivation and silencing of glutamate release from Hb9 interneurons (Caldeira et al. 2017), any change that biases towards an increase in the overall excitation of the CPG would also be expected to shift the CPG output towards the higher frequency range. In this regard, it is worth noting that large increases in extracellular excitatory amino acids can occur after spinal cord injury in adult rodents (Liu et al. 1991; Xu et al. 2004), and can persist for over a week, depending on injury severity (Panter et al. 1990). This increase is both focal and can involve more distant regions, possibly via a spreading mechanism involving activated glial cells (Hulsebosch, 2008). Thus, an injury‐induced increase in glutamate concentration might contribute to the shift towards the higher frequency mode even in the absence of connectivity changes.
Currently we have too little information about how the compression injuries we generate, which given their lateral approach are likely to impact non‐homogeneously on the spinal grey and white matter, affect the various identified spinal interneuron subpopulations. Such information should be attainable by generating injuries in relevant transgenic reporter mouse lines.
We note that the post‐injury frequency shift was much less pronounced for LL5 than the other ventral roots. The reason for this is unclear but it has previously been reported that the bursting frequency of LL5 is less variable than that of the other roots (Boothe et al. 2013; Hägglund et al. 2013). This suggests intriguingly that left extensors could function as a “frequency anchor” (perhaps related to the generation of asymmetric gaits), and that the CPG output module for these MNs is relatively immune to changes in lumbar circuitry that result from compression injuries.
Altered neurochemical dependence of hindlimb locomotor CPG output following Lb‐SCC
Serotonergic axons in the murine spinal cord originate from the raphe nuclei in the brainstem. They give off collaterals from cervical to lumbar segments that terminate in the dorsal horn, ventral horn and the intermediate grey (reviewed by Ghosh & Pearse, 2014). We and others have shown that after spinal cord injury there occurs a sprouting of surviving serotoninergic fibres that is viewed as an adaptive mechanism that facilitates motor output (this report and see references in Ghosh & Pearse, 2014). Indeed, several reports have shown that injection of serotonin or specific serotonin receptor agonists, either alone or combined with other manipulations such as epidural stimulation or injection of glutamate receptor agonists, contribute to the recovery of locomotion after spinal cord injury (Schmidt & Jordan, 2000; Antri et al. 2002; Landry et al. 2006; Courtine et al. 2009; Fouad et al. 2010; Sławińska et al. 2014). These results, however, have all been obtained in adult animal models in which the lumbar enlargement was intact. Our results suggest that sprouting of serotonergic axons may also be involved in the spontaneous recovery of locomotion following neonatal injuries to the lumbar cord and in particular to segments containing the locomotor CPG. We note that in the neonatal mouse sprouting of serotonergic axons is evident as early as 3 days post‐injury, which is temporally congruent with the ongoing behavioural recovery.
The post‐injury sprouting of serotonergic axons would suggest an increased availability of serotonin. It was therefore unexpected to find that neurochemically induced rhythmic output by the locomotor CPG had a greater dependence on serotonin after Lb‐SCC than in uninjured controls. We first demonstrated that rhythmic activity could be elicited in uninjured control spinal cords using NMDA (5–6 μm) and DA alone, as reported previously by Gozal et al. (2014) in the neonatal rat, and that addition of serotonin rapidly transformed this activity into bona fide fictive locomotion. Evidently, pattern generating elements of the CPG can drive coordinated rhythmic output at a low frequency in the absence of a strong serotonergic modulatory input (we cannot conclude that in the absence of exogenous serotonin there is no serotonin in the spinal cord), and that such serotonergic modulation augments the output substantially. By contrast, Lb‐SCC preparations rarely exhibited coordinated rhythmic activity in the absence of serotonin. It seems likely that this increased dependence on serotonin reflects post‐injury changes in the expression of 5‐HT receptors. This could involve various attributes including receptor down‐regulation (perhaps triggered by the increase in serotonergic innervation) or relative changes in the expression of receptor subtypes in specific target neurons. In the latter case, MNs and V2a spinal interneurons are likely candidates, since both are known to be sensitive to serotonin (Husch et al. 2015).
NMDA/DA alone triggers low frequency coordinated rhythmic activity
Neurochemically induced activity recorded from ex vivo preparations is subject to variation depending on the neurochemicals employed, their concentrations and durations of exposure, the composition of the physiological saline used as vehicle, and the genetic background and age of the animals. In our experiments, performed on P4 ICR mice, we find that low frequency coordinated rhythmic activity can be triggered reliably by NMDA/DA alone, yet others have reported otherwise. Jiang et al. (1999) reported the absence of rhythmic activity after bath application of NMDA/DA alone in the same concentrations we used (5/50 μm). However, they used a different strain of mice (Balb/C), and isolated spinal cord preparations at P5, which both we and others (Wilson et al. 2003) show are less capable of generating fictive locomotion than at P4 (due to greater anoxia within the core of the spinal cord). Jiang et al. (1999) also used lower concentrations of K+ (1.9–3.9 mm KCl), and it is not clear which particular concentration they used during exposure to NMDA/DA alone. We consistently used 4 mm, just above the high end of their range. This is a crucial point since rhythmic activity in CPG could be triggered by a suppression of delayed‐rectifier potassium current via increase of extracellular potassium (≥7 mm; Wallén et al. 1984; Marchetti et al. 2001) or by application of potassium channel blockers (4‐AP and TEA, see Taccola & Nistri, 2005, 2006). Although our results presented here were performed exclusively on ICR mice, we have observed the same reliable induction of low frequency coordinated rhythmic activity by NMDA/DA alone in P3 and P4 C57BL/6 mice (unpublished results, E. Kondratskaya, J. C. Glover and J.‐L. Boulland).
Relationship between fictive locomotion and actual locomotion
Fictive locomotion, irrespective of how it is induced, is generally believed to represent the basic pattern of activity that underlies locomotion in the intact animal, where importantly it can be modulated by descending and sensory inputs. The difference in the frequency range exhibited by neurochemical‐induced fictive locomotion in isolated neonatal mouse spinal cords (0.05–0.4 Hz, see references above) and in spinalized, curarized adult mouse preparations (about 1.5 Hz, Meehan et al. 2012), versus in intact adult mice (1–14 Hz, Bellardita & Kiehn, 2015) has been ascribed to the lack of such inputs in the isolated spinal cord. For early postnatal stages, there is very little information in the literature that directly relates fictive and actual locomotor frequencies, mainly because rodents at these stages have limited capacity to support their body weight, and thus cannot express terrestrial locomotion efficiently. Here, we have measured the frequency of swimming, in which the limbs are relieved of body weight support, and of neurochemical‐induced fictive locomotion, both at P4. We find that the frequency of swimming is substantially (about 5‐fold) higher than that of fictive locomotion.This underscores the importance, even at early postnatal stages, of inputs present in intact animals for regulating actual locomotor frequency. We note also that there is a developmental increase in swimming frequency from P4 to P25, indicating a maturation of these inputs during the first few weeks of life.
Perspectives
Locomotor circuitry is generally believed to be established through highly regulated mechanisms in which synaptic connections among specific neuron types form a network with interacting oscillatory, frequency‐setting and patterning elements. The circuit output is dynamically modifiable, permitting the production in limbed vertebrates, and especially mammals, of numerous locomotor patterns. Some of this modifiability lies in an apparently modular construction of the network, wherein specific patterns and frequency domains can be elicited by engaging specific subpopulations of interneurons. The destruction of part of this circuitry through injury raises the question of how plastic the network can be, and how extensive an injury it can accommodate. There is clearly much yet to be learned about why the neonatal spinal cord has such a high capacity for functional recovery. Our study provides a springboard for addressing underlying molecular and cellular mechanisms. It also provides a motivation to investigate the effects of larger lesions of the locomotor CPG, as well as more specific lesions, including genetically targeted lesions, in which identified interneuron types are damaged within a restricted region.
The spontaneous recovery of locomotion after lumbar injury in neonatal rodents also provides some hope that if repressive factors in the adult spinal cord could be removed, chronic lumbar injuries might be amenable to some form of functional restoration despite loss of neuronal elements at the injury site. Nevertheless, as is commonly accepted for spinal cord injury in general, potential treatment options are likely to require complex, combinatorial approaches. The changes in neurochemical dependence we have observed here underscore the importance of achieving an appropriate balance among multiple neurotransmitter systems to ensure a proper generation of coordinated locomotor activity. This balance will depend on the specific neuron populations affected by an injury and the degree to which synaptic connections are altered in type, number and strength. Additional studies need to focus on defining the parameter space within which neuropharmacological manipulation of well‐defined injuries is successful.
Additional information
Competing interests
The authors have no competing interests to declare.
Author contributions
Conception and design of the study was done by M.Z., E.K., J.C.G. and J.‐L.B. Acquisition and analysis was done by M.Z., E.K., C.B.S. and J.‐L.B. Drafting of the work was done by M.Z., E.K., J.C.G. and J.‐L.B. All authors approved the final revision of the manuscript and agreed to be accountable for all aspects of the work. All persons designated as authors qualify for authorship, and all those who qualify for authorship are listed. All experiments were performed in the Laboratory of Neural Development and Optical Recording (NDEVOR).
Funding
This work was supported by grants from the South‐Eastern Norway Regional Health Authority (J.‐L.B. and E.K., 2014119; J.C.G. and M.Z., 2012065) and the Norwegian Research Council (J.C.G., 189374/V40); C.B.S. was not supported by a grant.
Acknowledgements
We thank Vilde Aamodt Kveim for her assistance in behavioural analyses and Oleksandr Ievglevskyi for assistance in programming for analysis of electrophysiology traces. We would like also to express our gratitude to the anonymous reviewers of the originally submitted manuscript for their insightful and constructive comments, which helped us to improve the quality of the study.
Linked articles This article is highlighted by a Perspective by Schmidt. To read this Perspective, visit https://doi.org/10.1113/JP275488.
M. Züchner and E. Kondratskaya contributed equally to this work.
Edited by: Janet Taylor & Tadashi Isa
References
- Anderson TM, Abbinanti MD, Peck JH, Gilmour M, Brownstone RM & Masino MA (2012). Low‐threshold calcium currents contribute to locomotor‐like activity in neonatal mice. J Neurophysiol 107, 103–113. [DOI] [PMC free article] [PubMed] [Google Scholar]
- Antri M, Orsal D & Barthe J‐Y (2002). Locomotor recovery in the chronic spinal rat: effects of long‐term treatment with a 5‐HT2 agonist. Eur J Neurosci 16, 467–476. [DOI] [PubMed] [Google Scholar]
- Bellardita C & Kiehn O (2015). Phenotypic characterization of speed‐associated gait changes in mice reveals modular organization of locomotor networks. Curr Biol 25, 1426–1436. [DOI] [PMC free article] [PubMed] [Google Scholar]
- Boothe DL, Cohen AH & Troyer TW (2013). Phase locking asymmetries at flexor‐extensor transitions during fictive locomotion. PLoS One 8, e64421. [DOI] [PMC free article] [PubMed] [Google Scholar]
- Boulland J‐L, Lambert FM, Züchner M, Ström S & Glover JC (2013). A neonatal mouse spinal cord injury model for assessing post‐injury adaptive plasticity and human stem cell integration. PLoS One 8, e71701. [DOI] [PMC free article] [PubMed] [Google Scholar]
- Boulland J‐L, Leung DSY, Thuen M, Vik‐Mo E, Joel M, Perreault M‐C, Langmoen IA, Haraldseth O & Glover JC (2012). Evaluation of intracellular labeling with micron‐sized particles of iron oxide (MPIOs) as a general tool for in vitro and in vivo tracking of human stem and progenitor cells. Cell Transplant 21, 1743–1759. [DOI] [PubMed] [Google Scholar]
- Boulland J‐L, Qureshi T, Seal RP, Rafiki A, Gundersen V, Bergersen LH, Fremeau RT, Edwards RH, Storm‐Mathisen J & Chaudhry FA (2004). Expression of the vesicular glutamate transporters during development indicates the widespread corelease of multiple neurotransmitters. J Comp Neurol 480, 264–280. [DOI] [PubMed] [Google Scholar]
- Bouvier J, Caggiano V, Leiras R, Caldeira V, Bellardita C, Balueva K, Fuchs A & Kiehn O (2015). Descending command neurons in the brainstem that halt locomotion. Cell 163, 1191–1203. [DOI] [PMC free article] [PubMed] [Google Scholar]
- Bregman BS & Goldberger ME (1982). Anatomical plasticity and sparing of function after spinal cord damage in neonatal cats. Science 217, 553–555. [DOI] [PubMed] [Google Scholar]
- Cabaj AM, Majczyński H, Couto E, Gardiner PF, Stecina K, Sławińska U & Jordan LM (2017). Serotonin controls initiation of locomotion and afferent modulation of coordination via 5‐HT7 receptors in adult rats. J Physiol 595, 301–320. [DOI] [PMC free article] [PubMed] [Google Scholar]
- Caldeira V, Dougherty KJ, Borgius L & Kiehn O (2017). Spinal Hb9::Cre‐derived excitatory interneurons contribute to rhythm generation in the mouse. Sci Rep 7, 41369. [DOI] [PMC free article] [PubMed] [Google Scholar]
- Cazalets JR, Borde M & Clarac F (1995). Localization and organization of the central pattern generator for hindlimb locomotion in newborn rat. J Neurosci 15, 4943–4951. [DOI] [PMC free article] [PubMed] [Google Scholar]
- Chawla RS, Züchner M, Mastrangelopoulou M, Lambert FM, Glover JC & Boulland J‐L (2017). Cellular reactions and compensatory tissue re‐organization during spontaneous recovery after spinal cord injury in neonatal mice. Dev Neurobiol 77, 928–946. [DOI] [PubMed] [Google Scholar]
- Christie KJ & Whelan PJ (2005). Monoaminergic establishment of rostrocaudal gradients of rhythmicity in the neonatal mouse spinal cord. J Neurophysiol 94, 1554–1564. [DOI] [PubMed] [Google Scholar]
- Collazos‐Castro JE, Soto VM, Gutiérrez‐Dávila M & Nieto‐Sampedro M (2005). Motoneuron loss associated with chronic locomotion impairments after spinal cord contusion in the rat. J Neurotrauma 22, 544–558. [DOI] [PubMed] [Google Scholar]
- Courtine G, Gerasimenko Y, van den Brand R, Yew A, Musienko P, Zhong H, Song B, Ao Y, Ichiyama RM, Lavrov I, Roy RR, Sofroniew MV & Edgerton VR (2009). Transformation of nonfunctional spinal circuits into functional states after the loss of brain input. Nat Neurosci 12, 1333–1342. [DOI] [PMC free article] [PubMed] [Google Scholar]
- Cowley KC & Schmidt BJ (1997). Regional distribution of the locomotor pattern‐generating network in the neonatal rat spinal cord. J Neurophysiol 77, 247–259. [DOI] [PubMed] [Google Scholar]
- Dougherty KJ & Kiehn O (2010). Functional organization of V2a‐related locomotor circuits in the rodent spinal cord. Ann N Y Acad Sci 1198, 85–93. [DOI] [PubMed] [Google Scholar]
- Dunbar MJ, Tran MA & Whelan PJ (2010). Endogenous extracellular serotonin modulates the spinal locomotor network of the neonatal mouse. J Physiol 588, 139–156. [DOI] [PMC free article] [PubMed] [Google Scholar]
- Dyck J & Gosgnach S (2009). Whole cell recordings from visualized neurons in the inner laminae of the functionally intact spinal cord. J Neurophysiol 102, 590–597. [DOI] [PubMed] [Google Scholar]
- Fady JC, Jamon M & Clarac F (1998). Early olfactory‐induced rhythmic limb activity in the newborn rat. Brain Res Dev Brain Res 108, 111–123. [DOI] [PubMed] [Google Scholar]
- Fouad K, Rank MM, Vavrek R, Murray KC, Sanelli L & Bennett DJ (2010). Locomotion after spinal cord injury depends on constitutive activity in serotonin receptors. J Neurophysiol 104, 2975–2984. [DOI] [PMC free article] [PubMed] [Google Scholar]
- Ghosh M & Pearse DD (2014). The role of the serotonergic system in locomotor recovery after spinal cord injury. Front Neural Circuits 8, 151. [DOI] [PMC free article] [PubMed] [Google Scholar]
- Gordon IT, Dunbar MJ, Vanneste KJ & Whelan PJ (2008). Interaction between developing spinal locomotor networks in the neonatal mouse. J Neurophysiol 100, 117–128. [DOI] [PubMed] [Google Scholar]
- Gozal EA, O'Neill BE, Sawchuk MA, Zhu H, Halder M, Chou C‐C & Hochman S (2014). Anatomical and functional evidence for trace amines as unique modulators of locomotor function in the mammalian spinal cord. Front Neural Circuits 8, 134. [DOI] [PMC free article] [PubMed] [Google Scholar]
- Griener A, Dyck J & Gosgnach S (2013). Regional distribution of putative rhythm‐generating and pattern‐forming components of the mammalian locomotor CPG. Neuroscience 250, 644–650. [DOI] [PubMed] [Google Scholar]
- Hadi B, Zhang YP, Burke DA, Shields CB & Magnuson DS (2000). Lasting paraplegia caused by loss of lumbar spinal cord interneurons in rats: no direct correlation with motor neuron loss. J Neurosurg 93, 266–275. [DOI] [PubMed] [Google Scholar]
- Hägglund M, Dougherty KJ, Borgius L, Itohara S, Iwasato T & Kiehn O (2013). Optogenetic dissection reveals multiple rhythmogenic modules underlying locomotion. Proc Natl Acad Sci USA 110, 11589–11594. [DOI] [PMC free article] [PubMed] [Google Scholar]
- Hinckley C, Seebach B & Ziskind‐Conhaim L (2005). Distinct roles of glycinergic and GABAergic inhibition in coordinating locomotor‐like rhythms in the neonatal mouse spinal cord. Neuroscience 131, 745–758. [DOI] [PubMed] [Google Scholar]
- Hulsebosch CE (2008). Gliopathy ensures persistent inflammation and chronic pain after spinal cord injury. Exp Neurol 214, 6–9. [DOI] [PMC free article] [PubMed] [Google Scholar]
- Husch A, Dietz SB, Hong DN & Harris‐Warrick RM (2015). Adult spinal V2a interneurons show increased excitability and serotonin‐dependent bistability. J Neurophysiol 113, 1124–1134. [DOI] [PMC free article] [PubMed] [Google Scholar]
- Jiang Z, Carlin KP & Brownstone RM (1999). An in vitro functionally mature mouse spinal cord preparation for the study of spinal motor networks. Brain Res 816, 493–499. [DOI] [PubMed] [Google Scholar]
- Juvin L, Simmers J & Morin D (2007). Locomotor rhythmogenesis in the isolated rat spinal cord: a phase‐coupled set of symmetrical flexion extension oscillators. J Physiol 583, 115–128. [DOI] [PMC free article] [PubMed] [Google Scholar]
- Kiehn O (2006). Locomotor circuits in the mammalian spinal cord. Annu Rev Neurosci 29, 279–306. [DOI] [PubMed] [Google Scholar]
- Kiehn O (2011). Development and functional organization of spinal locomotor circuits. Curr Opin Neurobiol 21, 100–109. [DOI] [PubMed] [Google Scholar]
- Kiehn O & Kjaerulff O (1996). Spatiotemporal characteristics of 5‐HT and dopamine‐induced rhythmic hindlimb activity in the in vitro neonatal rat. J Neurophysiol 75, 1472–1482. [DOI] [PubMed] [Google Scholar]
- Kwan AC, Dietz SB, Zhong G, Harris‐Warrick RM & Webb WW (2010). Spatiotemporal dynamics of rhythmic spinal interneurons measured with two‐photon calcium imaging and coherence analysis. J Neurophysiol 104, 3323–3333. [DOI] [PMC free article] [PubMed] [Google Scholar]
- Landry ES, Rouillard C, Levesque D & Guertin PA (2006). Profile of immediate early gene expression in the lumbar spinal cord of low‐thoracic paraplegic mice. Behav Neurosci 120, 1384–1388. [DOI] [PubMed] [Google Scholar]
- Liu D, Thangnipon W & McAdoo DJ (1991). Excitatory amino acids rise to toxic levels upon impact injury to the rat spinal cord. Brain Res 547, 344–348. [DOI] [PubMed] [Google Scholar]
- Liu J, Akay T, Hedlund PB, Pearson KG & Jordan LM (2009). Spinal 5‐HT7 receptors are critical for alternating activity during locomotion: in vitro neonatal and in vivo adult studies using 5‐HT7 receptor knockout mice. J Neurophysiol 102, 337–348. [DOI] [PubMed] [Google Scholar]
- Liu J & Jordan LM (2005). Stimulation of the parapyramidal region of the neonatal rat brain stem produces locomotor‐like activity involving spinal 5‐HT7 and 5‐HT2A receptors. J Neurophysiol 94, 1392–1404. [DOI] [PubMed] [Google Scholar]
- Magnuson DS, Trinder TC, Zhang YP, Burke D, Morassutti DJ & Shields CB (1999). Comparing deficits following excitotoxic and contusion injuries in the thoracic and lumbar spinal cord of the adult rat. Exp Neurol 156, 191–204. [DOI] [PubMed] [Google Scholar]
- Magnuson DSK, Lovett R, Coffee C, Gray R, Han Y, Zhang YP & Burke DA (2005). Functional consequences of lumbar spinal cord contusion injuries in the adult rat. J Neurotrauma 22, 529–543. [DOI] [PubMed] [Google Scholar]
- Mandadi S, Leduc‐Pessah H, Hong P, Ejdrygiewicz J, Sharples SA, Trang T & Whelan PJ (2016). Modulatory and plastic effects of kinins on spinal cord networks. J Physiol 594, 1017–1036. [DOI] [PMC free article] [PubMed] [Google Scholar]
- Marchetti C, Beato M & Nistri A (2001). Evidence for increased extracellular K+ as an important mechanism for dorsal root induced alternating rhythmic activity in the neonatal rat spinal cord in vitro. Neurosci Lett 304, 77–80. [DOI] [PubMed] [Google Scholar]
- Meehan CF, Grondahl L, Nielsen JB & Hultborn H (2012). Fictive locomotion in the adult decerebrate and spinal mouse in vivo. J Physiol 590, 289–300. [DOI] [PMC free article] [PubMed] [Google Scholar]
- Milan L, Barrière G, De Deurwaerdère P, Cazalets J‐R & Bertrand SS (2014). Monoaminergic control of spinal locomotor networks in SOD1G93A newborn mice. Front Neural Circuits 8, 77. [DOI] [PMC free article] [PubMed] [Google Scholar]
- Noor NM, Møllgård K, Wheaton BJ, Steer DL, Truettner JS, Dziegielewska KM, Dietrich WD, Smith AI & Saunders NR (2013). Expression and cellular distribution of ubiquitin in response to injury in the developing spinal cord of Monodelphis domestica . PLoS One 8, e62120. [DOI] [PMC free article] [PubMed] [Google Scholar]
- Panter SS, Yum SW & Faden AI (1990). Alteration in extracellular amino acids after traumatic spinal cord injury. Ann Neurol 27, 96–99. [DOI] [PubMed] [Google Scholar]
- Rasband WS (1997). ImageJ. National Institutes of Health, Bethesda, MD, USA. [Google Scholar]
- Rybak IA, Dougherty KJ & Shevtsova NA (2015). Organization of the mammalian locomotor CPG: Review of computational model and circuit architectures based on genetically identified spinal interneurons(1,2,3). eNeuro 2; https://doi.org/10.1523/ENEURO.0069-15.2015. [DOI] [PMC free article] [PubMed] [Google Scholar]
- Saunders NR, Deal A, Knott GW, Varga ZM & Nicholls JG (1995). Repair and recovery following spinal cord injury in a neonatal marsupial (Monodelphis domestica). Clin Exp Pharmacol Physiol 22, 518–526. [DOI] [PubMed] [Google Scholar]
- Saunders NR, Kitchener P, Knott GW, Nicholls JG, Potter A & Smith TJ (1998). Development of walking, swimming and neuronal connections after complete spinal cord transection in the neonatal opossum, Monodelphis domestica . J Neurosci 18, 339–355. [DOI] [PMC free article] [PubMed] [Google Scholar]
- Schmidt BJ & Jordan LM (2000). The role of serotonin in reflex modulation and locomotor rhythm production in the mammalian spinal cord. Brain Res Bull 53, 689–710. [DOI] [PubMed] [Google Scholar]
- Singh A, Tetreault L, Kalsi‐Ryan S, Nouri A & Fehlings MG (2014). Global prevalence and incidence of traumatic spinal cord injury. Clin Epidemiol 6, 309–331. [DOI] [PMC free article] [PubMed] [Google Scholar]
- Sławińska U, Miazga K & Jordan LM (2014). 5‐HT₂ and 5‐HT₇ receptor agonists facilitate plantar stepping in chronic spinal rats through actions on different populations of spinal neurons. Front Neural Circuits 8, 95. [DOI] [PMC free article] [PubMed] [Google Scholar]
- Stelzner DJ, Ershler WB & Weber ED (1975). Effects of spinal transection in neonatal and weanling rats: survival of function. Exp Neurol 46, 156–177. [DOI] [PubMed] [Google Scholar]
- Stil A, Jean‐Xavier C, Liabeuf S, Brocard C, Delpire E, Vinay L & Viemari J‐C (2011). Contribution of the potassium‐chloride co‐transporter KCC2 to the modulation of lumbar spinal networks in mice. Eur J Neurosci 33, 1212–1222. [DOI] [PubMed] [Google Scholar]
- Taccola G & Nistri A (2005). Electrophysiological effects of 4‐aminopyridine on fictive locomotor activity of the rat spinal cord in vitro. Acta Neurochir Suppl 93, 151–154. [DOI] [PubMed] [Google Scholar]
- Taccola G & Nistri A (2006). Fictive locomotor patterns generated by tetraethylammonium application to the neonatal rat spinal cord in vitro. Neuroscience 137, 659–670. [DOI] [PubMed] [Google Scholar]
- Talpalar AE & Kiehn O (2010). Glutamatergic mechanisms for speed control and network operation in the rodent locomotor CpG. Front Neural Circuits 4; https://doi.org/10.3389/fncir.2010.00019. [DOI] [PMC free article] [PubMed] [Google Scholar]
- Tillakaratne NJK, Guu JJ, de Leon RD, Bigbee AJ, London NJ, Zhong H, Ziegler MD, Joynes RL, Roy RR & Edgerton VR (2010). Functional recovery of stepping in rats after a complete neonatal spinal cord transection is not due to regrowth across the lesion site. Neuroscience 166, 23–33. [DOI] [PMC free article] [PubMed] [Google Scholar]
- van Gorp S, Leerink M, Kakinohana O, Platoshyn O, Santucci C, Galik J, Joosten EA, Hruska‐Plochan M, Goldberg D, Marsala S, Johe K, Ciacci JD & Marsala M (2013). Amelioration of motor/sensory dysfunction and spasticity in a rat model of acute lumbar spinal cord injury by human neural stem cell transplantation. Stem Cell Res Ther 4, 57. [DOI] [PMC free article] [PubMed] [Google Scholar]
- Wallén P, Grafe P & Grillner S (1984). Phasic variations of extracellular potassium during fictive swimming in the lamprey spinal cord in vitro. Acta Physiol Scand 120, 457–463. [DOI] [PubMed] [Google Scholar]
- Wheaton BJ, Callaway JK, Ek CJ, Dziegielewska KM & Saunders NR (2011). Spontaneous development of full weight‐supported stepping after complete spinal cord transection in the neonatal opossum, Monodelphis domestica . PLoS One 6, e26826. [DOI] [PMC free article] [PubMed] [Google Scholar]
- Whelan P, Bonnot A & O'Donovan MJ (2000). Properties of rhythmic activity generated by the isolated spinal cord of the neonatal mouse. J Neurophysiol 84, 2821–2833. [DOI] [PubMed] [Google Scholar]
- Wilson RJA, Chersa T & Whelan PJ (2003). Tissue PO2 and the effects of hypoxia on the generation of locomotor‐like activity in the in vitro spinal cord of the neonatal mouse. Neuroscience 117, 183–196. [DOI] [PubMed] [Google Scholar]
- Xu G‐Y, Hughes MG, Ye Z, Hulsebosch CE & McAdoo DJ (2004). Concentrations of glutamate released following spinal cord injury kill oligodendrocytes in the spinal cord. Exp Neurol 187, 329–336. [DOI] [PubMed] [Google Scholar]
- Z'Graggen WJ, Fouad K, Raineteau O, Metz GA, Schwab ME & Kartje GL (2000). Compensatory sprouting and impulse rerouting after unilateral pyramidal tract lesion in neonatal rats. J Neurosci 20, 6561–6569. [DOI] [PMC free article] [PubMed] [Google Scholar]
- Zhong G, Masino MA & Harris‐Warrick RM (2007). Persistent sodium currents participate in fictive locomotion generation in neonatal mouse spinal cord. J Neurosci 27, 4507–4518. [DOI] [PMC free article] [PubMed] [Google Scholar]
- Zhong G, Sharma K & Harris‐Warrick RM (2011). Frequency‐dependent recruitment of V2a interneurons during fictive locomotion in the mouse spinal cord. Nat Commun 2, 274. [DOI] [PMC free article] [PubMed] [Google Scholar]
- Zhong G, Shevtsova NA, Rybak IA & Harris‐Warrick RM (2012). Neuronal activity in the isolated mouse spinal cord during spontaneous deletions in fictive locomotion: insights into locomotor central pattern generator organization. J Physiol 590, 4735–4759. [DOI] [PMC free article] [PubMed] [Google Scholar]
- Züchner M, Glover JC & Boulland J‐L (2016). A neonatal mouse spinal cord compression injury model. J Vis Exp e53498. [DOI] [PMC free article] [PubMed] [Google Scholar]