

Abstract
Objective
To extend previous work and estimate health and social care costs, litigation costs, funeral‐related costs, and productivity losses associated with stillbirth in the UK.
Design
A population‐based cost‐of‐illness study using a synthesis of secondary data.
Setting
The National Health Service (NHS) and wider society in the UK.
Population
Stillbirths occurring within a 12‐month period and subsequent events occurring over the following 2 years.
Methods
Costs were estimated using published data on events, resource use, and unit costs.
Main outcome measures
Mean health and social care costs, litigation costs, funeral‐related costs, and productivity costs for 2 years, reported for a single stillbirth and at a national level.
Results
Mean health and social care costs per stillbirth were £4191. Additionally, funeral‐related costs were £559, and workplace absence (parents and healthcare professionals) was estimated to cost £3829 per stillbirth. For the UK, the annual health and social care costs were estimated at £13.6 million, and total productivity losses amounted to £706.1 million (98% of this cost was attributable to the loss of the life of the baby). The figures for total productivity losses were sensitive to the perspective adopted about the loss of life of the baby.
Conclusion
This work expands the current intelligence on the costs of stillbirth beyond the health service to costs for parents and society, and yet these additional findings must still be regarded as conservative estimates of the true economic costs.
Tweetable abstract
The costs of stillbirth are significant, affecting the health service, parents, professionals, and society.
Plain Language Summary
Why and how was the study carried out?
The personal, social, and emotional consequences of stillbirth are profound. Placing a monetary value on such consequences is emotive, yet necessary, when deciding how best to invest limited healthcare resources. We estimated the average costs associated with a single stillbirth and the costs for all stillbirths occurring in the UK over a 1‐year period.
What were the main findings?
The average cost to the National Health Service (NHS) of care related to the stillbirth and a first subsequent pregnancy was £4191 for each stillbirth. For the UK, this cost was £13.6 million annually. Clinical negligence payments to bereaved parents were estimated at £2.5 million per year. Parents were estimated to spend £1.8 million per year on funerals. The cost of workplace absence as parents cope with the effects of grief was estimated at £2476 per stillbirth. For the UK, this cost was £8.1 million annually. The loss of a baby is also the loss of an individual with the potential to become a valued and productive member of society. The expected value of an adult's lifetime working hours was taken as an estimate of this productivity loss, and was £213,304 for each stillbirth. The annual cost for all stillbirths was £694 million. We know from parents that the birth of a subsequent child in no way replaces a stillborn baby. We found that 52% of women fall pregnant within 12 months of a stillbirth. From a purely economic perspective concerned only with the number of individuals in society, babies born during this period could potentially replace the productivity losses of the stillborn baby. Adopting this approach, which we understand is controversial and difficult for bereaved parents, the expected productivity losses would be lower, at £333 million.
What are the limitations of the work?
For some categories, existing data were unavailable and we used clinical opinion to estimate costs. Furthermore, we were unable to quantify some indirect consequences, for example the psychological distress experienced by wider family members.
What is the implication for parents?
Placing a monetary value on what is for parents a profound personal tragedy may seem unkind. It is, however, unavoidable if we are to provide policy makers with vital information on the wide‐ranging consequences that could be prevented through future investments in initiatives to reduce stillbirth.
Keywords: Costs, funeral, health care, productivity, resource use, societal, stillbirth
Tweetable abstract
The costs of stillbirth are significant, affecting the health service, parents, professionals, and society.
Introduction
In 2014 there were 3252 stillbirths in the UK, and at 1.4% per 1000 births, the annual rate of reduction of stillbirth remains slower than in neighbouring countries, including the Netherlands (6.8% per 1000 births) and the Republic of Ireland (3.5% per 1000 births).1 Although stillbirth poses a substantial emotional and financial burden for women, families, healthcare professionals, and wider society, no comprehensive cost estimates have been derived to date. A recent UK‐based study conducted a preliminary exploration of the healthcare costs associated with stillbirth.2 The authors acknowledged that other costs had not been accounted for, but their initial assessment was restricted to a health service perspective. The lack of accurate data regarding the costs of stillbirth impedes the economic analysis of efforts to prevent stillbirth.
The impact of stillbirth is more wide reaching than the healthcare sector, and includes: the immediate effects of grief on the mental health and psychological wellbeing of the bereaved parents, and wider family members; the effects on the medical staff involved and their ability to work; and the longer‐term effects of parental bereavement, which can result in anxiety and/or depression and post‐traumatic stress disorder (PTSD). These have the potential to affect the parents' ability to care for existing and subsequent children, and their ability to work, which can result in family debt, leading in some cases, to homelessness and family break‐up.3 An additional cost rarely considered is that although the loss of a baby is a profoundly sad personal tragedy, it also represents the loss to society of a potential economically productive member. These wider, indirect, societal costs are much harder to quantify.3 The recent 2016 Ending Preventable Stillbirths Lancet series identified that the scarcity of data about the psychological effects and social care costs, in particular for fathers, wider family, and healthcare professionals, has prevented accurate figures of the economic costs of stillbirth.4 As a result, the economic impact of stillbirth remains an under‐researched area.4
Our aim was to expand the work started by Mistry and colleagues and conduct a ‘cost of illness study’ capturing the societal costs associated with stillbirth in the UK using secondary analyses of currently available evidence.
Methods
The study used a prevalence‐based cohort approach in which costs associated with a cohort of stillbirths during a 12‐month period in the UK were estimated for up to 2 years after the stillbirth. Costs represented additional resources consumed compared with a live birth: this reflects de novo costs for some categories of resource use or additional costs (or savings) compared with a live birth. Costs following a single stillbirth were estimated by applying unit costs to resource‐use estimates identified from secondary sources. Costs were scaled up to a national level using information about the total number of stillbirths in the UK in 2014.5
The following costs were estimated: health and social care, funeral‐related, litigation, and productivity costs, and were expressed in 2013/14 UK pounds. Detailed information on the costing methodology is provided in Appendix S1, with abridged detail presented below. Unit costs are listed in Table S1 in Appendix S1.
Costing health and social care
Health and social care costs were estimated for seven ordered phases, derived to include events with known resource consequences (Figure 1). Column 1 of Table 1 details the care in phases relating to the pregnancy affected by the stillbirth (phases 1–4), with columns 2 and 4 showing the associated probability of receiving that care and its unit cost, respectively. Table 2 shows the same information for a subsequent pregnancy (phases 5–7).
Figure 1.
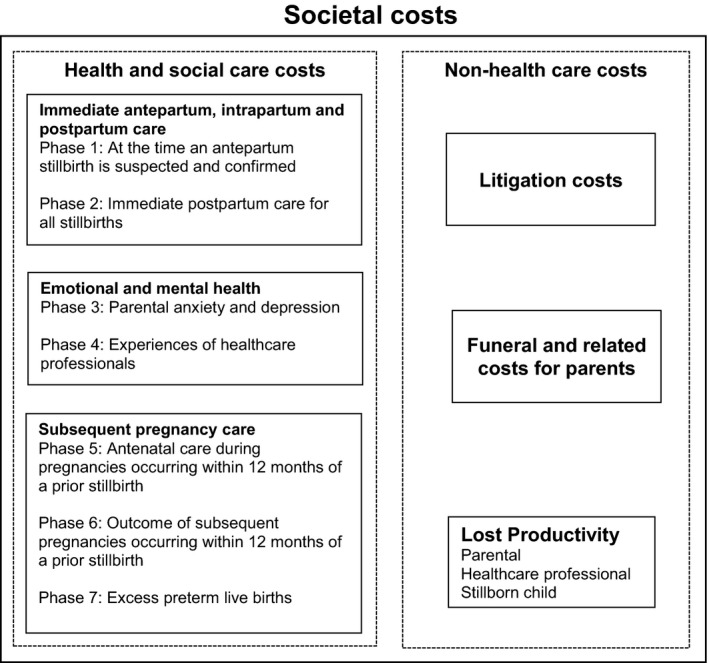
Categories of costs associated with stillbirth and included in the cost‐of‐illness analysis.
Table 1.
Resource use, unit costs, and mean costs for health and social care provided in relation to stillbirth
| Phase, events, resources | Proportion of all parents with event/mean duration of event | Source of proportion/resource use estimates | Unit costa | Mean cost per stillbirthb |
|---|---|---|---|---|
| Phase 1: care provided at the time an antepartum stillbirth is suspected and confirmed (proportion) | 0.880 | 5,6 | £244c | £215 |
| Phase 1: mean total cost per stillbirth | £215 | |||
| Phase 2: immediate postpartum care | ||||
| Difference in post‐delivery hospital length of stay between live birth and stillbirth (mean days) | −0.426 | 6,7 | £408 | −£174 |
| Postmortem | ||||
| Full postmortem & placental pathology (proportion) | 0.421 | 9 | £980 | £412 |
| Partial postmortem & placental pathology (proportion) | 0.030 | 9 | £580 | £17 |
| Placental pathology only (proportion) | 0.421 | 9 | £130 | £55 |
| None/not known (proportion) | 0.128 | 9 | £0 | £0 |
| Other investigations (proportion) | Variousd | 8 | Variousd | £440 |
| Meeting with consultant to discuss case/postmortem results (proportion) | 0.919 | 8 | £152 | £139 |
| Initial follow‐up care after hospital discharge | ||||
| Difference in midwife home visits between live birth and stillbirth (mean no.) | −0.224e | 6,44,45 | £68 | −£15 |
| Difference in maternity support worker visits between live birth and stillbirth (mean no.) | −0.227e | 6,44,45 | £20 | −£5 |
| Difference in general practitioner contacts between live birth and stillbirth (mean no.) | −0.040e | 6,47 | Variousf | £21 |
| Difference in health visitor contacts between live birth and stillbirth (mean no.) | −1.681e | 6,48 | £53 | −£90 |
| Phase 2: mean total cost per stillbirth | – | – | £802 | |
| Phase 3: parental anxiety and depression | ||||
| Additional treated maternal anxiety following a stillbirth (proportion) | 0.105g | 6,10,11 | £1146 | £121 |
| Additional treated maternal depression following a stillbirth (proportion) | 0.105g | 6,10,11 | £2231 | £235 |
| Additional treated paternal anxiety following a stillbirth (proportion) | 0.039g | 6,1,011 | £1447 | £56 |
| Additional treated paternal depression following a stillbirth (proportion) | 0.061g | 6,11,12 | £2231 | £137 |
| Phase 3: mean total cost per stillbirth | £549 | |||
| Phase 4: experiences of healthcare professionals | ||||
| Midwives treated for post‐traumatic stress after managing a stillbirth (proportion) | 0.214h | 11,14 | £1688i | £361 |
| Obstetricians treated for depression after managing a stillbirth (proportion) | 0.109h | 11,13 | £2231 | £243 |
| Phase 4: mean total cost per stillbirth | £604 | |||
Unit costs used and their sources are shown in Table S1 in Appendix S1, unless otherwise indicated.
Unit cost multiplied by proportion of patients with event/mean duration of event.
Unit cost estimation described in Table S2 in Appendix S1.
Proportions and unit cost estimation described in Table S3 in Appendix S1.
Estimation of mean visits is described in Table S4 in Appendix S1.
General practitioner contacts assumed to be surgery based following a live birth (the 6‐week check) and home based following a stillbirth. For the associated unit costs, see Table S1 in Appendix S1.
Proportion estimations are described in Table S5 in Appendix S1.
Proportion estimations are described in Table S6 in Appendix S1.
In the absence of a cost for post‐traumatic stress, the unit cost used is an average of the cost for anxiety (£1146) and for depression (£2231).
Table 2.
Resource use, unit costs, and mean costs for health and social care provided during a subsequent pregnancy
| Phase, events, resources | Proportion of all parents with event/Mean duration of event | Source of proportion/resource use estimates | Unit costa | Mean cost per stillbirthb |
|---|---|---|---|---|
| Phase 5: preconception and antenatal care during pregnancies occurring within 12 months of a stillbirth (proportion) | 0.517 | 15 | Variousc | £795 |
| Phase 5: mean total cost per stillbirth | £795 | |||
| Phase 6: outcome of subsequent pregnancies occurring within 12 months of a prior stillbirth | ||||
| Miscarriage before 24 weeks of gestation (proportion) | 0.103d | 15,17 | £0 | £0 |
| Live birth, normal delivery (proportion) | 0.138d | 15,16,17,18 | £1767 | £244 |
| Live birth, instrumental delivery (proportion) | 0.053d | 15,16,17,18 | £2607 | £139 |
| Live birth, elective caesarean section (proportion) | 0.079d | 15,16,17,18 | £3094 | £245 |
| Live birth, emergency caesarean section (proportion) | 0.135d | 15,16,17,18 | £3934 | £530 |
| Second stillbirth (proportion) | 0.008d | 15,16,17 | £1017 | £8 |
| Phase 6: mean total cost per stillbirth | £1167 | |||
| Phase 7: excess preterm live births | ||||
| Additional preterm live births | 0.003e | 15,16,17,20 | £22,769 | £60 |
| Phase 7: mean total cost per stillbirth | £60 | |||
Unit costs used are shown in Table S1 in Appendix S1, unless otherwise indicated.
Unit cost multiplied by proportion of patients with event/mean duration of event.
For additional details, see Tables S1, S7, and S8 in Appendix S1.
The proportion shown is a product of several individual proportions, as detailed in Table S9 in Appendix S1.
The proportion shown is a difference between two proportions, which were calculated as the products of a number of individual proportions; see Table S10 in Appendix S1.
Phase 1: care provided at the time that an antepartum stillbirth is suspected and confirmed
About 90% of stillbirths in England occur in the antepartum period.5 Care provided at this point was costed using data on healthcare contacts and investigations reported by bereaved parents in the ‘Listening to Parents’ (LTP) survey (Table S2 in Appendix S1).6 For stillbirths occurring during labour, care provided up until the tragedy was assumed to be the same as for a live birth, and no additional costs were included as part of phase 1.
Phase 2: immediate postpartum care
Women were assumed to stay in hospital on average 0.43 fewer days than women having a live birth (Table 1; Section 3.1.2, Appendix S1).6, 7 The types of postmortem conducted were costed, as were other routine post‐stillbirth investigations (Table 1 and Table S3 in Appendix S1).2, 8, 9
The LTP survey provided information on the proportion of parents meeting with a consultant, and the mean number of visits from various healthcare professionals in the 3 months following hospital discharge.6 When costing, adjustments were made for contacts that women would have received had they had a live birth (Table 1 and Table S4 in Appendix S1).
Phase 3: parental anxiety and depression
The additional proportions of women experiencing symptoms of anxiety and depression as a result of a stillbirth were estimated.6, 10 The proportion then likely to receive care was estimated, and a treatment duration of 12 months was assumed and costed (Table 1).11 The prevalence and cost of paternal anxiety and depression was estimated using the same approach (Table S5 in Appendix S1).6, 12
Phase 4: experiences of healthcare professionals
Published data revealed that 33% of midwives involved in the care of families experiencing perinatal tragedies had symptoms of post‐traumatic stress, and around 17% of obstetricians reported ‘very much’ experiencing depression.13, 14 The proportion of these professionals likely to have received treatment was estimated and appropriate unit costs were assigned (Table 1 and Table S6 in Appendix S1).
Phase 5: pre‐conception and antenatal care during a subsequent pregnancy within 12 months of the stillbirth
Following a stillbirth, around 52% of women become pregnant again within 12 months.15 It was assumed that prospective parents plan for a specific family size and therefore the costs of monitoring and delivering these pregnancies were included. Costs were assumed to include tailored pre‐conception and antenatal care (clinic visits and ultrasound scans; Table 2, Tables S7 and S8 in Appendix S1).2, 9, 16, 17
Phase 6: outcome of subsequent pregnancies occurring within 12 months of a prior stillbirth
The proportions of women with a subsequent pregnancy within 12 months and having a live birth delivery were estimated and costed (Table 2 and Table S9 in Appendix S1).7, 16, 17, 18 Sadly, around 2% of women experience a second stillbirth, and care was costed as described in phases 1 and 2 above.16
Phase 7: excess preterm births
Following stillbirth the risk of a subsequent preterm live birth is increased.16, 19 Published data were used to estimate the proportion of pregnancies ending in a live preterm birth in the general population, and the proportion ending in a live preterm birth in women conceiving within 12 months of a stillbirth (Table S10, Appendix S1).15, 16, 20 The difference between these proportions (Table 2) was multiplied by the additional costs associated with preterm birth (Table S1 in Appendix S1).19
NHS litigation costs
The NHS Litigation Authority data showed that between 2000 and 2010, litigation costs relating to stillbirth made up, on average, around 0.5% of all NHS maternity litigation costs in England.21 This proportion was assumed to remain constant and was applied to the total litigation payment figure for obstetrics in England in 2013/14 (£398,614,623).22 The resulting estimated stillbirth‐related litigation cost was then divided by the total number of registered stillbirths in England during 2014 to estimate a mean cost of litigation per stillbirth.
Funeral and related costs
Responses to the International Stillbirth Alliance survey from a subset of UK parents were used to identify the proportions incurring costs relating to the funeral service, and the burial or cremation of their baby.4 Data were also analysed for the proportion purchasing memorials or headstones and other funeral‐related items. Proportions were multiplied by the appropriate unit costs (Table S11 in Appendix S1).23, 24
Productivity costs
Productivity costs associated with stillbirth included the cost of absence from the workplace by grieving parents and healthcare professionals, and the cost of the lost opportunity for the stillborn baby to reach adulthood, gain employment, and contribute to the nation's productivity over a lifetime.
Parental productivity costs
It was assumed that parental absence from the workplace resulted in lost productivity only for the 64% of stillbirths occurring before 37 weeks of gestation.5 For these stillbirths, the mean duration of paternal compassionate leave was costed using male mean gross wage rates,6, 25 and for mothers, the expected number of working days lost from the time of the stillbirth up to 37 weeks of gestation was calculated and costed using female mean gross wage rates.5, 25 Each of these costs were multiplied by an age‐ and sex‐specific likelihood of being in paid employment (Table S12 in Appendix S1).26, 27
Healthcare professional productivity costs
Managing a stillbirth is one of the most difficult experiences for healthcare professionals.28 Published data show that 12% of midwives involved in traumatic perinatal events were consequently absent from the workplace.14 An absence of 1 month was assumed and costed using a midwife salary.29 Around one‐fifth of midwives also reported reducing their working shifts in the short term.14 Full‐time hours were assumed to be reduced to half‐time hours for a period of 1 month, and this absence was costed.29
In the absence of data for obstetricians, the relative risks of workplace absence and reduced working hours in midwives reporting PTSD symptoms were calculated and assumed to apply to the 17% of obstetricians reporting feeling ‘very much’ depressed (Section 3.4, Appendix S1).13
Productivity losses from the loss of the baby's life
A stillbirth can be considered a loss to society, as the stillborn baby represents a lost future adult who would have contributed to a nation's productivity over its lifetime.30 When calculating this cost, the greater risk of preterm birth in this cohort had they not been stillborn was acknowledged, together with evidence to show that preterm birth impacts negatively upon an individual's future earnings.31, 32, 33 The cost of lost productivity was estimated separately for males and females by calculating working life years lost, and estimating for each year lost the probability that the individual would have been in full‐ or part‐time paid employment.25, 26, 27 Estimated gender‐specific mean gross salary costs for adults born full term and preterm were multiplied by the number of working years lost to estimate total productivity losses for each gender/term group (Tables S13 and S14 in Appendix S1).25 Gender proportions for stillborn babies were then used to estimate a weighted total average of productivity costs for each term group, and then these costs were weighted by estimated proportions of births likely to be preterm and full term to give an overall productivity loss.9 As these costs would be incurred in the future, a discount rate of 3.5% was used.34
Statistical and sensitivity analysis
The costing exercise was conducted in Microsoft excel 2013. Mean total health and social care costs per stillbirth were estimated by summing the costs for phases 1–7. Mean total productivity costs per stillbirth were estimated by summing the three productivity cost groups.
We categorised the source information for each parameter into one of a number of categories, following a convention used elsewhere.35, 36 Classifications reflected the most to least preferential input sources (labelled A–H), and the categorisation for each input parameter is listed in Table S15 in Appendix S1. Parameters classified as D–H were subjected to one‐way sensitivity analyses in which their base‐case estimates were increased and decreased by 25%.
Two additional scenario analyses were performed. In the first, we considered that parents might not plan ahead for a specific family size, and so in the 12 months following the stillbirth only the costs of additional pregnancies (additional when compared with those that would have been expected within 12 months of a prior live birth) were considered (Section 4.1, Appendix S1). In the second analysis, it was assumed that the 52% of women falling pregnant within 12 months of a stillbirth would go on to have a live birth, and so from a purely economic perspective productivity losses of the stillborn child would decrease by this proportion.
Results
Health and social care costs
Table 1 shows the mean cost of investigating and confirming antepartum stillbirth was £215 per death, and costs incurred immediately following a stillbirth were £802 per death. The cost of treating symptoms of parental anxiety and depression was estimated at £549 per death, and treatment of healthcare professionals experiencing mental health problems was estimated to be £604 per death.
Table 2 shows estimated costs associated with a subsequent pregnancy within 12 months of a stillbirth (phases 5–7). Pre‐conception and antenatal care was estimated to cost £795 for each previous stillbirth, with the mean cost of providing care at the final outcome of the pregnancy calculated for each previous stillbirth as £1167. The increased risk of preterm birth was estimated to cost £60 for each previous stillbirth.
The total health and social care costs were estimated to be £4191 for each stillbirth (Table 3), almost half of which was attributable to care relating to a subsequent pregnancy within 12 months of a stillbirth, and a quarter was attributable to care provided at the time of, or immediately after, the stillbirth.
Table 3.
Mean health and social care, litigation, funeral, and productivity costs per stillbirth, and total costs by country
| Mean cost per stillbirth | Stillbirths in 2014 and the total costs of stillbirth in 2013/14 thousand pounds sterling, by country | ||||||
|---|---|---|---|---|---|---|---|
| – | England | Wales | Scotland | Northern Ireland | Crown dependencies | UK | |
| Number of stillbirths in 2014 | |||||||
| Antepartum stillbirths | – | 2559 | 136 | 192 | 87 | 3 | 2977 |
| Intrapartum stillbirths | – | 230 | 23 | 17 | 5 | 0 | 275 |
| Total stillbirths | – | 2789 | 159 | 209 | 92 | 3 | 3252 |
| Health and social care costs | |||||||
| Phase 1: care provided when an antepartum stillbirth is suspected and confirmed | £215 | £600 | £34 | £45 | £20 | £1 | £700 |
| Phase 2: immediate postpartum care for all parents experiencing a stillbirth | £802 | £2237 | £128 | £168 | £74 | £2 | £2608 |
| Phase 3: parental anxiety and depression | £549 | £1530 | £87 | £115 | £50 | £2 | £1784 |
| Phase 4: experiences of healthcare professionals | £604 | £1685 | £96 | £126 | £56 | £2 | £1965 |
| Phase 5: antenatal care for pregnancies occurring within 12 months of a prior stillbirth | £795 | £2217 | £126 | £166 | £73 | £2 | £2585 |
| Phase 6: outcome of pregnancies occurring within 12 months of a prior stillbirth | £1167 | £3254 | £186 | £244 | £107 | £4 | £3794 |
| Phase 7: excess preterm live births | £60 | £167 | £10 | £13 | £6 | £0 | £195 |
| Total health and social care costs | £4191 | £11,690 | £666 | £876 | £386 | £13 | £13,630 |
| Litigation costs | £778 | £2169 | £124 | £163 | £72 | £2 | £2529 |
| Funeral and related costs for parents | £559 | £1559 | £89 | £117 | £51 | £2 | £1817 |
| Productivity costs | |||||||
| Parental productivity losses | £2476 | £6905 | £394 | £517 | £228 | £7 | £8051 |
| Health professional productivity losses | £1353 | £3774 | £215 | £283 | £124 | £4 | £4400 |
| Productivity losses of the potential child/adult | £213,304 | £594,904 | £33,915 | £44,580 | £19,624 | £640 | £693,664 |
| Cost of total productivity losses | £217,133 | £605,583 | £34,524 | £45,381 | £19,976 | £651 | £706,115 |
| Total costs | £222,660 | £621,000 | £35,403 | £46,536 | £20,485 | £668 | £724,092 |
Litigation costs
The mean litigation cost for each stillbirth was £778.
Funeral and related costs
Funeral and related costs for each stillbirth were estimated to be £559, as shown in Table 3.
Productivity costs
Table 3 summarises the productivity cost estimates. Overall, total productivity losses per stillbirth were estimated to be £217,133, with the lost productivity of the stillborn child accounting for around 98% of these costs (£213,304).
National cost estimates for the UK
In 2014, there were 3252 stillbirths in the UK.5 Multiplying the mean total health and social care cost by this figure generated a national cost estimate of £13.6 million. For UK parents, funeral‐related expenses amounted to an estimated £1.8 million. At the UK level, litigation costs were £2.5 million, productivity losses of parents and healthcare professionals were valued at £12.5 million, and the productivity losses associated with the stillborn child were estimated as £693.7 million. Table 3 shows the total cost data for the UK and for each country separately.
Sensitivity analysis
Nine parameters used to estimate costs in phases 1–7 were subjected to sensitivity analysis (Figure S1 in Appendix S1). The total UK healthcare costs were relatively insensitive to changes in most parameter estimates. Altering the proportion of women falling pregnant within 12 months of a stillbirth by 25% had the largest impact: raising or lowering the total UK healthcare costs by around 20% (£2.78 million) to £16.41 and £10.86 million, respectively. Additional sensitivity analysis results relating to litigation, funeral and productivity cost parameters are shown in Section 4.2 of Appendix S1.
The results of the first scenario analysis, in which only additional subsequent pregnancies were costed, showed that UK healthcare costs decreased from £13.6 to £10.5 million. In the second scenario analysis, productivity losses from the loss of the baby decreased from £693.7 to £333.0 million.
Discussion
Main findings
This paper reports a comprehensive cost‐of‐illness study of the economic burden of stillbirth in the UK. Findings show that in 2014, stillbirth was estimated to cost: the NHS £13.6 million in terms of healthcare costs and £2.5 million in litigation costs; society £706.1 million, by way of quantifiable productivity losses (with 98% of this cost attributable to the loss of life of the potential child); and parents £1.8 million in funeral‐related costs.
Strengths and limitations
This study expanded the work started by Mistry et al. and includes a wider perspective on the economic costs associated with stillbirth. Indeed, the consideration of resource‐use items identified by data sources such as the LTP study and the International Stillbirth Alliance Survey allowed the inclusion of cost categories that may not have previously been considered. Comparing the healthcare costs estimated here and by Mistry et al. is problematic on account of the different costing methodologies employed. For example, Mistry et al. included postmortem costs for all cases, whereas here, based on uptake data, we assumed less than half of parents would consent to an examination.2, 9 Furthermore, and unlike Mistry et al., our study captured the incremental costs of stillbirth and so adjusted for the costs of care that would have been received had the pregnancy resulted in a live birth rather than a stillbirth.
We also considered the additional health and social costs associated with the psychological distress and mental health problems of parents and health professionals following a stillbirth. We have effectively assumed that parents not receiving treatment for mental health problems did not incur any costs, whereas in reality a lack of treatment may result in a need for treatment at a later point; it is likely that there were many more parents who could have benefited from such care. As a consequence, these figures should be regarded as a conservative estimate of the cost of what was provided, rather than the cost of what care was needed. In the absence of data, we were also unable to estimate the costs associated with the distress to wider family members. It is undoubtedly the case that other relatives experience distress, and for some this may lead to conditions requiring treatment and possibly productivity losses as they support bereaved family members.
Novel aspects of our analysis included the consideration of the wider impact of stillbirths from the point of view of the lost productivity of parents, health professionals, and the stillborn child. A lack of published data and difficulty in placing monetary valuations on some wider‐reaching consequences, often referred to as ‘intangible’ costs, must be acknowledged however.3 Families may lose their homes, relationships and friendships can falter, and couples can break up.37, 38, 39 Funeral expenses and lost productivity address only two elements of these personal tragedies.3 Critically, just because we have not been able to account for other intangible costs does not diminish their importance, nor the need to acknowledge them.
In conducting this analysis, it was necessary to make simplifying assumptions. For example, about the duration of maternal workplace absence and the proportion of obstetricians taking time away from work. Analyses showed the results to be sensitive to a small number of study parameters (in particular the proportion of women falling pregnant within 12 months of a stillbirth), and so indicate a need for further research. One further assumption was that couples plan ahead for a final family size, and that when a pregnancy results in stillbirth that a further pregnancy will be attempted. We hope parents may not find this notion offensive; we know from charities supporting parents that the birth of a subsequent child does not replace a stillborn child, but this was a necessary assumption to capture the costs to the NHS of providing health care for a pregnancy that may not have happened had the stillbirth not occurred. Relaxing this assumption and instead costing only the excess pregnancies arising following a stillbirth reduced healthcare costs by £3.1 million annually. The calculation of productivity losses from the loss of a baby was also sensitive to the assumption of whether the birth of a subsequent child alleviates the loss of a member of society from a purely economic perspective. In this case, productivity costs were reduced by £360.7 million, indicating that estimates are affected by the perspective chosen for the analysis.
Finally, we present only mean costs. Conventional simulation analyses were not performed to generate estimates of uncertainty around mean costs because in this context they would reflect only the size of the studies contributing model input data, rather than their quality.
Interpretation
Healthcare costs associated with stillbirth are a fraction of the cost of NHS health care overall, and are small compared with common chronic diseases: for example, dementia (£1.2 billion), cancer (£4 billion), and cardiovascular disease (£2.2 billion).36, 40, 41 The prevalence of stillbirth is substantially lower than many of these chronic conditions, although no less important. This study corroborates previous work that the economic burden of stillbirth extends far beyond the NHS to families and the wider economy, and by depicting costs should help bring about a better appreciation of the need for cost‐effectiveness analyses.4 A substantial proportion of stillbirths could still potentially be avoided, thereby reducing the personal suffering, and monetary expense experienced by bereaved parents, their wider family, and healthcare professionals.42 Evaluations of initiatives to reduce stillbirth such as the ‘Saving Babies Lives’ Care Bundle in England need to acknowledge and consider the costs associated with stillbirth.43
Conclusion
The economic burden of stillbirth extends far beyond the NHS to families and the wider economy. The figures reported here provide the most up‐to‐date information on the economic burden of stillbirth in the UK, yet must still be regarded as conservative as the data available for some cost categories were sparse or absent. Further data collected in the context of robust research would help to refine many of the assumptions made in this analysis. Future research should combine our results with estimates of the burden of disease, assessing mortality and morbidity of stillbirth, to provide a complete framework of the implications at a population level.
Disclosure of interests
None declared. Completed disclosure of interests form available to view online as supporting information.
Contribution to authorship
HEC conducted the cost estimation, and produced a first draft and approved the final version of the manuscript. JJK planned the project, advised on aspects of the costing, facilitated access to data sources, read and revised the manuscript, and approved the final version. AEPH advised on aspects of the costing, provided summary data for the analysis, read and revised the manuscript, and approved the final version. JL advised on aspects of the costing, read and revised the manuscript, and approved the final version. ORA planned and led the project, supervised the cost estimation, read and revised the manuscript, and approved the final version. All authors accept responsibility for the paper as published.
Details of ethics approval
The study used only summary data from previously published research, and therefore no ethical approval was sought.
Funding
This independent study was funded by the Department of Health funded Policy Research Unit in Maternal Health and Care Programme. The views expressed are not necessarily those of the Department of Health.
Supporting information
Table S1. Unit costs (2013/14 UK £) used when estimating the cost of stillbirth.
Table S2. Healthcare contacts and investigations reported at the time an antepartum stillbirth is suspected and confirmed.
Table S3. Other investigations performed following a stillbirth.
Table S4. Home visits in the 3 months following discharge from hospital after a stillbirth and live birth.
Table S5. Maternal and paternal anxiety and depression following stillbirth and live birth.
Table S6. Health care professional anxiety and depression following stillbirth.
Table S7. Proportions used to identify 12 mutually exclusive groups for whom antenatal care in a subsequent pregnancy is likely to vary.
Table S8. Antenatal care provided to women according to the cause of the previous stillbirth and early and final outcomes of the subsequent pregnancy.
Table S9. Data used to estimate final outcomes for a subsequent pregnancy occurring within 12 months.
Table S10. Data used to estimate the excess proportion of live preterm births attributable to stillbirth.
Table S11. Funeral and related costs.
Table S12. Data used when estimating parental productivity costs associated with stillbirth.
Table S13. Estimation of lifetime productivity losses for full‐term males and females.
Table S14. Estimation of lifetime productivity losses for preterm males and females.
Table S15. Evidence classification for study parameters.
Appendix S1. Detailed information on the costing methods.
Figure S1. Sensitivity analysis results for total UK health and social care costs of stillbirth (phases 1–7).
Acknowledgements
We are grateful to Ramon Luengo‐Fernandez who acted as a special advisor on the costing aspects of the study, and to Jane Henderson and Maggie Redshaw for providing additional summary data from the Listening to Parents Survey Study. We would also like to thank Charlotte Bevan at Sands—Stillbirth & neonatal death charity for reading and providing comments on the manuscript and the reviewers for their thoughtful comments and suggestions on the paper.
Campbell HE, Kurinczuk JJ, Heazell AEP, Leal J, Rivero‐Arias O. Healthcare and wider societal implications of stillbirth: a population‐based cost‐of‐illness study. BJOG 2018; 125:108–117.
Linked article This article is commented on by JJHM Erwich, p. 118 in this issue. To view this mini commentary visit https://doi.org/10.1111/1471-0528.14988.
References
- 1. Flenady V, Wojcieszek AM, Middleton P, Ellwood D, Erwich JJ, Coory M, et al. Stillbirths: recall to action in high‐income countries. Lancet 2016;387:691–702. [DOI] [PubMed] [Google Scholar]
- 2. Mistry H, Heazell AE, Vincent O, Roberts T. A structured review and exploration of the healthcare costs associated with stillbirth and a subsequent pregnancy in England and Wales. BMC Pregnancy Childbirth 2013;13:236. [DOI] [PMC free article] [PubMed] [Google Scholar]
- 3. Ogwulu CB, Jackson LJ, Heazell AE, Roberts TE. Exploring the intangible economic costs of stillbirth. BMC Pregnancy Childbirth 2015;15:188. [DOI] [PMC free article] [PubMed] [Google Scholar]
- 4. Heazell AEP, Siassakos D, Blencowe H, Burden C, Bhutta ZA, Cacciatore J, et al. Stillbirths: economic and psychosocial consequences. Lancet 2016;387:604–16. [DOI] [PubMed] [Google Scholar]
- 5. Manktelow BN, Smith LK, Seaton SE, Hyman‐Taylor P, Kurinczuk JJ, Field DJ, et al. Perinatal Mortality Surveillance Report UK Perinatal Deaths for Births from January to December 2014. Leicester: The Infant Mortality and Morbidity Group: Department of Health Sciences, University of Leicester, 2016. [Google Scholar]
- 6. Redshaw M, Rowen R, Henderson J. Listening to Parents After Stillbirth or the Death of Their Baby After Birth. Oxford: National Perinatal Epidemiology Unit (NPEU), University of Oxford, 2014. [Google Scholar]
- 7. Department of Health . NHS reference costs 2013–14. 2014. [www.gov.uk/government/publications/nhs-reference-costs-2013-to-2014]. Accessed 21 September 2015.
- 8. Heazell AE, McLaughlin MJ, Schmidt EB, Cox P, Flenady V, Khong TY, et al. A difficult conversation? The views and experiences of parents and professionals on the consent process for perinatal postmortem after stillbirth. BJOG 2012;119:987–97. [DOI] [PubMed] [Google Scholar]
- 9. Manktelow BM, Smith LK, Evans TA, Hyman‐Taylor P, Kurinczuk JJ, Field DJ, et al. Perinatal Mortality Surveillance Report UK Perinatal Deaths for Births from January to December 2013. Leicester: The Infant Mortality and Morbidity Group: Department of Health Sciences, University of Leicester, 2015. [Google Scholar]
- 10. Heron J, O'Connor TG, Evans J, Golding J, Glover V. The course of anxiety and depression through pregnancy and the postpartum in a community sample. J Affect Disord 2004;80:65–73. [DOI] [PubMed] [Google Scholar]
- 11. McCrone PR, Dhanasiri S, Patel A, Knapp M, Lawton‐Smith S. Paying the Price: The Cost of Mental Health Care in England to 2026. London: King's Fund, 2008. [Google Scholar]
- 12. Ramchandani PG, Stein A, O'Connor TG, Heron J, Murray L, Evans J. Depression in men in the postnatal period and later child psychopathology: a population cohort study. J Am Acad Child Adolesc Psychiatry 2008;47:390–8. [DOI] [PMC free article] [PubMed] [Google Scholar]
- 13. Farrow VA, Goldenberg RL, Fretts R, Schulkin J. Psychological impact of stillbirths on obstetricians. J Matern Fetal Neonatal Med 2013;26:748–52. [DOI] [PubMed] [Google Scholar]
- 14. Sheen K, Spiby H, Slade P. Exposure to traumatic perinatal experiences and posttraumatic stress symptoms in midwives: prevalence and association with burnout. Int J Nurs Stud 2015;52:578–87. [DOI] [PubMed] [Google Scholar]
- 15. Hughes PM, Turton P, Evans CDH. Stillbirth as risk factor for depression and anxiety in the subsequent pregnancy: cohort study. BMJ 1999;318:1721–4. [DOI] [PMC free article] [PubMed] [Google Scholar]
- 16. Bhattacharya S, Prescott GJ, Black M, Shetty A. Recurrence risk of stillbirth in a second pregnancy. BJOG 2010;117:1243–7. [DOI] [PubMed] [Google Scholar]
- 17. Simmons RK, Singh G, Maconochie N, Doyle P, Green J. Experience of miscarriage in the UK: qualitative findings from the National Women's Health Study. Soc Sci Med 2006;63:1934–46. [DOI] [PubMed] [Google Scholar]
- 18. Black M, Shetty A, Bhattacharya S. Obstetric outcomes subsequent to intrauterine death in the first pregnancy. BJOG 2008;115:269–74. [DOI] [PubMed] [Google Scholar]
- 19. Mangham LJ, Petrou S, Doyle LW, Draper ES, Marlow N. The cost of preterm birth throughout childhood in England and Wales. Pediatrics 2009;123:e312–27. [DOI] [PubMed] [Google Scholar]
- 20. Office for National Statistics (ONS) . Birth Characteristics in England and Wales 2014. Newport: Office for National Statistics, 2015. [Google Scholar]
- 21. NHS Litigation Authority . Ten Years of Maternity Claims—An Analysis of NHS Litigation Authority Data. London: NHSLA, 2012. [Google Scholar]
- 22. NHS Litigation Authority . NHSLA factsheet 5—trust and health authority claims data 2013–14. 2017. [www.nhsla.com/Pages/Publications.aspx?library=currentactivity%7cfactsheets%7cfactsheet5trustandhealthauthorityclaimsdata]. Accessed 4 October 2017.
- 23. Royal London . Rising Funeral Costs. The Elephant in to Room. The systemic and interrelated problems contributing to rising funeral costs responsible for funeral debt. The Royal London National Funeral Cost Index Report 2015. London: Royal London, 2016. [Google Scholar]
- 24. The Co‐op Memorials . Children's Memorials. 2017. [www.coopfunerals.co.uk/Memorials/Burial/Childrens/]. Accessed 10 January 2017.
- 25. Office for National Statistics (ONS) . Annual Survey of Hours and Earnings, 2014. Newport: Office for National Statistics, 2014. [Google Scholar]
- 26. Office for National Statistics (ONS) . Regional Labour Market: X01 Regional Employment by Age. Newport: Office for National Statistics, 2015. [Google Scholar]
- 27. Office for National Statistics (ONS) . Mid‐Year Population Estimates for the UK 2014. Newport: Office for National Statistics, 2015. [Google Scholar]
- 28. Nuzum D, Meaney S, O'Donoghue K. The impact of stillbirth on consultant obstetrician gynaecologists: a qualitative study. BJOG 2014;121:1020–8. [DOI] [PubMed] [Google Scholar]
- 29. Curtis L. Unit Costs of Health and Social Care. Canterbury: University of Kent: Personal Social Services Research Unit, 2014. [Google Scholar]
- 30. Phillips J, Millum J. Valuing stillbirths. Bioethics 2015;29:413–23. [DOI] [PMC free article] [PubMed] [Google Scholar]
- 31. Lindström K, Winbladh B, Haglund B, Hjern A. Preterm infants as young adults: a Swedish national cohort study. Pediatrics 2007;120:70–7. [DOI] [PubMed] [Google Scholar]
- 32. Moster D, Lie RT, Markestad T. Long‐term medical and social consequences of preterm birth. N Engl J Med 2008;359:262–73. [DOI] [PubMed] [Google Scholar]
- 33. Winstanley A, Lamb ME, Ellis‐Davies K, Rentfrow PJ. The subjective well‐being of adults born preterm. J Res Pers 2015;59(Suppl C):23–30. [Google Scholar]
- 34. National Institute for Health and Care Excellence . Guide to the Methods of Technology Appraisal. London: National Institute for Health and Care Excellence, 2013. [PubMed] [Google Scholar]
- 35. Leal J, Luengo‐Fernandez R, Sullivan R, Witjes JA. Economic burden of bladder cancer across the European Union. Eur Urol 2016;69:438–47. [DOI] [PubMed] [Google Scholar]
- 36. Luengo‐Fernandez R, Leal J, Gray A, Sullivan R. Economic burden of cancer across the European Union: a population‐based cost analysis. Lancet Oncol 2013;14:1165–74. [DOI] [PubMed] [Google Scholar]
- 37. Downe S, Schmidt E, Kingdon C, Heazell AE. Bereaved parents' experience of stillbirth in UK hospitals: a qualitative interview study. BMJ Open 2013;3:e002237. [DOI] [PMC free article] [PubMed] [Google Scholar]
- 38. Gold KJ, Sen A, Hayward RA. Marriage and cohabitation outcomes after pregnancy loss. Pediatrics 2010;125:e1202–7. [DOI] [PMC free article] [PubMed] [Google Scholar]
- 39. Radestad I, Sjogren B, Nordin C, Steineck G. Stillbirth and maternal well‐being. Acta Obstet Gynecol Scand 1997;76:849–55. [DOI] [PubMed] [Google Scholar]
- 40. Luengo‐Fernandez R, Leal J, Gray AM. Cost of dementia in the pre‐enlargement countries of the European Union. J Alzheimers Dis 2011;27:187–96. [DOI] [PubMed] [Google Scholar]
- 41. Luengo‐Fernandez R, Leal J, Gray A, Petersen S, Rayner M. Cost of cardiovascular diseases in the United Kingdom. Heart 2006;92:1384–9. [DOI] [PMC free article] [PubMed] [Google Scholar]
- 42. Lancet . Ending preventable stillbirth series. 2016. [www.thelancet.com/series/ending-preventable-stillbirths]. Accessed 21 September 2016.
- 43. NHS England . Saving Babies' Lives. A Care Bundle for Reducing Stillbirth. Leeds: NHS England, 2016. [Google Scholar]
- 44. Basingstoke and North Hampshire NHS Trust . Postnatal visits. 2017. [http://www.hampshirehospitals.nhs.uk/our-services/a-z-departments-and-specialities/m/maternity-services/basingstoke-and-north-hampshire-maternity-services/postnatal-care/postnatal-visits.aspx]. Accessed: 26 September 2016.
- 45. Brighton and Sussex University Hospitals NHS Trust . Post natal booklet. 2017. [https://www.bsuh.nhs.uk/wp-content/uploads/sites/5/2016/09/Post-natal-booklet.pdf]. Accessed: 26 September 2016.
- 46. McAndrew F, Thompson J, Fellows L, Large A, Speed M, Renfrew MJ. Infant Feeding Survey 2010. Leeds: Health and Social Care Information Centre, 2012. [Google Scholar]
- 47. NHS Choices . Your six‐week postnatal check. 2017. [http://www.nhs.uk/conditions/pregnancy-and-baby/pages/postnatal-check.aspx]. Accessed: 26 September 2016.
- 48. NHS England . The universal health reviews – 5 key visits. 2017. [https://www.england.nhs.uk/ourwork/qual-clin-lead/hlth-vistg-prog/5-key-visits/]. Accessed: 26 September 2016.
Associated Data
This section collects any data citations, data availability statements, or supplementary materials included in this article.
Supplementary Materials
Table S1. Unit costs (2013/14 UK £) used when estimating the cost of stillbirth.
Table S2. Healthcare contacts and investigations reported at the time an antepartum stillbirth is suspected and confirmed.
Table S3. Other investigations performed following a stillbirth.
Table S4. Home visits in the 3 months following discharge from hospital after a stillbirth and live birth.
Table S5. Maternal and paternal anxiety and depression following stillbirth and live birth.
Table S6. Health care professional anxiety and depression following stillbirth.
Table S7. Proportions used to identify 12 mutually exclusive groups for whom antenatal care in a subsequent pregnancy is likely to vary.
Table S8. Antenatal care provided to women according to the cause of the previous stillbirth and early and final outcomes of the subsequent pregnancy.
Table S9. Data used to estimate final outcomes for a subsequent pregnancy occurring within 12 months.
Table S10. Data used to estimate the excess proportion of live preterm births attributable to stillbirth.
Table S11. Funeral and related costs.
Table S12. Data used when estimating parental productivity costs associated with stillbirth.
Table S13. Estimation of lifetime productivity losses for full‐term males and females.
Table S14. Estimation of lifetime productivity losses for preterm males and females.
Table S15. Evidence classification for study parameters.
Appendix S1. Detailed information on the costing methods.
Figure S1. Sensitivity analysis results for total UK health and social care costs of stillbirth (phases 1–7).