

Abstract
Lytic polysaccharide monooxygenases (LPMOs) catalyze the oxidative cleavage of glycosidic bonds in recalcitrant polysaccharides, such as cellulose and chitin, and are of interest in biotechnological utilization of these abundant biomaterials. It has recently been shown that LPMOs can use H2O2, instead of O2, as a cosubstrate. This peroxygenase-like reaction by a monocopper enzyme is unprecedented in nature and opens new avenues in chemistry and enzymology. Here, we provide the first detailed kinetic characterization of chitin degradation by the bacterial LPMO chitin-binding protein CBP21 using H2O2 as cosubstrate. The use of 14C-labeled chitin provided convenient and sensitive detection of the released soluble products, which enabled detailed kinetic measurements. The kcat for chitin oxidation found here (5.6 s−1) is more than an order of magnitude higher than previously reported (apparent) rate constants for reactions containing O2 but no added H2O2. The kcat/Km for H2O2-driven degradation of chitin was on the order of 106 m−1 s−1, indicating that LPMOs have catalytic efficiencies similar to those of peroxygenases. Of note, H2O2 also inactivated CBP21, but the second-order rate constant for inactivation was about 3 orders of magnitude lower than that for catalysis. In light of the observed CBP21 inactivation at higher H2O2 levels, we conclude that controlled generation of H2O2 in situ seems most optimal for fueling LPMO-catalyzed oxidation of polysaccharides.
Keywords: copper monooxygenase, enzyme inactivation, enzyme kinetics, hydrogen peroxide, polysaccharide, Serratia marcescens
Introduction
It has very recently been shown that monocopper enzymes may use H2O2 as cosubstrate (1). Importantly, this finding concerns lytic polysaccharide monooxygenases (LPMOs),2 which are abundant key players in enzymatic biomass conversion (2). LPMOs catalyze the oxidative cleavage of glycosidic bonds in poly- and, in a few cases, oligosaccharides (3, 4), including abundant recalcitrant polysaccharides, such as chitin (5) and cellulose (6–8). Unlike glycoside hydrolases, LPMOs can act on glycan chains that are embedded in a crystalline lattice, cleaving glycosidic bonds by hydroxylation of the C1 or C4 carbon. This ability is conferred by their unusual active-site architecture, a single copper atom coordinated by two conserved histidines, displayed on a solvent-exposed, flat substrate-binding surface (9, 10). It has been widely acknowledged that LPMOs are monooxygenases (8). The recent finding that H2O2 is the preferred cosubstrate (1) calls for further studies on the H2O2-based mechanism. Kinetic studies on LPMOs are scarce, mostly showing very low rates (11). Such kinetic studies are challenging because of the multisubstrate nature of the reaction, the insolubility of one of the substrates, and oxidative enzyme inactivation (1). Here, we set out to provide the first detailed kinetic insights into H2O2 utilization by LPMOs using the bacterial C1-oxidizing, chitin-active CBP21 (5) as a model enzyme and 14C-labeled chitin nanowhiskers (CNWs) (12) as substrate.
Results
Kinetics of the H2O2-driven degradation of chitin by CBP21
The use of 14C-labeled CNWs made it possible to perform detailed kinetic measurements by providing convenient and sensitive detection of the released 14C-labeled soluble products, the amount of which is expressed in N-acetylglucosamine equivalents (NAGeq) as explained under “Experimental procedures.” Because the release of soluble products from chitin by CBP21 is the result of oxidative action only, the formation of NAGeq is directly proportional to the CBP21 activity, and the quantitative relationship between the two follows from the work described below. To activate the enzyme, which is otherwise in its inactive Cu(II) resting state, the reactions must be supplemented with a priming amount of reductant, like ascorbic acid (AscA) as outlined in Bissaro et al. (1). From Fig. 1A (see also Table S1), it follows that variation of the concentration of AscA over 2 orders of magnitude had no major effects on the kinetics of degradation of CNWs. Based on these results, we chose an AscA concentration of 100 μm for all further experiments. Control reactions also showed that the outcome of the experiment was not affected by the order of the addition of AscA and H2O2 (Fig. 1B) and that the addition of non-labeled CNWs, used to improve the sedimentation of CNWs during separation of soluble 14C-labeled products from residual 14C-labeled CNWs by centrifugation (12), did not affect the outcome of the experiment (Fig. 1B).
Figure 1.
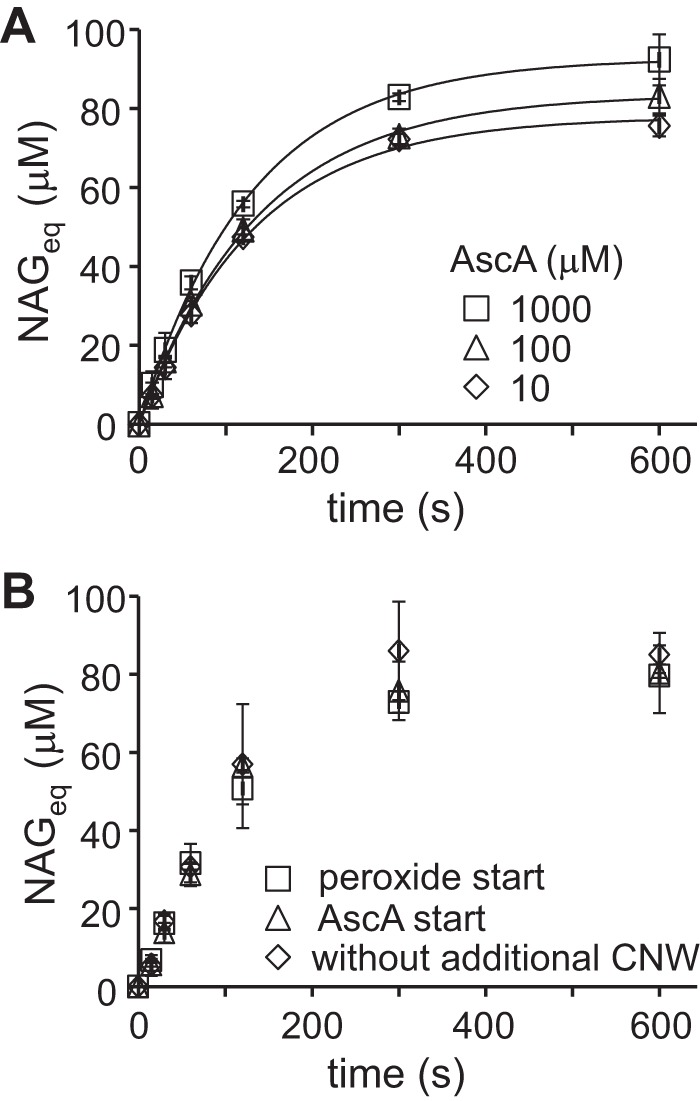
Control experiments for setting reaction conditions. A, screening for the concentration of AscA. The reactions contained CNWs (1.0 mg ml−1), H2O2 (20 μm), CBP21 (50 nm), and AscA (10, 100, or 1,000 μm). Solid lines represent the best fit of non-linear regression analysis according to Equation 1. The best fit parameter values are listed in Table S1. B, assessing the importance of the sequence of adding the various chemicals. The reaction mixtures contained CNWs (1.0 mg ml−1), H2O2 (20 μm), CBP21 (50 nm), and AscA (100 μm). The reactions were initiated either by the addition of H2O2 or AscA and were all carried out in NaAc buffer at 25 °C. In one of the series, the reaction was initiated by the addition of H2O2, and the addition of non-labeled CNWs before centrifugation (to separate soluble and insoluble 14C-labeled products) was omitted. For more details, see “Experimental procedures.” Error bars represent S.D. and are from at least two independent measurements.
Time curves of the formation of NAGeq at different [CNW] and [H2O2] are shown in Fig. 2. The time curves were fitted to empirical Equation 1, which was used as a first approximation in the treatment of data.
| (Eq. 1) |
Figure 2.
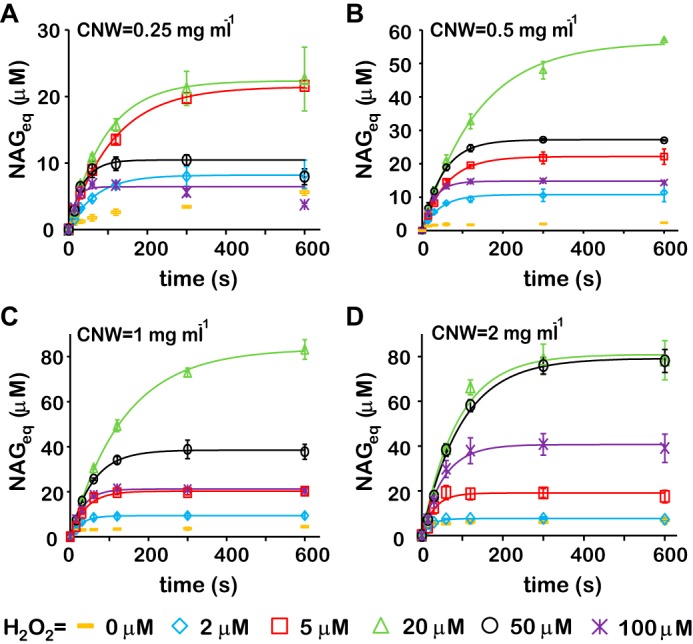
Time curves of the formation of soluble products (in NAG equivalents) during degradation of chitin (CNWs) by CBP21 using H2O2 as cosubstrate. Reactions were done in NaAc buffer at 25 °C and contained CNWs, H2O2, CBP21 (50 nm), and AscA (0.1 mm). CNW concentrations were 0.25 (A), 0.5 (B), 1.0 (C), and 2.0 mg ml−1 (D). The readings of the experiments without added H2O2 (H2O2 = 0 μm) were subtracted from the readings of the experiments with H2O2. The color coding for [H2O2] is indicated in the figure. Solid lines are derived from Equation 1. Error bars represent S.D. and are from at least two independent measurements.
In Equation 1, [NAGeq]max is the plateau value of released NAGeq, and kobs is an observed first-order rate constant, which notably may have quite different meanings depending on the reaction conditions as outlined below. The time courses show that CBP21 activity increases with initial [H2O2] (2–20 μm) but with apparent inhibition at [H2O2] >20 μm (Fig. 2). The biphasic profiles of the dependence of [NAGeq]max (Fig. 3A) and kobs (Fig. 3B) on [H2O2] suggest that H2O2 serves as both substrate and inhibitor for CBP21. At low H2O2 concentrations, the kinetics (the values of [NAGeq]max and kobs) is governed by the depletion of H2O2, whereas at high H2O2 concentrations, the kinetics is governed by the inactivation of CBP21. Rapid rate retardation did not permit measuring the initial rates by monitoring the reaction in the linear region of the time curves. Therefore, the initial rates were calculated as [NAGeq]maxkobs, which is the time derivative of Equation 1 in the limiting condition of t close to zero. The dependence of initial rates on [H2O2] was in accordance with Michaelis-Menten saturation kinetics (Fig. 3C and Equation 2).
| (Eq. 2) |
Figure 3.

Kinetics of degradation of chitin (CNWs) by CBP21 using H2O2 as cosubstrate. Reactions were done in NaAc buffer at 25 °C and contained CNWs, H2O2, CBP21 (50 nm), and AscA (0.1 mm). Error bars represent S.D. and are from at least two independent measurements. A, [NAGeq]max as a function of [H2O2]. The solid line shows linear regression of the data obtained using low [H2O2] (5.0, 10, and 20 μm) and high [CNW] (1.0 and 2.0 mg ml−1). B, kobs as a function of [H2O2]. Solid lines show linear regression of the data obtained using high [H2O2] (50 and 100 μm) with fixed intercept = 0. C, dependence of initial rates on [H2O2]. Solid lines are according to the Michaelis-Menten equation (Equation 2). The legend code for [CNW] (shown in B) also applies for A and C. D–F, apparent Vmax (D), apparent Km for H2O2 (E), and apparent Vmax/Km for H2O2 (F) as a function of [CNW]. The solid line in D is derived from Equation 3.
Vmaxapp and Km(H2O2)app are the apparent Vmax and Km for H2O2 at a particular concentration of CNWs. It must be noted that the applicability of the Michaelis-Menten equation in describing heterogeneous interfacial catalysis assumes that binding sites on the polymer are in excess compared with the total enzyme concentration (13). The half-saturating concentration of free CBP21 for binding to β-chitin is in the μm range (14). It is well known that the binding affinity of CBP21 to α-chitin is much lower than that to β-chitin (15–17). Thus, under our experimental conditions (50 nm CBP21), there is a clear excess of binding sites, and the Michaelis-Menten equation is applicable.
The dependence of apparent Vmax (Vmaxapp) on [CNW] (Fig. 3D) was consistent with the hyperbolas described by Equation 3.
| (Eq. 3) |
In Equation 3, Vmax is the true maximum velocity (i.e. enzyme is saturated with both H2O2 and CNWs), and Km(CNW) is the Michaelis constant for CNWs. The best estimates for Vmax and Km(CNW) were 1.11 ± 0.04 μm NAGeq s−1 and 0.58 ± 0.05 mg ml−1, respectively. The apparent Km values for H2O2 (Km(H2O2)app) measured at different [CNW] are shown in Fig. 3E. Because of the low values of Km(H2O2)app, their estimates come with high uncertainty. To avoid overinterpretation, we do not discuss the possible dependence of Km(H2O2)app on the concentration of CNWs. Instead Km(H2O2) is given as an average value of Km(H2O2)app from experiments with different concentrations of CNWs. Using this approach, we estimate that Km(H2O2) = 2.8 ± 1.3 μm. Consistency with Equation 3 is expected for enzymatic reactions involving two substrates regardless of whether the substituted-enzyme (ping–pong) or ternary-complex mechanism is in use (18). However, a characteristic feature of the ping–pong mechanism is that (Vmax/Km)app is independent of the concentration of either the donor or the acceptor of the group to be transferred (18). Here, the apparent Vmax/Km(H2O2) clearly appeared dependent on the concentration of CNWs (Fig. 3F), suggesting the use of a ternary-complex mechanism.
To establish conditions with low and stable H2O2 levels, we used an experimental setup with in situ generation of H2O2 by the glucose/glucose oxidase (GO) reaction at different rates (Fig. S1). The use of GO-generated H2O2 yielded progress curves with steady-state regions where the release of NAGeq in time was linear (Fig. 4A). For conditions where the H2O2 feeding rate was below the Vmaxapp of its consumption by CBP21, there was a linear correlation between the steady-state rate of the CBP21 reaction and the rate of H2O2 generation by GO with a slope equal to 3.8 ± 0.3 NAGeq/H2O2 (Fig. 4B). Consistently, a similar stoichiometry (4.1 ± 0.3 NAGeq/H2O2) was obtained by plotting the [NAGeq]max measured at high concentrations of CNWs against [H2O2] (Fig. 3A). Thus, one can approximate that an average of 4 NAGeq are released in solution for each molecule of H2O2 consumed by CBP21. Based on these results, the kcat based on detected NAGeq can be converted into a kcat based on molecules of H2O2 consumed as follows: kcat = Vmax/n[CBP21]tot = 5.6 ± 0.2 s−1 with [CBP21]tot = 50 nm, Vmax = 1.11 ± 0.04 μm NAGeq s−1 as derived from Fig. 3D, and n = 4 NAGeq/H2O2. Importantly, the H2O2-based value represents a total activity, independent of whether the generated oxidized product is solubilized (and thus detected) or remains in the insoluble fraction (see text below).
Figure 4.
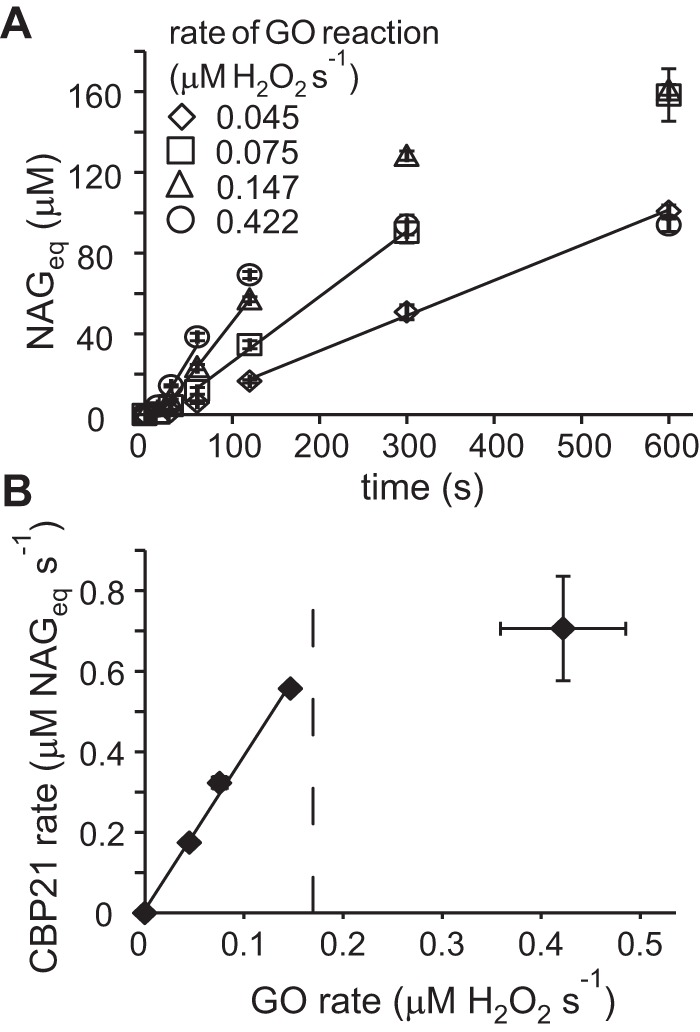
Degradation of CNWs by CBP21 with feeding of H2O2 by glucose/GO. Reactions were performed in NaAc buffer at 25 °C and contained CNWs (1.0 mg ml−1), CBP21 (50 nm), AscA (0.1 mm), glucose (10 mm), and GO. Error bars represent S.D. and are from at least two independent measurements. A, release of NAGeq at different rates of production of H2O2 by GO. The slopes of the solid lines are equal to the steady-state rates of the CBP21 reaction. B, steady-state rates of the CBP21 reaction at different rates of the GO reaction. The slope of the line equals 3.8 ± 0.3 NAGeq/H2O2. The vertical dashed line indicates Vmaxapp of the CBP21 reaction on the basis of H2O2 consumption at [CNWs] = 1.0 mg ml−1 (i.e. 0.68 NAGeq s−1 (see Fig. 3D) divided by 4 NAGeq/H2O2).
To find the total number of CBP21-generated oxidized groups per molecule of H2O2 consumed, we conducted direct measurements of the formation of both soluble and total oxidized groups generated by CBP21 to non-labeled CNWs at different concentrations of H2O2 (Fig. 5A). The concentration of insoluble oxidized groups was found as [Oxidized groups]insoluble = [Oxidized groups]total − [Oxidized groups]soluble. The probability of oxidized group being in the soluble fraction (α) is defined as α = [Oxidized groups]soluble/[Oxidized groups]total. We note that both [Oxidized groups]total/[H2O2] (Fig. 5B) and α (Fig. 5C) depend on whether the formation of oxidized groups in the experiment without added H2O2 ([H2O2] = 0 μm background) was subtracted or not. The experiment without added H2O2 represents O2-driven CBP21 activity for which various catalytic scenarios have been proposed (11), including one in which the LPMO itself first converts O2 to H2O2 (1). Therefore, it seems plausible that subtraction of the O2-driven background reaction is justified and needed in the case of experiments with low (2.0 and 5.0 μm), but not with high, initial H2O2 loads. Taken together, the direct measurements of oxidized groups suggest that (i) at low [H2O2] about one oxidized group is generated per one H2O2 molecule supplied in accordance with previous observations (1) and (ii) about 50% of the oxidized groups are in the soluble fraction (the average value of α in the series with subtracted O2 background is 0.5 ± 0.1; Fig. 5C). We note that the value of α has no influence on the measured kcat value because the value of the coefficient n (4 ± 0.3 NAGeq/H2O2), used for calculating the kcat value from the amount of released NAGeq, was determined from the consumption of H2O2, which represents the formation of total oxidized groups.
Figure 5.

Generation of oxidized (ox) groups by CBP21. The reactions contained non-labeled CNWs (1.0 mg ml−1), CBP21 (50 nm), AscA (0.1 mm), and H2O2 (as indicated in the plots). Reactions were conducted in NaAc buffer at 25 °C for 10 min. Error bars represent S.D. and are from three independent measurements. A, formation of soluble and total oxidized (soluble + insoluble) groups upon incubation of CNWs with CBP21 at different initial H2O2 loads. Formation of oxidized groups was not observed in a control experiment without CBP21. B, the concentration of total oxidized groups (from A) divided by the initial concentration of H2O2 ([oxidized groups]total/[H2O2]) at different initial H2O2 loads. In one series (labeled as without O2 background), the number of total oxidized groups measured in the experiment without added H2O2 ([H2O2] = 0 μm) was subtracted from the total oxidized groups measured in the experiments with added H2O2. C, distribution of oxidized groups between the soluble and insoluble fractions (α = [Oxidized groups]soluble/[Oxidized groups]total) at different initial H2O2 loads. In one series, the number of oxidized groups measured in the experiment without added H2O2 ([H2O2] = 0 μm) was subtracted from the number oxidized groups measured in the experiments with added H2O2. For labeling of the series, see B.
Importantly, CBP21 produces ∼4 NAGeq per consumed H2O2, which may give the impression that the average degree of polymerization of the solubilized oxidized products is in the order of 4. However, the actual average degree of polymerization of soluble oxidized chito-oligosaccharides (defined as n/α) is dependent on the value of α. With α being 0.5 and n being 4, the true estimated average degree of polymerization of solubilized products is 8, which is a reasonable value in light of actual product profiles that have been published for CBP21 (5).
Inactivation of CBP21 by H2O2
Besides being a cosubstrate, H2O2 can also cause enzyme inactivation especially in the absence of substrate, which is due to oxidative damage inflicted on residues in and near the catalytic center (1). Indeed, the activity of CBP21 was completely and irreversibly lost upon 10-min incubation with 20 μm H2O2 and ascorbic acid (Fig. S2). The kobs in Equation 1 represents the rate constant of the decay of the reaction (the formation of NAGeq in time). At low [H2O2] (up to 20 μm), the kobs decreases with increasing [H2O2] (Fig. 3B) indicating that the decay of the reaction is governed by the depletion of H2O2 (the decay is slower with more H2O2 present). However, at high H2O2 concentrations (>20 μm), the kobs starts to increase with increasing [H2O2] (Fig. 3B), indicating that a factor other than H2O2 depletion is responsible for the decay of the formation of NAGeq in time. We suggest that in these conditions the decay of the reaction is governed by the H2O2-induced inactivation of CBP21. The faster inactivation at higher H2O2 concentrations is revealed in faster decay (higher kobs values) at higher [H2O2] (see also Equation S2). Provided that the decay of the reaction is governed by the inactivation of CBP21, the observed decrease of kobs values with increasing [CNW] in experiments with [H2O2] >20 μm (Fig. 3B) thus suggests that the inactivation of CBP21 is relieved by CNWs. As a control, the presence of cellulose had no effect on CBP21 kinetics (Fig. S3), indicating that the stabilizing effect of [CNW] is not just the effect of a higher concentration of solids. At [H2O2] >20 μm, there was a near-linear correlation between kobs and [H2O2] (Fig. 3B). The slope of this linear correlation provides an estimate of the value of the apparent second-order rate constant for inactivation of CBP21 by H2O2 (kiapp) at a particular concentration of CNWs.
| (Eq. 4) |
Plotting kiapp as a function of [CNW] (Fig. 6) and non-linear regression using Equation 4 (with Km(CNW) fixed to 0.58 mg ml−1) provides a second-order inactivation constant in the absence of chitin (ki) of 778 ± 46 m−1 s−1. Although different approaches (see supporting discussion) lead to somewhat different ki values, they all fall in the order of 103 m−1 s−1. This translates into a half-life of CBP21 of less than 10 s in the presence of reductant and 100 μm H2O2 and in the absence of chitin.
Figure 6.
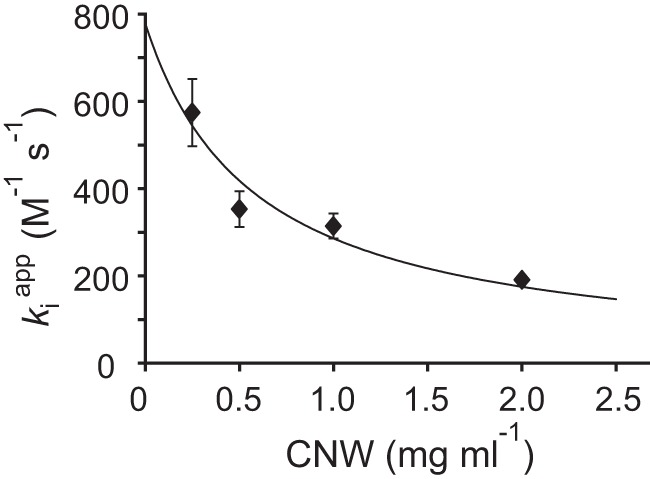
Inactivation of CBP21 is relieved by chitin. Dependence of the apparent second-order rate constant of inactivation of CBP21 (kiapp) on the concentration of CNWs is shown. kiapp was derived from the data presented in Fig. 3B by linear regression (i.e. from the slope of the lines in Fig. 3B). The solid line represents the best fit of non-linear regression analysis according to Equation 4 with the value of Km(CNW) fixed to 0.58 mg ml−1 (found from the analysis of the data in Fig. 3D according to the Equation 3). Error bars represent S.D. and are from at least two independent measurements.
Possible mechanism of H2O2-driven degradation of chitin
The simplest mechanism that can account for the data presented here is the compulsory-order ternary-complex mechanism with irreversible inactivation of free enzyme by H2O2. The dependence of the (apparent) parameters in the Michaelis-Menten equation on the concentration of substrates (as in Equation 3) does not provide information about the order of the binding of the substrates (18). Therefore, we also measured the binding of CBP21 to CNWs without adding H2O2 (Fig. 7A). The estimated half-saturating concentration of CNWs for the binding of CBP21 was 0.68 ± 0.01 mg ml−1 (Fig. 7B). This figure is close to the value of Km(CNW) in the presence of H2O2 (see above), indicating that H2O2 has little influence on the binding of CBP21 to CNWs. The rate of inactivation of CBP21 showed no saturation with H2O2 in the concentration range studied (Fig. 3B), suggesting that binding of H2O2 to free CBP21 is weak (here we assume that only the CBP21 free from CNWs is subject to inactivation). The possible reaction mechanism is depicted in Fig. 8. The mechanism can be described quantitatively by combining the rate equation for the compulsory-order ternary-complex mechanism (18) and the exponential term that accounts for irreversible inactivation of free enzyme, which results in Equation 5.
| (Eq. 5) |
Figure 7.
Binding of CBP21 to CNWs in the absence of added H2O2. Binding of CBP21 to unlabeled CNWs was assessed by measuring CBP21 activity in supernatants using 14C-labeled CNWs as described under “Experimental procedures.” A, time curves for the formation of soluble products (in NAGeq) upon degradation of 14C-labeled CNWs by unbound CBP21 in the supernatants of the binding reactions. Solid lines are the best fit lines from non-linear regression analysis according to Equation 1. Error bars show S.D. and are from two independent experiments. B, the ratio of initial rates of CBP21 activity in the supernatants from binding experiments made in the presence (vCNW) and absence (vCNW = 0) of CNWs. The concentration of CNWs in the binding experiment is shown on the x axis. The initial rates of CBP21 were measured as initial slopes ([NAGeq]maxkobs) according to Equation 1 using the time curves shown in A. The solid line in B is the best fit line according to Equation 7.
Figure 8.
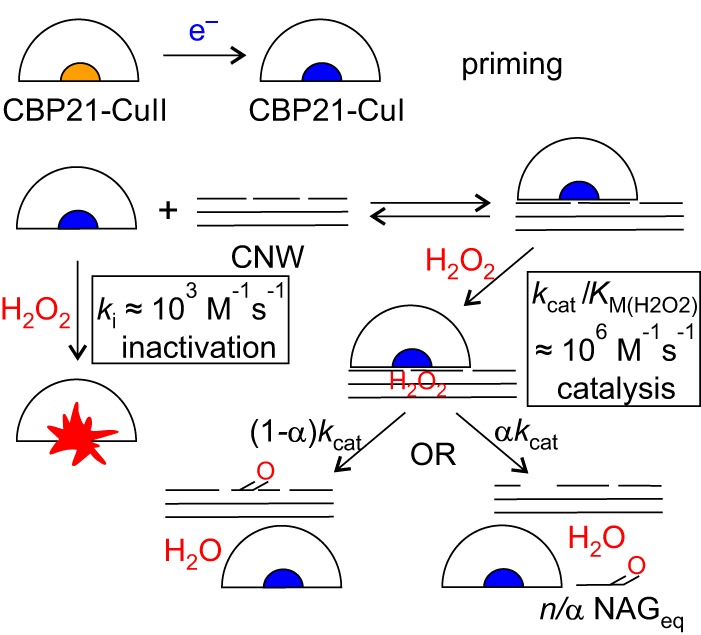
Possible mechanism of H2O2-driven degradation of chitin by CBP21. The enzyme in its resting state (CBP21-CuII) is activated by an external electron donor, leading to its Cu(I) state (priming) (CBP21-CuI). The primed enzyme will bind to chitin (Ki(CNW)) followed by binding of H2O2 (Km(H2O2)) and oxidative cleavage of a glycosidic bond (kcat) that may lead to the formation of a soluble (with a probability of α; α = 0.5 ± 0.1; Fig. 5C) or insoluble (with probability of 1 − α) oxidized group. Here, it is assumed that NAGeq are not released upon generation of an insoluble oxidized group. The n is an average number of NAGeq released per one oxidative cleavage. The average length of soluble products equals n/α, i.e. ∼8. The primed enzyme can also combine with H2O2 in a way that leads to enzyme inactivation (shown as an enzyme with a red splash). The reaction scheme can be captured by the combined Equation 4 and 5. The best estimates of the values of parameters of Equation 4 and 5 are as follows: kcat = 5.6 ± 0.2 s−1, n = 4 ± 0.3 NAGeq/H2O2, Ki(CNW) = 0.68 ± 0.01 mg ml−1, Km(CNW) = 0.58 ± 0.05 mg ml−1, and Km(H2O2) =2.8 ± 1.3 μm. The estimates of the values of the second-order rate constants for inactivation (ki) and catalysis (kcat/Km(H2O2)) are given in the figure.
Using designation of constants as defined in Cornish-Bowden (18), Ki(CNW) is the equilibrium dissociation constant for CNWs, Km(H2O2) and Km(CNW) are Michaelis constants for H2O2 and CNWs, respectively, kcat is the catalytic constant for oxidative cleavage, and n is the average number of soluble NAGeq released per one oxidative cleavage. The time-dependent [H2O2]t is related to the concentration of products according to [H2O2]t = [H2O2]t = 0 − [NAGeq]/n. [CBP21]tot is the total concentration of CBP21, and kiapp is as defined in Equation 4. Note that in Equation 5 [CNW] is time-invariant. This simplification was judged to be plausible under our experimental conditions (Fig. S4). Equation 5 has no analytical solution in terms of elementary functions unless further simplifying assumptions are made. At both extremes (low and high [H2O2]), Equation 5 can be approximated by the single exponential function in the form of Equation 1. However, the meaning of [NAGeq]max and kobs depends on whether the kinetics is governed by H2O2 depletion (low [H2O2]; see Equations S3–S5) or enzyme inactivation (high [H2O2]; see Equations S1 and S2) (see supporting discussion). Numerical solutions according to Equation 5 were in general accordance with the data (Fig. S5). We note that Equation 5 assumes that H2O2 is consumed only in the enzymatic reaction that leads to the oxidative cleavage of a glycosidic bond. The non-enzymatic consumption of H2O2 in the reaction with AscA was judged to be not significant in our experimental conditions (Fig. 1A and Table S1). (If the non-enzymatic consumption of H2O2 was significant, one would expect to see lower [NAGeq]max values at higher AscA concentrations, which was not the case as shown in Fig. 1A.) Notably, the consumption of H2O2 in enzymatic reactions that do not lead to the oxidative cleavage of a glycosidic bond cannot be excluded (i.e. a free enzyme could perhaps turn over a number of H2O2 molecules before inactivation occurs). Although not likely at low [H2O2], the latter scenario is plausible at high H2O2 concentrations. Different approaches to estimating the parameter values of Equation 5 yielded similar values and are summarized in Fig. 8.
Discussion
Since their recognition as oxidative enzymes (5, 6), LPMOs have been extensively studied. Over the past years, LPMOs have been implemented in commercial enzymatic mixtures and have become instrumental for the development of sustainable biorefinery processes (19). The recently discovered H2O2-driven mechanism of LPMOs opens new avenues for utilization of these abundant, phylogenetically widespread, but still enigmatic enzymes. Here, we present the first thorough kinetic characterization of H2O2-driven degradation of recalcitrant polysaccharide using one of the best studied LPMOs, chitin-active CBP21.
Notably, the kcat found here (5.6 s−1) is much higher than the apparent rate constants reported for the oxidation of chitin by CBP21 without adding H2O2 (0.02 s−1) (5). On that note, the highest reported turnover number for a cellulose-active LPMO is 0.25 s−1 (at 25 °C) (20). It remains to be clarified whether the rates of LPMO-catalyzed oxidation of polysaccharides measured without the addition of H2O2 reflect the direct reaction with O2 (11, 21) or possibly the reaction of LPMO with H2O2 generated in situ by either the LPMO itself (22–24) or the reaction of the reductant with O2 (25). In support of the second hypothesis, Bissaro et al. (1) have shown that a cellulose-active LPMO is totally inhibited when a peroxidase is added in a standard reaction mixture (i.e. no added H2O2) despite the presence of O2 and reductant. Importantly, CBP21 was highly efficient in H2O2 utilization with a kcat/Km(H2O2) value in the order of 106 m−1 s−1. This places CBP21 alongside peroxygenases in terms of catalytic efficiency (26, 27). Although CBP21 is inactivated by H2O2, chitin degradation is favored over enzyme inactivation by a factor of 103 (kcat/Km(H2O2) ≈ 106 m−1 s−1 versus ki ≈ 103 m−1 s−1; Fig. 8).
Enzyme inactivation is a well known issue in industrial applications of H2O2-utilizing enzymes in general (28). More generally, in the presence of redox species, such as transition metals, H2O2 can be transformed to highly reactive oxygen species that may damage biomolecules. For example, Scott et al. (29), who were not aware of the interplay between LPMOs and H2O2, showed that addition of catalase to an LPMO-containing commercial cellulolytic mixture led to improved saccharification efficiency and explained this as the catalase reducing H2O2-mediated oxidative inactivation of cellulases. As shown here and in Bissaro et al. (1), LPMO activity and stability are critically dependent on controlling [H2O2] and on the presence of saturating concentrations of the LPMO substrate. Importantly, optimal H2O2 concentrations are in the low micromolar range, i.e. much lower than the concentrations usually considered harmful. Because reduced LPMOs become inactivated in the presence of H2O2, the presence of saturating amounts of binding sites is important for LPMO stability. In nature, LPMO action on the substrate surface would be followed by regeneration of LPMO-binding sites by hydrolases that peel off the oxidized (and broken) chains on the substrate surface, thus making new surface available to the LPMO. It is thus conceivable that the discovery and potential industrial implementation of H2O2-driven LPMO reactions calls for a re-evaluation of the ratio of hydrolytic and oxidative enzymes in current enzyme mixtures.
Because the Km(H2O2) value for CBP21 is in the low micromolar range, it is impossible to supplement the reactions with initial H2O2 loads that would be sufficient for extended degradation of the substrate but would not harm the LPMO. Therefore, similarly to peroxygenases (30), gradual addition of H2O2 using pumps and in situ generation of H2O2 seem to be the most favorable options for fueling LPMO reactions. Existing data for cellulose-active LPMOs also indicate a low Km for H2O2 (1), and such a low Km is thus expected to be a common feature of all members of the LPMO superfamily. Importantly, studies on the degradation of Avicel with Cellic CTec2, an LPMO-containing commercial cellulase mixture, using bioreactors with controlled gradual addition of H2O2 have already shown good results: a gradual supply of H2O2, at low concentrations, gave stable LPMO activity over time, revealed a clear correlation between the amount of H2O2 supplied and the amount of LPMO products in the reaction mixtures, and led to high saccharification yields (1).
The apparently low Km(H2O2) values of LPMOs are of high relevance from a biological standpoint because low H2O2 levels are likely to be found in the natural environments of LPMOs. Housekeeping enzymes for H2O2, such as catalases, usually display low affinity for H2O2 (in the mm range) (31, 32), which is compatible with an H2O2-driven LPMO activity because the LPMO has a much higher affinity for H2O2. It has been shown that LPMOs can be fueled by a wide variety of reductants, including several redox enzymes that are commonly produced by biomass-degrading fungi, the most well known of which is cellobiose dehydrogenase (23, 33–36). Reductant effects are usually ascribed to the ability to reduce the LPMO to its Cu(I) state, but it is now clear that reductant effects on the H2O2 levels in reaction mixtures play a major role. Considering the present findings, it is tempting to speculate that H2O2 produced by strict oxidases, whose genes co-occur with lpmo genes in fungal genomes lacking cellobiose dehydrogenase (33), could play a role in fueling LPMO-catalyzed polysaccharide oxidation despite the fact that such oxidases are not capable of reducing the LPMO. Future kinetic studies dedicated to the interplay among various redox enzymes potentially involved in biomass conversion are of major interest.
Experimental procedures
Substrates and enzymes
CNWs were prepared essentially as described in Kuusk et al. (12): α-chitin from crab shells (Sigma C7170) was purified by sequential treatments with HCl (0.55 m), NaOH (0.3 m), ethanol, and acetone. The purified α-chitin was incubated at 100 °C in 3 m HCl for 90 min. The HCl-treated chitin was washed with water and sodium acetate (NaAc) buffer (50 mm, pH 6.1) followed by dialysis against methanol. 5 mCi of [1-14C]acetic anhydride (50 mCi mmol−1; Hartmann Analytic GmbH, Braunschweig, Germany) was added to the chitin (2 g) in methanol (85 ml) and incubated for 24 h with stirring at room temperature. To ensure complete N-acetylation, 1.86 ml of nonradioactive acetic anhydride was added (final concentration of 230 mm), and the overnight incubation was repeated. Next, O-deacetylation was carried out by adding KOH (to 100 mm) in methanol and incubating for 3 h at room temperature with stirring. The resulting CNWs were washed repeatedly with 47.86 mm NaOH via repeated centrifugation (5 min at 2,900 × g) and resuspension. Finally, 20% glacial acetic acid was added to adjust the pH to 6.1 after which 0.01% NaN3 was added, and the CNWs were stored at 4 °C. The total concentration of CNWs was expressed on the basis of dry weight, and the specific radioactivity of the CNW preparation was 4.18 × 10⁶ dpm mg−1. Non-labeled CNWs were prepared exactly as described above, but the treatment with [1-14C]acetic anhydride was omitted. The possible influence of NaN3 (used to avoid microbial contamination of the CNW stock solution) was tested in comparative experiments where CNWs were used as prepared above or thoroughly washed with buffer before use. No effect of NaN3 on the activity of CBP21 was observed (data not shown).
Ascorbic acid (Sigma A7506) stock solution (10 mm in water) was prepared less than 10 min before use. Dilutions of a commercial H2O2 stock solution (Honeywell lot number SZBG2070) with known concentration (30 weight %; 9.8 m) were prepared in water less than 10 min before use. The water was Milli-Q ultrapure water (>18.2 megaohms cm−1).
CBP21 was produced and purified as described previously (14). Purified CBP21 was saturated with copper. For that, CBP21 (144 μm) was incubated with CuSO4 (500 μm) in NaAc buffer at 25 °C for 22 h. The unbound copper was removed by extensive washing with NaAc buffer using an Amicon ultracentrifugation device equipped with a 5-kDa-cutoff membrane. The estimated concentration of free copper after washing (calculated from the total dilution factor) was 5 pm. The concentration of CBP21 was determined by measuring absorbance at 280 nm using a theoretical molar extinction coefficient of 29,450 m−1 cm−1.
CBP21 kinetics
Here, we describe the standard experimental setup for the degradation of CNWs by CBP21. All reactions were done in 1.5-ml polypropylene microcentrifuge tubes in NaAc buffer at 25 °C without stirring. Although there was no significant sedimentation of CNW suspension during the experiment (10 min), the suspension was mixed by pipetting before withdrawing samples at each sampling time point. All reagents were used as purchased. The water was Milli-Q ultrapure water (>18.2 megaohms cm−1).
Degradation of CNWs by CBP21
If not stated otherwise, the reaction mixture contained 14C-labeled CNW, CBP21 (50 nm), H2O2, and AscA (0.1 mm). The total volume of the reactions was 0.8 ml. CBP21 was added to CNWs, and after 5–10 min of incubation AscA was added. 30 s after the addition of AscA, the reactions were initiated (zero time point) by the addition of H2O2 to a desired concentration. The volume of the added H2O2 was less than 1% of the total volume so that the concentrations of the CBP21, CNWs, and AscA before the addition of H2O2 are essentially the same as their final concentrations. At selected time points, 0.1-ml aliquots were withdrawn and mixed with 25 μl of 1.0 m NaOH to stop the reaction. Non-labeled CNWs (to 3 mg ml−1) in 0.2 m NaOH were added to improve the sedimentation of the CNWs during centrifugation (12). After centrifugation (5 min at 104 × g), 50 μl of supernatant was withdrawn, and the radioactivity in the supernatant was measured using a scintillation counter (PerkinElmer Life Sciences). The sample for the zero time point was withdrawn before the addition of H2O2 and was treated as the other samples. The reading of the zero time point was subtracted from the readings of all time points. The reactions without the addition of H2O2 were performed exactly as described above with the addition of an equal amount of NaAc buffer instead of H2O2. If not stated otherwise, the readings of the experiments without the addition of H2O2 were subtracted from the readings of the experiments with H2O2. At least two independent replicates were carried out for each experiment (standard deviations (S.D.) are derived from at least two experiments).
Control reaction for the order of the addition of AscA and H2O2
The experiment was performed with CBP21 (50 nm), CNWs (1.0 mg ml−1), H2O2 (20 μm), and AscA (0.1 mm) as described above with an opposite order of addition of AscA and H2O2.
Calculation of the concentration of NAGeq from the radioactivity readings
Calculation of released NAG equivalents was done essentially as described in Kuusk et al. (12). Because the acetylation step needed to generate CNWs takes place under heterogeneous conditions, the 14C label is not expected to be distributed equally within the CNW microcrystals, and the relationship between released label and enzyme activity is not linear. Extensive analyses of chitinase activity on these CNWs (12) have shown that the release of reducing groups (a common indicator for the determination of the activity of hydrolytic enzymes) relates to the release of 14C label according to Equation 6.
| (Eq. 6) |
NAG2% represents the degree of solubilization of 14C-labeled CNWs on the basis of released NAG dimers (NAG2; chitobiose). 14C% represent the degree of solubilization of 14C-labeled CNWs on the basis of released radioactivity, and a and b are calibration constants. The values of the calibration constants were determined previously using calibration curves (12) that were made using parallel measurements of released radioactivity (14C) and reducing groups during hydrolysis of 14C-labeled CNWs with Serratia marcescens ChiA, an enzyme producing predominantly chitobiose (37). To find the concentration of NAGeq released by CBP21, the 14C% measured in the supernatants was first converted to NAG2% using Equation 6. Then the concentration of [NAG2] was found from NAG2% and the total amount of NAG2 in CNWs (2.46 μmol mg−1 CNWs). Finally, the [NAGeq] was calculated as [NAGeq] = 2[NAG2]. It is worth noting that although we used non-linear calibration the deviation of the calibration curve from linearity is not very prominent below a degree of solubilization of 4% (12), which is a higher degree of solubilization than the degree of solubilization reached in the experiments presented in this study.
Soluble versus insoluble oxidized products
To assess the total degree of substrate oxidation, reactions were set up as described above. In short, the reaction mixture contained non-labeled CNWs (1.0 mg ml−1) in NaAc buffer and CBP21 (50 nm), and reactions were initiated by the addition of AscA (100 μm) and, 30 s later, H2O2 (0–100 μm). A control reaction was carried out in the absence of CBP21 to assess the quantity of background products present in CNWs. After 10 min of reaction (25 °C; no stirring), all the reactions were incubated for 15 min at 98 °C to heat-inactivate CBP21, half of the mixture was filtrated to recover the soluble fraction, and the other half constituted the total fraction (containing insoluble and soluble products). 5 μl of a mixture of chitinases (ChiA and ChiC; 3 μm final concentration) and a chitobiase (4 μm final concentration) from S. marcescens prepared in 20 mm Tris-HCl, pH 8.0, was added to 50 μl of the samples to hydrolyze the mixture of products down to N-acetylglucosamine and chitobionic acid as final and only products (23). The soluble fractions were hydrolyzed by the chitobiase only (4 μm final concentration); ChiA and ChiC were replaced by equivalent volumes of Tris-HCl buffer (20 mm, pH 8.0). Hydrolysis reactions were incubated at 40 °C overnight. ChiA, ChiC, and the chitobiase were produced in-house as described previously (14, 38). Reaction products were analyzed by high-performance anion-exchange chromatography and monitored by pulsed amperometric detection using a Dionex Bio-LC equipped with a CarboPac PA1 column as described previously for cello-oligosaccharides (39). Chitobionic acid was quantified using a standard obtained by oxidation of chitobiose by a chito-oligosaccharide oxidase as described previously (38).
Binding of CBP21 to CNWs in the absence of added H2O2
In the binding experiment, CBP21 (100 nm) was incubated with non-labeled CNWs (at different concentrations) in the presence of AscA (0.1 mm). After 5 min, the CNWs were pelleted by centrifugation (1 min at 104 × g). The concentration of unbound CBP21 was estimated by measuring CBP21 activity in the supernatant using 14C-labeled CNWs as substrate. To do this, the labeled CNWs and a fresh portion of AscA were added to the supernatant. 30 s after the addition of fresh AscA, the reaction was initiated by the addition of H2O2, and the release of 14C-labeled products (in NAGeq) was measured. The final concentrations of 14C-labeled CNWs, fresh AscA, and H2O2 were 1.0 mg ml−1, 0.05 mm, and 20 μm, respectively. In this procedure, the supernatant of the binding reaction was diluted 2-fold, meaning that the maximal (i.e. no binding of CBP21 to non-labeled CNWs) total concentration of CBP21 in the activity measurement was 50 nm. The control experiment ([CNW] = 0 mg ml−1) was undertaken exactly as described above without the non-labeled CNWs in the binding experiment. The results of the binding experiments were analyzed according to Equation 7.
| (Eq. 7) |
In Equation 7, [CNW] is the concentration of CNWs in the binding experiment, and Ki(CNW) is the concentration of CNWs at which 50% of the CBP21 molecules are bound to CNWs and 50% are free in the solution.
Author contributions
P. V., M. S., and V. G. H. E. conceived and coordinated the study. S. K., B. B., and P. V. designed, performed, and analyzed the experiments. Z. F. performed experiments. P. K. derived the rate equations. S. K., P. V., B. B., M. S., and V. G. H. E. wrote the paper. All authors reviewed the results and approved the final version of the manuscript.
Supplementary Material
This work was supported by Estonian Research Council Grant PUT1024 and Norwegian Financial Mechanism Grant EMP171. The authors declare that they have no conflicts of interest with the contents of this article.
This article contains Figs. S1–S5, Table S1, Equations S1–S5, and supporting discussion.
- LPMO
- lytic polysaccharide monooxygenase
- AscA
- ascorbic acid
- CBP21
- chitin active lytic polysaccharide monooxygenase from S. marcescens
- CNW
- chitin nanowhisker
- NaAc
- sodium acetate
- NAG
- N-acetylglucosamine
- NAGeq
- N-acetylglucosamine equivalents
- GO
- glucose oxidase.
References
- 1. Bissaro B., Røhr Å. K., Müller G., Chylenski P., Skaugen M., Forsberg Z., Horn S. J., Vaaje-Kolstad G., and Eijsink V. G. H. (2017) Oxidative cleavage of polysaccharides by monocopper enzymes depends on H2O2. Nat. Chem. Biol. 13, 1123–1128 10.1038/nchembio.2470 [DOI] [PubMed] [Google Scholar]
- 2. Martínez A. T. (2016) How to break down crystalline cellulose. Science 352, 1050–1051 10.1126/science.aaf8920 [DOI] [PubMed] [Google Scholar]
- 3. Isaksen T., Westereng B., Aachmann F. L., Agger J. W., Kracher D., Kittl R., Ludwig R., Haltrich D., Eijsink V. G., and Horn S. J. (2014) A C4-oxidizing lytic polysaccharide monooxygenase cleaving both cellulose and cello-oligosaccharides. J. Biol. Chem. 289, 2632–2642 10.1074/jbc.M113.530196 [DOI] [PMC free article] [PubMed] [Google Scholar]
- 4. Simmons T. J., Frandsen K. E. H., Ciano L., Tryfona T., Lenfant N., Poulsen J. C., Wilson L. F. L., Tandrup T., Tovborg M., Schnorr K., Johansen K. S., Henrissat B., Walton P. H., Lo Leggio L., and Dupree P. (2017) Structural and electronic determinants of lytic polysaccharide monooxygenase reactivity on polysaccharide substrates. Nat. Commun. 8, 1064 10.1038/s41467-017-01247-3 [DOI] [PMC free article] [PubMed] [Google Scholar]
- 5. Vaaje-Kolstad G., Westereng B., Horn S. J., Liu Z., Zhai H., Sørlie M., and Eijsink V. G. (2010) An oxidative enzyme boosting the enzymatic conversion of recalcitrant polysaccharides. Science 330, 219–222 10.1126/science.1192231 [DOI] [PubMed] [Google Scholar]
- 6. Quinlan R. J., Sweeney M. D., Lo Leggio L., Otten H., Poulsen J.-C., Johansen K. S., Krogh K. B., Jørgensen C. I., Tovborg M., Anthonsen A., Tryfona T., Walter C. P., Dupree P., Xu F., Davies G. J., et al. (2011) Insights into the oxidative degradation of cellulose by a copper metalloenzyme that exploits biomass components. Proc. Natl. Acad. Sci. U.S.A. 108, 15079–15084 10.1073/pnas.1105776108 [DOI] [PMC free article] [PubMed] [Google Scholar]
- 7. Forsberg Z., Vaaje-Kolstad G., Westereng B., Bunæs A. C., Stenstrøm Y., MacKenzie A., Sørlie M., Horn S. J., and Eijsink V. G. (2011) Cleavage of cellulose by a CBM33 protein. Protein Sci. 20, 1479–1483 10.1002/pro.689 [DOI] [PMC free article] [PubMed] [Google Scholar]
- 8. Phillips C. M., Beeson W. T., Cate J. H., and Marletta M. A. (2011) Cellobiose dehydrogenase and a copper-dependent polysaccharide monooxygenase potentiate cellulose degradation by Neurospora crassa. ACS Chem. Biol. 6, 1399–1406 10.1021/cb200351y [DOI] [PubMed] [Google Scholar]
- 9. Frandsen K. E., Simmons T. J., Dupree P., Poulsen J.-C., Hemsworth G. R., Ciano L., Johnston E. M., Tovborg M., Johansen K. S., von Freiesleben P., Marmuse L., Fort S., Cottaz S., Driguez H., Henrissat B., et al. (2016) The molecular basis of polysaccharide cleavage by lytic polysaccharide monooxygenase. Nat. Chem. Biol. 12, 298–303 10.1038/nchembio.2029 [DOI] [PMC free article] [PubMed] [Google Scholar]
- 10. Vaaje-Kolstad G., Forsberg Z., Loose J. S., Bissaro B., and Eijsink V. G. (2017) Structural diversity of lytic polysaccharide monooxygenases. Curr. Opin. Struct. Biol. 44, 67–76 10.1016/j.sbi.2016.12.012 [DOI] [PubMed] [Google Scholar]
- 11. Walton P. H., and Davies G. J. (2016) On the catalytic mechanisms of lytic polysaccharide monooxygenases. Curr. Opin. Chem. Biol. 31, 195–207 10.1016/j.cbpa.2016.04.001 [DOI] [PubMed] [Google Scholar]
- 12. Kuusk S., Sørlie M., and Väljamäe P. (2015) The predominant molecular state of bound enzyme determines the strength and type of product inhibition in the hydrolysis of recalcitrant polysaccharides by processive enzymes. J. Biol. Chem. 290, 11678–11691 10.1074/jbc.M114.635631 [DOI] [PMC free article] [PubMed] [Google Scholar]
- 13. Kari J., Andersen M., Borch K., and Westh P. (2017) An inverse Michaelis-Menten approach for interfacial enzyme kinetics. ACS Catal. 7, 4904–4914 10.1021/acscatal.7b00838 [DOI] [Google Scholar]
- 14. Vaaje-Kolstad G., Houston D. R., Riemen A. H., Eijsink V. G., and van Aalten D. M. (2005) Crystal structure and binding properties of the Serratia marcescens chitin-binding protein CBP21. J. Biol. Chem. 280, 11313–11319 10.1074/jbc.M407175200 [DOI] [PubMed] [Google Scholar]
- 15. Suzuki K., Suzuki M., Taiyoji M., Nikaidou N., and Watanabe T. (1998) Chitin binding protein (CBP21) in the culture supernatant of Serratia marcescens 2170. Biosci. Biotechnol. Biochem. 62, 128–135 10.1271/bbb.62.128 [DOI] [PubMed] [Google Scholar]
- 16. Nakagawa Y. S., Eijsink V. G., Totani K., and Vaaje-Kolstad G. (2013) Conversion of α-chitin substrates with varying particle size and crystallinity reveals substrate preferences of the chitinases and lytic polysaccharide monooxygenase of Serratia marcescens. J. Agric. Food Chem. 61, 11061–11066 10.1021/jf402743e [DOI] [PubMed] [Google Scholar]
- 17. Yang Y., Li J., Liu X., Pan X., Hou J., Ran C., and Zhou Z. (2017) Improving extracellular production of Serratia marcescens lytic polysaccharide monooxygenase CBP21 and Aeromonas veronii B565 chitinase Chi92 in Escherichia coli and their synergism. AMB Express 7, 170 10.1186/s13568-017-0470-6 [DOI] [PMC free article] [PubMed] [Google Scholar]
- 18. Cornish-Bowden A. (1999) Fundamentals of Enzyme Kinetics, Portland Press Ltd., London [Google Scholar]
- 19. Johansen K. S. (2016) Discovery and industrial applications of lytic polysaccharide mono-oxygenases. Biochem. Soc. Trans. 44, 143–149 10.1042/BST20150204 [DOI] [PubMed] [Google Scholar]
- 20. Cannella D., Möllers K. B., Frigaard N.-U., Jensen P. E., Bjerrum M. J., Johansen K. S., and Felby C. (2016) Light-driven oxidation of polysaccharides by photosynthetic pigments and a metalloenzyme. Nat. Commun. 7, 11134 10.1038/ncomms11134 [DOI] [PMC free article] [PubMed] [Google Scholar]
- 21. Kim S., Ståhlberg J., Sandgren M., Paton R. S., and Beckham G. T. (2014) Quantum mechanical calculations suggest that lytic polysaccharide monooxygenases use a copper-oxyl, oxygen-rebound mechanism. Proc. Natl. Acad. Sci. U.S.A. 111, 149–154 10.1073/pnas.1316609111 [DOI] [PMC free article] [PubMed] [Google Scholar]
- 22. Kittl R., Kracher D., Burgstaller D., Haltrich D., and Ludwig R. (2012) Production of four Neurospora crassa lytic polysaccharide monooxygenases in Pichia pastoris monitored by a fluorimetric assay. Biotechnol. Biofuels 5, 79 10.1186/1754-6834-5-79 [DOI] [PMC free article] [PubMed] [Google Scholar]
- 23. Loose J. S., Forsberg Z., Kracher D., Scheiblbrandner S., Ludwig R., Eijsink V. G., and Vaaje-Kolstad G. (2016), Activation of bacterial lytic polysaccharide monooxygenases with cellobiose dehydrogenase. Protein Science 25, 2175–2186 10.1002/pro.3043 [DOI] [PMC free article] [PubMed] [Google Scholar]
- 24. Ladevèze S., Haon M., Villares A., Cathala B., Grisel S., Herpoël-Gimbert I., Henrissat B., and Berrin J.-G. (2017) The yeast Geotrichum candidum encodes functional lytic polysaccharide monooxygenases. Biotechnol. Biofuels 10, 215 10.1186/s13068-017-0903-0 [DOI] [PMC free article] [PubMed] [Google Scholar]
- 25. Holtmann D., and Hollmann F. (2016) The oxygen dilemma: a severe challenge for the application of monooxygenases? ChemBioChem 17, 1391–1398 10.1002/cbic.201600176 [DOI] [PMC free article] [PubMed] [Google Scholar]
- 26. Hofrichter M., and Ullrich R. (2014) Oxidations catalyzed by fungal peroxygenases. Curr. Opin. Chem. Biol. 19, 116–125 10.1016/j.cbpa.2014.01.015 [DOI] [PubMed] [Google Scholar]
- 27. Matthews S., Belcher J. D., Tee K. L., Girvan H. M., McLean K. J., Rigby S. E., Levy C. W., Leys D., Parker D. A., Blankley R. T., and Munro A. W. (2017) Catalytic determinants of alkene production by the cytochrome P450 peroxygenase OleTJE. J. Biol. Chem. 292, 5128–5143 10.1074/jbc.M116.762336 [DOI] [PMC free article] [PubMed] [Google Scholar]
- 28. Valderrama B., Ayala M., and Vazquez-Duhalt R. (2002) Suicide inactivation of peroxidases and the challenge of engineering more robust enzymes. Chem. Biol. 9, 555–565 10.1016/S1074-5521(02)00149-7 [DOI] [PubMed] [Google Scholar]
- 29. Scott B. R., Huang H. Z., Frickman J., Halvorsen R., and Johansen K. S. (2016) Catalase improves saccharification of ligocellulose by reducing lytic polysaccharide monooxygenase-associated enzyme inactivation. Biotechnol. Lett. 38, 425–434 10.1007/s10529-015-1989-8 [DOI] [PMC free article] [PubMed] [Google Scholar]
- 30. Ni Y., Fernández-Fueyo E., Gomez Baraibar A., Ullrich R., Hofrichter M., Yanase H., Alcalde M., van Berkel W. J., and Hollmann F. (2016) Peroxygenase-catalyzed oxyfunctionalization reactions promoted by the complete oxidation of methanol. Angew. Chem. Int. Ed. Engl. 55, 798–801 10.1002/anie.201507881 [DOI] [PubMed] [Google Scholar]
- 31. Switala J., and Loewen P. C. (2002) Diversity of properties among catalases. Arch. Biochem. Biophys. 401, 145–154 10.1016/S0003-9861(02)00049-8 [DOI] [PubMed] [Google Scholar]
- 32. Mishra S., and Imlay J. (2012) Why do bacteria use so many enzymes to scavenge hydrogen peroxide. Arch. Biochem. Biophys. 525, 145–160 10.1016/j.abb.2012.04.014 [DOI] [PMC free article] [PubMed] [Google Scholar]
- 33. Kracher D., Scheiblbrandner S., Felice A. K., Breslmayr E., Preims M., Ludwicka K., Haltrich D., Eijsink V. G., and Ludwig R. (2016) Extracellular electron transfer systems fuel cellulose oxidative degradation. Science 352, 1098–1101 10.1126/science.aaf3165 [DOI] [PubMed] [Google Scholar]
- 34. Garajova S., Mathieu Y., Beccia M. R., Bennati-Granier C., Biaso F., Fanuel M., Ropartz D., Guigliarelli B., Record E., Rogniaux H., Henrissat B., and Berrin J. G. (2016) Single-domain flavoenzymes trigger lytic polysaccharide monooxygenases for oxidative degradation of cellulose. Sci. Rep. 6, 28276 10.1038/srep28276 [DOI] [PMC free article] [PubMed] [Google Scholar]
- 35. Frommhagen M., Koetsier M. J., Westphal A. H., Visser J., Hinz S. W., Vincken J. P., van Berkel W. J., Kabel M. A., and Gruppen H. (2016) Lytic polysaccharide monooxygenases from Myceliophthora thermophila C1 differ in substrate preference and reducing agent specificity. Biotechnol. Biofuels 9, 186 10.1186/s13068-016-0594-y [DOI] [PMC free article] [PubMed] [Google Scholar]
- 36. Frommhagen M., Mutte S. K., Westphal A. H., Koetsier M. J., Hinz S. W. A., Visser J., Vincken J.-P., Weijers D., van Berkel W. J. H., Gruppen H., and Kabel M. A. (2017) Boosting LPMO-driven lignocelluloses degradation by polyphenol oxidase-activated lignin building blocks. Biotechnol. Biofuels 10, 121 10.1186/s13068-017-0810-4 [DOI] [PMC free article] [PubMed] [Google Scholar]
- 37. Hamre A. G., Lorentzen S. B., Väljamäe P., and Sørlie M. (2014) Enzyme processivity changes with the extent of recalcitrant polysaccharide degradation. FEBS Lett. 588, 4620–4624 10.1016/j.febslet.2014.10.034 [DOI] [PubMed] [Google Scholar]
- 38. Loose J. S., Forsberg Z., Fraaije M. W., Eijsink V. G., and Vaaje-Kolstad G. (2014) A rapid quantitative activity assay shows that the Vibrio cholerae colonization factor GbpA is an active lytic polysaccharide monooxygenase. FEBS Lett. 588, 3435–3440 10.1016/j.febslet.2014.07.036 [DOI] [PubMed] [Google Scholar]
- 39. Westereng B., Agger J. W., Horn S. J., Vaaje-Kolstad G., Aachmann F. L., Stenstrøm Y. H., and Eijsink V. G. (2013) Efficient separation of oxidized cello-oligosaccharides generated by cellulose degrading lytic polysaccharide monooxygenases. J. Chromatogr. A 1271, 144–152 10.1016/j.chroma.2012.11.048 [DOI] [PubMed] [Google Scholar]
Associated Data
This section collects any data citations, data availability statements, or supplementary materials included in this article.