Abstract
The focused transmit beam is a standard tool for clinical ultrasound scanning, concentrating energy from a number of array elements toward an imaging target. However, above and below the transmit focus, much of the energy in the beam is spread in a broadened main lobe and long off-axis tails that are ignored by conventional beamforming methods. This work proposes a method to decompose a set of focused transmit beams into their constituent components – diverging waves from individual array elements. The recovery of this complete data set enables synthetic transmit focusing at all points in the field of view without beam shape or focal depth artifacts commonly associated with virtual source synthetic aperture beamforming. An efficient frequency-domain linear decoding implementation is introduced. The principles of the method are demonstrated both in transmit field simulations and experimental imaging. At depth, up to a 9.6 dB improvement in electronic signal-to-noise ratio and 8.9 dB improvement in contrast were observed in comparison to conventional dynamic receive beamforming. The proposed method is broadly applicable to existing scan sequences and requires only channel data for processing.
I. Introduction
Ultrasound beamforming can be broadly described as the process of combining acoustic signals based on assumptions about propagation. Receive beamforming in modern ultra-sound is performed by delaying the received channel signals across an array based on geometric path length differences between the location of interest and each receiving array element [1]. This achieves a dynamic receive focus, coherently collecting the backscattered echoes from a narrow beam at all depths with lateral resolution limited by diffraction according to the array extent. On transmit, however, only a single delay value can be selected for the waves that then propagate to all depths to be sampled. The fixed transmit focus is only optimum within a small depth of field around the selected focal depth. Outside of this range, the propagating wavefront is laterally spread away from the center of the beam, degrading resolution and electronic signal-to-noise ratio (SNR) of the reconstructed image.
Synthetic transmit aperture methods take a different approach to beamforming in order to optimize transmit focusing at all depths in the image. As implied by the name, these techniques sample data corresponding to different transmit elements or subapertures. From a single active element moved in space [2] or multiplexed on an array [3], the source is approximately a point and the transmission is assumed to be spherically diverging. By accounting for the time for spherical propagation of the wave from each transducer position to each point to be reconstructed and coherently summing across transmit events, the optimum transmit focusing is achieved at all image points. When the backscattered echoes are recorded on the full array rather than a single element, this sampling produces the “complete” (also “STA”, or “multistatic”) data set – backscattered echoes corresponding to each transmit element and receive channel pair.
One drawback of transmitting on individual elements is reduced SNR compared to focused transmission. While the transmit voltage can be safely increased under FDA limits when using individual elements, transmit energy and corresponding backscattered echo amplitude is limited by the maximum piezoelectric element response. Many methods have been proposed to increase the signal amplitude while maintaining the complete data set. Multiple elements can be grouped together to emit an approximation to a diverging wave with higher amplitude at the expense of reduced angular spread of the diverging transmit beam [4]. Spatial coding can be used to transmit on multiple elements simultaneously while retaining the ability to recover individual transmit element responses on receive, boosting the total emitted energy without increasing acquisition time. Hadamard coding [5] and delay-encoded transmission [6] use all elements in each firing with varying pulse polarity (or phasing to approximate inversion). S-sequence encoding [7] removes the requirement for pulse inversion by using a binary coding, but utilizes a subset of elements on each transmission and achieves only a partial boost in SNR. If enabled by the transmit hardware, SNR can be further improved with spatio-temporal codes that use long coded pulses to increase the acoustic output [8].
Focused transmit beams still have several advantages including compatibility with existing scanner architectures, increased harmonic wave generation, and direct control over the field-of-view of the pulse sequence. Many techniques to perform synthetic transmit focusing with the data from fixed transmit focus beams have been demonstrated [9]–[13] and are commonly used in some form on commercial ultrasound scanners. Viewing the focal point as a “virtual source”, the transmit wave field appears as diverging waves deep and shallow to the focus and can therefore be processed as if each virtual source, corresponding to each focused transmission, were a transmitting array element. However, this processing model limits the degrees of freedom in post-processing the data compared to using the complete data set. Each transmit beam covers only a limited spatial region with especially little overlap between beams near the transmit focal depth. As opposed to allowing the application of weights or delays to individual transmit element responses, as with the complete data set, the virtual source model restricts these operations to the signals from entire transmit beams. Additionally, these models require the characterization of the spatial extent of each beam, and introduce a discontinuity artifact at the focal depth (although models have been introduced to remove this [13]).
This work proposes a new method to isolate the contributions of individual transmit elements from within a set of focused transmissions, recovering the complete data set. Similar to the previously described synthetic transmit methods, the resulting data set is used to achieve an optimum transmit focus at all points in the reconstructed image and improve SNR over the single-element transmission case. It differs in that rather than using the virtual source model, it recombines the recorded data to estimate the responses from individual transmit elements, each of which corresponds to a spherically diverging wave independent of the original focal geometry. Some methods are shared with work previously presented in [14].
This paper is organized as follows: Section II introduces the theoretical basis and an algorithm for recovering the complete data set from focused transmit beams. Section III describes the simulation and experimental methods used in this paper. Results are presented in Section IV to demonstrate synthetic isolation of the transmit fields from individual elements in simulation and perform experimental validation against conventional beamforming methods. Possible implications and applications of the proposed method are discussed in Section V.
II. Theory
A. Isolation of individual element contributions
For an ultrasound array with M physical elements, transmit elements T and receiving elements R are located at array positions T, R ∈ [1, …, M]. The pulse-echo response signal observed by transmitting on T and receiving on R is uT R(t), where t is time. The collection of these responses over all element pairs is hereby referred to as the “complete data set”.
The total signal observed by an element R for a focused transmit beam n is the weighted sum of the delayed individual responses:
| (1) |
where wnT is the transmit apodization for each element T and beam n, and τnT is the applied transmit delay:
| (2) |
for the origin On and focal point Fn of the transmit beam n and speed of sound c.
A scanning sequence is made up of N focused transmit beams where n ∈ [1, …, N]. Each transmit beam is focused at a different point Fn such that the applied delays τnT vary. The goal of the proposed algorithm is to isolate the response to an element T by coherently summing its contributions across transmit events. The first step is to undo the applied delays for the selected element by time shifting the recorded signal snR(t) for each transmit beam.
Once these delays have been removed, the sum across transmit events provides an estimate of the pulse-echo response for the element pair T, R:
| (3) |
where the denominator corrects for the applied apodization weights.
Beamforming of this data set is performed using typical diverging wave focusing methods, assuming spherical propagation from the transmit element T to the pixel P and back to the receive element R. The beamformed signal at each pixel rP is given by the sum of the estimated responses across transmit and receive elements:
| (4) |
where wTP and wRP are transmit and receive apodization weights respectively.
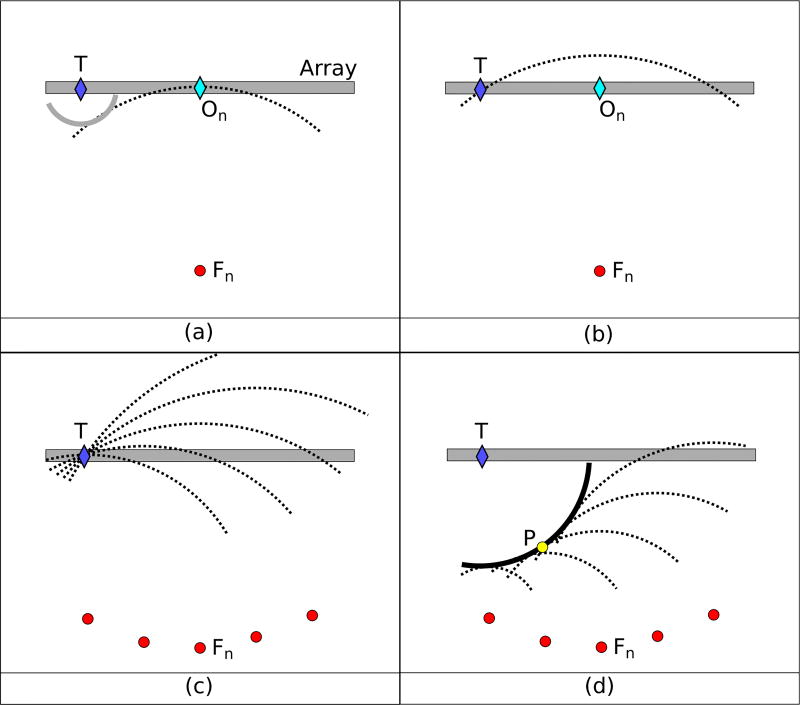
Fig. 1 diagrams the result of these operations on the effective transmit pressure field. Fig. 1(a) shows the array configuration and transmit pressure field for a single transmit beam n at the time after all elements have transmitted, the last of which is located at the beam origin On. The focused transmit beam (dashed line) is the superposition of individual element transmissions, including the solid line representing the contribution of element T. The focused wave converges toward the focal point later in time as all contributing waves propagate radially and coherently combine along the focused wavefront. Fig. 1(b) shows the transmit pressure field for one transmission after the applied time shift τnT is removed such that the focused wave passes through T. The parts of the dashed line behind the array have yet to be transmitted but indicate the geometry of the focused beam. Fig. 1(c) shows the transmit pressure field that results from the superposition of all of the delayed transmit beams. The delayed beams intersect at the element T, forming an effective point source that represents the isolated element contribution. Fig. 1(d) shows the transmit pressure field at the time after propagation of the isolated element pressure field from T to P. The individual transmit beams (dashed lines) have propagated toward their respective focal points and their superposition coherently traces out the diverging wave from T (solid line). The contributions from other elements are still present in the summed pressure field, but the waves are spread throughout space and destructively interfere where they overlap away from the coherent wavefront. Their contributions to the recorded signal are therefore small compared to the synthesized diverging wave.
Fig. 1.
(a) The transmit event focused at point Fn is referenced in time to the beam origin On, the last point on the array to transmit the wave. The focused wavefront (dashed line) is made up of individual spherically diverging waves including from transmit element T (solid line). (b) The time is calculated at which the wave was emitted from the transmit element T for transmit event n (in this case prior to On). (c) The superposition of the transmit fields from multiple elements forms an effective point source at T where their profiles intersect. (d) Propagation of the individual focused beams away from T form an effective diverging wavefront (solid line) that intersects the point to be imaged P. The other components of the individual focused beams (dashed lines) remain as background components of the transmit pressure field.
B. Frequency domain implementation
The above time-shift implementation of the proposed method provides an intuitive description of focusing and the synthesized transmit pressure field, but it is inefficient compared to typical synthetic transmit beamforming techniques. This section describes an equivalent and more computationally efficient implementation in the frequency domain.
In the frequency domain, each time shift becomes a complex phase shift at each angular frequency ω. Focusing the array on transmission can be viewed as a time-shift spatial encoding of the transmit elements. For each transmission, elements receive a time shift of τnT and are summed together to form the focused wave. The encoding matrix H contains one column for each transmitted beam, where rows represent the phase shift corresponding to each element:
| (5) |
Note that this matrix is not necessarily square or of full rank, and may actually have fewer columns (transmit events) than rows (elements). The Fourier transform of the backscattered response from individual elements is U = [U1, U2, …UM], where each UT is a vector corresponding to the set of receiving elements. The Fourier transform of the recorded backscattered response from the focused transmissions S = [S1, S2, …SN] is described by the linear system:
| (6) |
Applying the transmit delay adjustment as previously described requires applying the opposite phase shift −τnT for the selected element T to the recorded data from each beam and summing over all transmissions. This ensures that the desired individual element response has its phase exactly canceled while the other components retain varying phase shifts across the set of transmit events. The conjugate transpose H* of the encoding matrix produces this time shift and summation across transmissions:
| (7) |
This matrix is applied to the recorded data to recover estimates of the individual element responses Û:
| (8) |
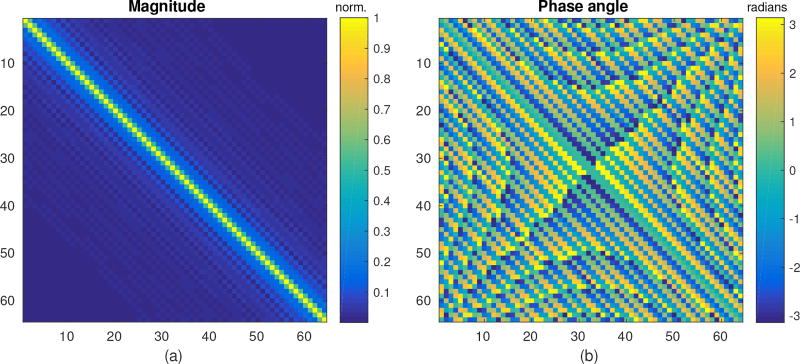
The extent to which this estimate matches the original element responses is determined by the encoding/decoding term (HH*). Ideally, the encoding/decoding would equal the identity matrix and perfectly recover U. Fig. 2 shows the mathematical result of encoding/decoding in magnitude and phase plots calculated at the center frequency. The parameters for this example were a 64 element array with 0.3 mm pitch with center frequency 3 MHz, focused at 4 cm and steered from [−30, 30] degrees in 0.5 degree increments. The significance of this result will be discussed further in Section V.
Fig. 2.
(a) Magnitude and (b) phase of HH* at ω = 2πf0 for f0 =3 MHz for a sample phased array scan (described in the text). The plots show magnitude and phase recovery of the transmit elements represented by the main diagonal, with some coherent contribution of neighboring elements. Other elements contribute incoherently and at lower magnitude.
III. Methods
A. Transmit simulation
Simulation of the transmit pressure field from a focused beam scan was performed using Field II [15], [16]. The transducer configuration is described in Table I.
TABLE I.
Field II simulation settings
| Parameter | Value | Unit |
|---|---|---|
|
| ||
| Array geometry | phased | - |
| Number of elements | 64 | elements |
| Element pitch | 0.3 | mm |
| Center frequency | 3 | MHz |
| Fractional bandwidth | 0.8 | - |
| Focal depth | 40 | mm |
| Steering angles | [−30,30] | degrees |
| Steering angle step | 0.25 | degrees |
| Transmit apodization | rectangular | - |
The simulated data were used to evaluate the coherent isolation of the transmit beam components. Time/pressure traces snP (t) were recorded for points P representing a 20 cm lateral × 12 cm axial Cartesian field for each steered transmit beam n. The simulated signals were processed with a 2nd-order Butterworth high pass filter with 100 kHz cutoff to remove low frequency simulation noise without affecting the RF data.
The synthetic transmit pressure trace rT (t) from a particular transmit element T at a fixed point in space P0 = (0, 40) mm (lateral, axial) was formed by delay and summation of the recorded signals:
| (9) |
The frequency spectra for the pulses were characterized by fitting a Gaussian function to the Fourier transform of the pulse to find the center frequency and fractional bandwidth.
Similarly, the synthetic transmit field rTP from an element T at a fixed time, as the wave intersects the point P0 = (0, 40) mm, was formed by interpolation of the recorded signals. This method is different from the proposed beamforming method in that the same propagation delay was applied for each spatial point, showing the entire field at a snapshot in time:
| (10) |
In each case, two sample array elements T located at (0.13, 0) mm and (8.09, 0) mm (the middle and edge of the array) were used. For comparison, an “ideal” case was simulated for each element T by applying transmit apodization to isolate only the desired element and produce a diverging wave. The simulated transmit focal timings and subsequent analysis were performed identically for this data set, providing a control for the full aperture case.
Parameter selection was studied by subsampling the recorded transmit pressure field data in the transmit event dimension. The transmit pressure field of (10) was calculated for a range of reduced angular spans and increased angular step sizes.
B. Phantom experiments
The proposed technique was demonstrated experimentally and directly compared to conventional sequences and beamforming methods. RF channel data were acquired and stored for offline processing using the Verasonics Vantage 256 ultrasound scanner and the P4-2v phased array transducer (Verasonics Inc., Redmond, WA, USA). The transducer had 64 elements, 0.3 mm pitch, and was operated with a center frequency of 2.98 MHz. Transmit voltage for all acquisitions was fixed at 1.6 V to make the impact of SNR at depth visible. The scan sequences used were:
Focused – focused transmissions were steered to mimic the scan sequence described in Table I (241 transmissions). However, an apex 9.6 mm behind the array was used as the scan origin. Focal points were calculated as 40 mm from the intersection of the steering vector from the apex and the surface of the array.
Complete data set – transmissions were sequentially performed from each individual element (64 transmissions).
Hadamard coded – element amplitudes were binary-coded according to rows of the 64-element Hadamard matrix [5].
Two imaging targets were used to characterize performance – wire targets and anechoic lesion targets. The wire target was a 0.2 mm diameter monofilament suspended in a water tank (sound speed approximately 1480 m/s). The target was adjusted to 2 cm and 4 cm from the transducer face and imaged in cross-section to provide a lateral point spread function. The anechoic lesion targets were imaged in the ATS Model 549 General and Small Parts phantom (sound speed approximately 1452 m/s) and had diameters of 3, 4, 6, and 8 mm. The transducer was fixed relative to each target during all three acquisitions, providing matched data sets. Two sequential frames were obtained for each sequence for the lesion target case to characterize temporal SNR.
The focused receive data were processed in two ways – dynamic receive focusing and the proposed method. Standard dynamic receive beamforming was used to form one A-line for each transmission, with no parallel receive beamforming or beam interpolation. The proposed method was implemented using the Fourier-domain recovery of the complete data set as described in Section II-B, followed by standard diverging wave beamforming of the recovered complete data set. Processing was repeated for the data set after subsampling the transmission data to achieve 1 degree beam spacing (61 transmissions). The complete data set and Hadamard coded data sets were processed for comparison. The complete data set was processed using standard diverging wave beamforming, just as in the proposed method. The Hadamard coded data set was first decoded by multiplying each time sample of the (receive channel × transmit event) data set by the transpose of the Hadamard matrix. The decoded data was then processed using standard diverging wave beamforming. Image reconstruction was limited to an F-number of 0.75 in transmit for the diverging wave methods and receive for all cases.
Lateral beam profiles were obtained by extracting the log-compressed envelope image row containing the maximum amplitude from each wire target image. Resolution was measured by the full-width at half-maximum (FWHM), the lateral extent of the envelope above −6 dB. Contrast was measured as for the mean envelope value inside the lesion μi and in the background μo. Temporal SNR was estimated using the normalized cross-correlation of speckle regions from the two frames of image data. Using the speckle region between the lesions from −7 to −3 mm and a 10 mm axial kernel, 2-D patches of RF data from the two frames were used to produce a correlation ρ for each depth. SNR was then estimated as in [17]:
| (11) |
The lesion phantom images are displayed on a 50 dB dynamic range after normalizing the mean and standard deviation of a speckle region near the focus (−7 < x < 10, 43 < z < 50 mm) to the dynamic receive image. The above image metrics were calculated before the normalization was applied.
IV. Results
A. Transmit simulation
One goal of recovering the complete data set is to retrospectively perform transmit focusing throughout the field. For each recovered element signal, the effective transmit pressure field should be a spherically diverging wave with its origin at the element location T. The coherent combination of all of the element signals with this diversity in spatial frequency content achieves transmit focusing.
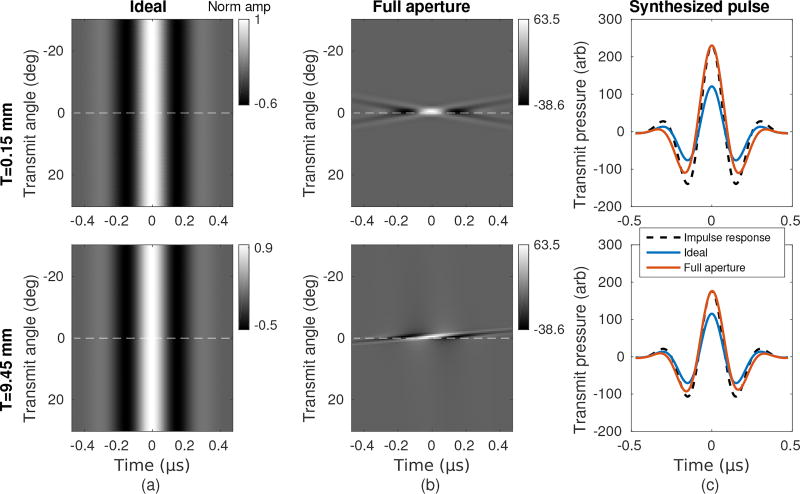
Simulation of the transmit pressure field allows a direct examination of the isolation of the desired individual element responses. In the same way that beamforming with the proposed method is performed, the synthetic transmit pressure field was obtained by applying focal delays to each transmission and coherently summing across transmit events. Successful isolation of each component was directly compared to a simulated transmission from the corresponding single element. Sample elements in the center of the array, T = 0.15 mm, and at the edge of the array T = 9.45 mm, were chosen for the following analysis assuming that the elements between them behave similarly.
The synthesized pulse as viewed from a single spatial position, in this example P = (0, 40) mm, should match the impulse response of the individual transducer element. The selected position is at the transmit focal depth, where virtual source methods fail to decompose the contributions of individual elements, but could be placed anywhere in the field. Fig. 3(a) shows the ideal response from a single element, constant over steering angles because there is no interference from other elements. Fig. 3(b) shows the response from the focused aperture over the set of steering angles (60 degree span, 0.25 degree spacing). The response decorrelates as the focused beam steers away from the recording point at 0 degrees and shows different responses for the two sample element locations. In both cases, most of the beam energy was observed over a small set of steering angles due to focal gain. The necessary beam span to achieve pulse isolation will be further studied below.
Fig. 3.
Simulated transmit pressure field results for a receiver at (x, z) = (0, 40mm). All results were scaled by the same normalization factor. (a) “Ideal” extracted pulses corresponding to emission from only the desired transmit element. The angle of the receiver relative to the array is denoted by the dashed white line. (b) Actual extracted pulses using the full aperture in a focused transmit configuration. (c) Pulses were synthesized by summing across transmit angles. The transducer impulse response is included for reference and scaled to match the full aperture pulse amplitude.
Fig. 3(c) shows the summed response of both the ideal case and the full aperture case compared to the transducer impulse response (scaled to the amplitude of the full aperture response). For both elements, incomplete isolation of the element responses allows for focal gain to boost the pulse amplitude compared to the ideal case. There is some distortion of the synthesized pulse relative to the impulse response. The center element response had a normalized correlation of 0.954 and the edge element response had a normalized correlation of 0.975 with the impulse response. This represents a change in spectral properties compared to the 3 MHz, 0.8 fractional bandwidth of the original pulse, trading off center frequency for bandwidth. The center element synthesized pulse had center frequency 2.56 MHz and bandwidth 1.04, while the edge element had center frequency 2.70 MHz and bandwidth 0.97.
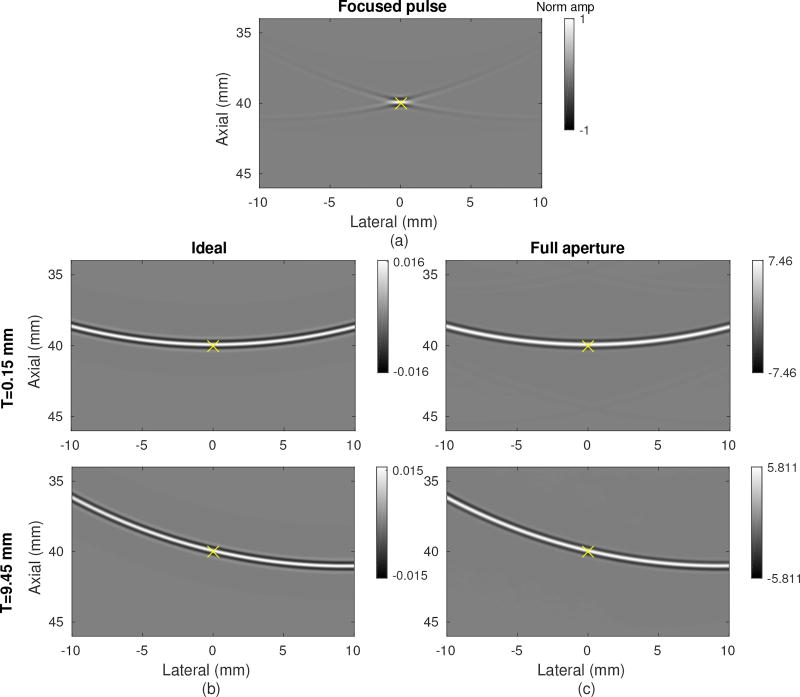
For imaging, the spatial profile of the synthesized pulse is even more important than the temporal profile. Spurious energy caused by incomplete isolation would cause off-axis scattering clutter and degrade image quality. Fig. 4(a) shows a sample focused transmit profile at a snapshot in time when it intersected a point of interest at the focal depth marked by a yellow ‘X’. Fig. 4(b) shows the ideal responses from the two selected elements. The transmit pressure field from each was a spherically diverging wave crossing through the point of interest. The amplitude of the wave was approximately 1/64 of the maximum amplitude of the focused transmission from the 64 element array. Fig. 4(c) shows the synthesized transmit pressure field corresponding to each element, closely matching the ideal response. The amplitude was significantly higher due to the combination of 241 transmit events and would scale with the number of transmit events used. The amplitude does vary some between element positions, as will be seen in the experimental results section. The isolation of these components indicates that the recovery of the complete data set from the focused beam responses should be successful.
Fig. 4.
Comparison of ideal transmit point spread functions with synthetically isolated components from the focused phased array scan. The color scale is normalized by the maximum pressure of (a), a single focused transmit pulse. The point of interest is marked with a yellow ‘X’. (b) Ideal component transmit pressure fields for two different transmit elements. The pulses are created by transmitting on only the appropriate transmit element. (c) Synthesized transmit pressure fields using full aperture emissions with 60 degree span at 0.25 degree spacing.
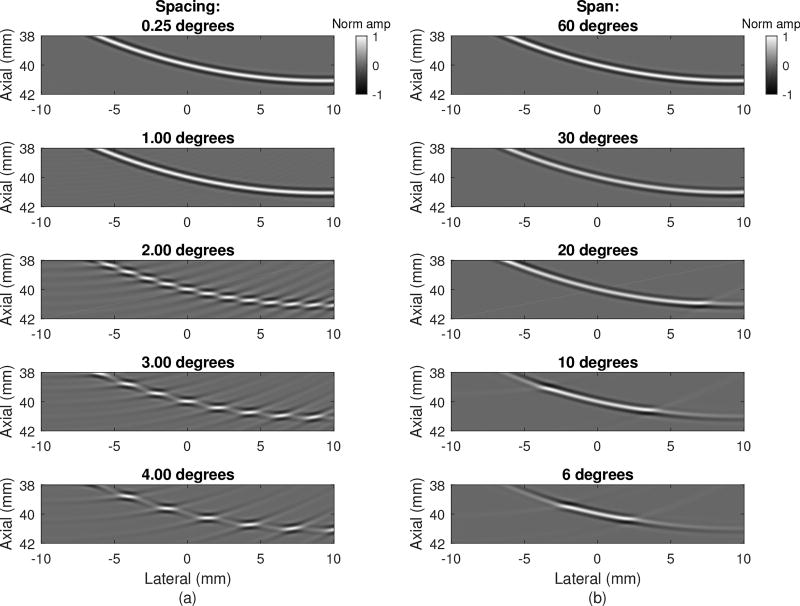
The simulation above, while allowing for successful recovery of the individual element responses, used 241 transmit beams, more than may be used in a typical focused beam scan sequence. The transmit beam data was subsampled to empirically test the necessary sampling requirements for both the span and spacing of beams around a selected spatial point.
Fig. 5(a) shows the result of adjusting beam spacing from 0.25 degrees (the full simulated data set) to 4 degrees. The recovered pressure profile remains unchanged up to around 1 degree spacing, or 61 beams across the 60 degree span. Further increasing the spacing even to 2 degrees reveals the individual focused point spread functions and results in high-amplitude tails away from the desired spherical profile. To meet angular Nyquist sampling, calculated as for the wavelength λ and aperture extent D, transmit spacing cannot exceed 0.77 degrees in this case. It is therefore likely that existing scan sequences are sufficiently sampled to perform the proposed method and beam spacing could actually be increased further.
Fig. 5.
Synthesized transmit pressure field at the focal depth for the source at T = 9.45 mm with (a) varying transmit beam spacing with a fixed 60 degree span and (b) transmit beam total span with a fixed 0.25 degree spacing. All images are individually normalized.
Fig. 5(b) shows the result of adjusting the beam span from 60 degrees (the full simulated data set) to 6 degrees around the point of interest. The diverging wave is properly isolated approximately out to the extent of the beam span. For the 20 mm lateral field of view at the focal depth of 40 mm (28.1 degree span), the 30 degree beam span is sufficient. Lower amplitude is observed outside of the selected span and incomplete cancellation of the outermost beams occurs. Practically, this means that spatial locations near the edges of the scan may not realize complete isolation of the transmit elements.
B. Experimental results
When used to produce a two-way focused image, the recovered complete data set should achieve the ideal lateral resolution (synthetic transmit focused and receive focused) at all spatial locations with improved signal-to-noise ratio. The following sections test these two requirements experimentally using phantom targets. The decomposition of the focused beams into individual transmit element responses is also validated.
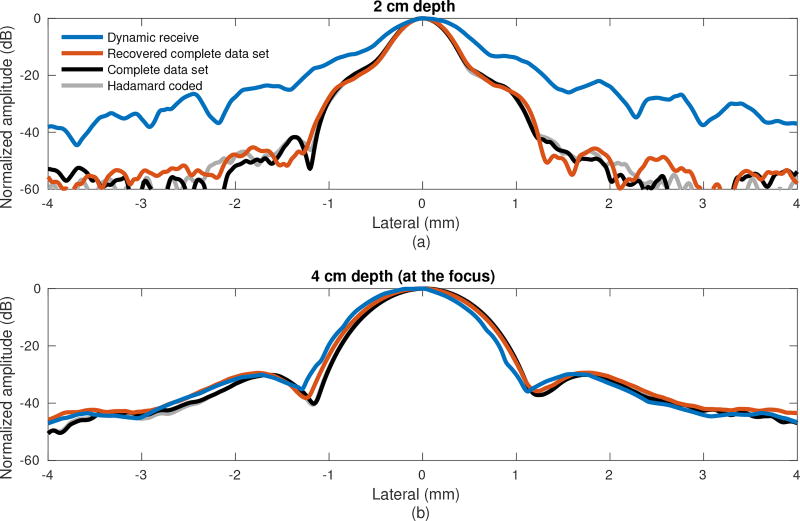
Wire targets were used to experimentally characterize the two-way focused point spread function both at and away from the focus of the transmit beam. Fig. 6(a) shows the lateral beam profiles for the two processing methods applied to the focused beam data set at half the focal depth, 2 cm. The complete and Hadamard coded data sets are included for comparison, representing the ideal synthetic transmit focusing. The focused data set with dynamic receive beamforming shows a broad lateral point spread function, both in terms of the main lobe and side lobes. As expected, the poor transmit focusing at this depth degraded the overall image quality. Recovery and beamforming of the complete data set from the focused beams restored transmit focusing, tightening the main lobe from 0.82 mm to 0.56 mm and reducing the first side lobe by 14 dB. The recovered complete data set compares closely to the complete and Hadamard data sets.
Fig. 6.
Lateral point spread functions at two depths, (a) away from the focus and (b) at the focus. Dynamic receive beamforming and recovery of the complete data set are performed on the same focused transmit data set (focus at 4 cm). For comparison, profiles for the single element transmission complete data set and the Hadamard coded data set are also plotted.
Fig. 6(b) shows the lateral beam profiles at the focal depth, 4 cm. Here, all four methods produced approximately equal results. The dynamic receive beams are already properly focused, achieving the maximum resolution without the need for additional focusing. All FWHM resolution measurements are provided in Table II.
TABLE II.
Point target lateral full-width at half-maximum (FHWM)
| Method | FWHM (mm) | |
|---|---|---|
|
|
||
| 2 cm depth | 4 cm depth | |
| Dynamic receive | 0.86 | 1.05 |
| Recovered complete data set | 0.56 | 1.07 |
| Complete data set | 0.56 | 1.03 |
| Hadamard coded | 0.55 | 1.03 |
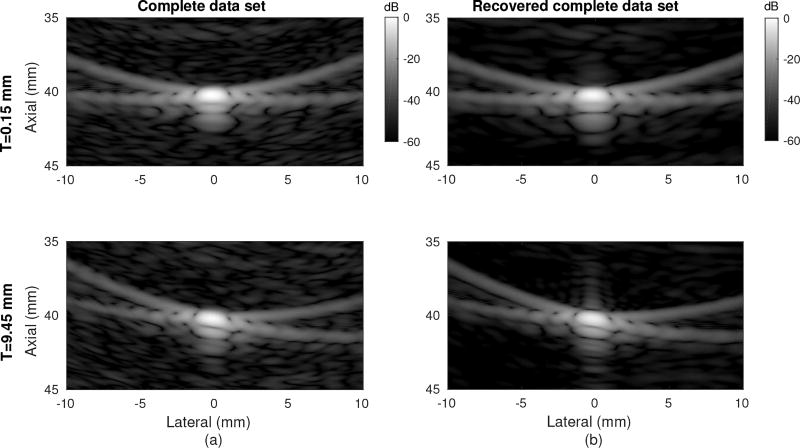
While the proposed method does not produce an improvement in focusing at the original focal points, it does still allow decomposition of the focused beams to individual element contributions for other aperture processing. To verify this, images were produced from a single transmit element in the recovered complete data set and compared to images of the complete data set. Fig. 7(a) shows the ideal responses for a selected middle and edge array element. The point spread function reflects receive-only focusing and is tilted toward the active transmit element. Fig. 7(b) shows the images produced using the recovered complete data set for the same two transmit elements. There is good agreement between the sets of images validating the decoding of the focused beams. The background differs in the images due to the differences in SNR. Some axial ringing of the point was observed in the recovered image for the edge element but not for the center element.
Fig. 7.
Experimental single transmit element images of a wire target at 4 cm depth for (a) the complete data set (single element transmission) and (b) the recovered complete data set using the proposed method. Each column of images was independently normalized.
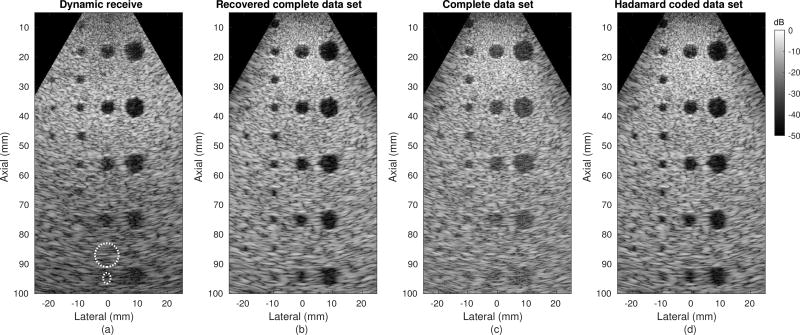
The anechoic lesion targets reflect overall performance of the beamforming method, a result of both the focusing described by the point targets in the previous section and electronic SNR. Figs. 8(a,b) show the results for processing of the focused transmit beam data set. The dynamic receive image shows poor focal quality in the region above the focal depth, especially in the set of lesions around 20 mm. At depth, the fixed focus transmit beams result in poor SNR, almost completely obscuring the lesions at 95 mm. Recovery of the complete data set improves both focusing and SNR, better resolving the lesion targets at all depths. For example, the contrast of the deepest center lesion marked in Fig. 8(a) improved from −7.0 dB to −15.9 dB with the proposed method, compared to −7.1 dB in the complete data set in Fig. 8(c) and −16.4 dB in the Hadamard coded data set in Fig. 8(d).
Fig. 8.
Results of the lesion phantom experiment with various beamforming. (a) Conventional dynamic receive beamforming with dense focused transmit beam sampling (0.25 degree spacing, 241 transmissions, 40 mm focal depth). The white dashed ellipses indicate regions of interest for contrast measurement. (b) Proposed method for recovery and beamforming of the complete data set with sparse transmit beam sampling (1 degree spacing, 61 transmissions). (c) Single element transmissions, directly sampling the complete data set (64 transmissions). (d) Hadamard coding of the transmit aperture (64 transmissions). The dynamic ranges of the images were matched as described in the text.
The dynamic receive image in Fig. 8(a) was formed with all available transmit beams, densely sampled at 0.25 degree spacing, to avoid the need for beam interpolation or parallel receive beamforming methods. SNR and focal quality in this case are independent of the number of beams because each A-line is produced from a single transmit event. The recovered complete data set in Fig. 8(b) was formed with only 61 transmissions, corresponding to 1 degree spacing, according to the results of Section IV-A. This makes it a fair comparison to the complete data set and Hadamard data sets, which are comprised of 64 transmissions each. In these cases, the number of transmissions affects both the focal quality and SNR because the data from each transmission are combined coherently.
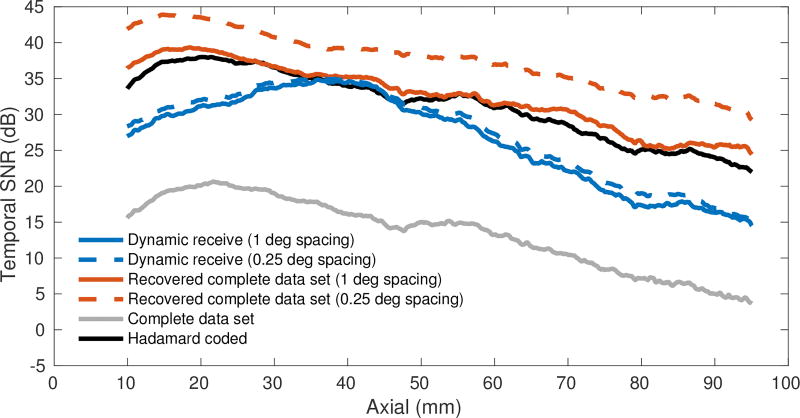
Electronic SNR was estimated in the speckle region through depth for each beamforming method and is plotted in Fig. 9. For the focused transmit beam data set, both the 0.25 degree spacing and 1 degree spacing cases were processed. The peaks of the dynamic receive curves occurred near the 40 mm focal depth due to the effect of focal gain and SNR was reduced both closer to and farther from the transducer. The recovered complete data set, even with 61 beams, showed strong improvement of SNR at all depths. As expected for diverging waves, the SNR for the proposed method decreased fairly monotonically away from the transducer and the final image had no visible depth of field or focal gain effect. At 10 mm, there was a difference of 8.16 dB compared to the dynamic receive case. At the focus, the difference was only 0.43 dB because focal gain from all 64 elements is achieved for the dynamic receive case. At 95 mm, the difference grew to 9.57 dB.
Fig. 9.
Estimated temporal signal-to-noise ratio (SNR) for pairs of data frames after beamforming. Dynamic receive beamforming and recovery of the complete data set were performed on the same focused transmit data set (focus at 40 mm depth) where the solid lines correspond to 1 degree transmit beam sampling (61 transmissions) and dashed lines correspond to 0.25 degree transmit beam sampling (241 transmissions). Estimated SNRs for the complete data set and the Hadamard coded data set are also plotted (each 64 transmissions).
The proposed method using 61 beams performed approximately as well as the Hadamard coded method, outperforming it by 2.47 dB at the 95 mm depth. The complete data set sampled using individual element transmissions performed the worst. As the number of transmit beams is increased, the SNR achieved by the proposed method continues to increase. However, these transmissions largely introduce redundant data. In the limit of completely overlapping beams (repeated sampling), increasing the number of beams by a factor of N produces a improvement in the SNR as in any other imaging sequence.
V. Discussion
This work has demonstrated the use of the proposed method for synthetic transmit aperture imaging, decomposing the set of focused beams into individual element contributions and recombining them to form an image. The formation of the complete data set enables other post-processing optimizations such as dynamic transmit apodization and transmit spatial compounding. Because the applied transmit delays are used to decode the focused beams independent of actual wave propagation, the proposed method allows for recovery of the complete data set even with sound speed mismatch between the focused transmission and the medium. Access to both the transmit and receive aperture dimensions also provides the opportunity for adaptive imaging methods such as two-way aberration estimation and correction [18].
In order to demonstrate that the frequency-domain decoding of the complete data set is a computationally tractable operation, code was benchmarked on a 3.07 GHz Intel Xeon W3550 CPU using MATLAB and MEX code to parallelize interpolation over 4 processors. These benchmarks are meant only to be illustrative and are not necessarily representative of optimized performance on a massively parallel architecture. It is assumed that delays and the decoding matrix are pre-calculated as necessary. For the data set used in this work, M = 64, N = 61, Pz * Px = 1000 * 500, and the number of time samples was 1280. The time-domain recovery of the complete data set, implemented by linear interpolation, took 5.33 seconds. Frequency-domain recovery, implemented by FFT/IFFT and complex matrix multiplication, took only 0.33 seconds. Further parallelization of the complex multiplications across frequencies, which took 0.24 seconds of that time, could reduce the processing time even further.
The decoding matrix H* given by (7) is physically intuitive and has a number of desirable properties for recovery of the complete data set. By design it provides recovery of the desired element signal with uniform magnitude and zero phase (the diagonal of the matrix HH*). However, there are two related issues that are noticeable in the magnitude and phase plots of HH* in Fig. 2. First, the magnitude matrix shows undesirable contributions from neighboring elements, or cross-talk in the recovered data set. For most elements, this is not of great consequence because diverse phases between neighboring elements destructively interfere. The second issue is that the matrix does not wrap around the edges, such that the recovered edge array elements do not receive as much cross-talk. This violates that assumption that the neighboring contributions have sufficient phase diversity to cancel out.
An interesting property of the encoding matrix H is that it is not necessarily full rank. The rank decreases particularly at low frequencies as ω approaches 0. While this would be a problem for matrix inversion, the structure of H* means that the recovery can succeed even when there are fewer transmit events than elements. The cost of such structure is the aforementioned element cross-talk. This model also potentially supports transmit focal geometries other than the one specified in (2).
Rather than decoding using H*, specified by time shifts, it may be possible to directly invert H at each frequency to improve signal recovery. However, as discussed in [19], selecting an appropriate pseudoinverse is nontrivial for the poorly conditioned matrices that may occur at some frequencies. In that work, the selection of the encoding matrix provided a predictable structure to the singular values and vectors that was favorable for inversion. Appropriate approximation of the inverse in this case will require detailed study of the properties of the encoding matrix.
As in all synthetic transmit aperture methods, the ability to coherently process the data from multiple transmit events depends on the level of motion present between transmissions [20], [21]. Specifically how motion separately affects the decoding and focusing processes in the proposed method will need to be evaluated in the context of future clinical implementation.
One advantage of transmitting focused beams rather than other types of coded apertures is the focal gain that enables harmonic imaging. The nonlinear formation of the harmonic signal is maintained in the proposed method, so the harmonic image could be formed in parallel to the recovered complete fundamental data set. The two images could be used for frequency compounding or otherwise blended to improve image quality. It also remains to be seen whether the proposed method can be generalized to similarly decompose the harmonic data set despite the method relying on signal linearity.
Sample code and data for this decoding method have been made available at https://github.com/nbottenus/decode_complete (DOI: 10.5281/zenodo.997488). Code is provided to perform either frequency or time decoding and the required diverging wave beamforming of the recovered complete data set. The sample data set is from the lesion phantom of Fig. 8 and contains the matrix of transmit delay timings required to construct H*.
VI. Conclusions
This work has demonstrated a method for synthetic aperture imaging that abandons the virtual source model commonly used to describe focused beams. The proposed algorithm performs isolation of the contributions of individual transmit elements, producing an estimate of the complete data set that can be used for high-quality synthetic focusing. The experimental data show that the method achieves improved focusing and contrast compared to dynamic receive focusing, improved SNR across depth compared to single-element acquisition of the complete data set, and approximately the same image quality as a Hadamard coded set. The compatibility of the proposed method with existing scan sequences and the advent of commercial software beamformers make this technique a powerful tool for image optimization.
Acknowledgments
This work is supported by NIH grants R01-EB017711 and T32-EB001040 from the National Institute of Biomedical Imaging and Bioengineering, and the Duke-Coulter Translational Partnership Grant Program.
The author would like to thank Gregg Trahey for his support in this work and his consultation in the preparation of this manuscript. The author would also like to thank the anonymous reviewers for their feedback in revision of this manuscript and encouragement to generalize the proposed method.
References
- 1.Cobbold RSC. Foundations of Biomedical Ultrasound. Oxford University Press; 2007. [Google Scholar]
- 2.Ylitalo J, Ermert H. Ultrasound synthetic aperture imaging: monostaticapproach. IEEE Transactions on Ultrasonics, Ferroelectrics andFrequency Control. 1994;41(3):333–339. [Google Scholar]
- 3.Corl P, Grant P, Kino G. A Digital Synthetic Focus Acoustic Imaging System forNDE. 1978 Ultrasonics Symposium. 1978:263–268. [Google Scholar]
- 4.Karaman M, O’Donnell M. Synthetic aperture imaging for small scalesystems. IEEE Transactions on Ultrasonics, Ferroelectrics andFrequency Control. 1995;42(3):429–442. [Google Scholar]
- 5.Chiao R, Thomas L, Silverstein S. Sparse array imaging with spatially-encodedtransmits. 1997 IEEE Ultrasonics Symposium. 1997:1679–1682. [Google Scholar]
- 6.Gong P, Kolios MC, Xu Y. Delay-encoded transmission and image reconstructionmethod in synthetic transmit aperture imaging. IEEE Transactions on Ultrasonics, Ferroelectrics, andFrequency Control. 2015;62(10):1745–1756. doi: 10.1109/TUFFC.2015.007005. [DOI] [PubMed] [Google Scholar]
- 7.Harrison T, Samplaleanu A, Zemp R. S-sequence spatiallyencoded synthetic apertureultrasound imaging. IEEE Transactions on Ultrasonics, Ferroelectrics, andFrequency Control. 2014;61(5):886–890. doi: 10.1109/TUFFC.2014.6805701. [DOI] [PubMed] [Google Scholar]
- 8.Misaridis TX, Jensen JA. Space-time encoding for high frame rate ultrasoundimaging. Ultrasonics. 2002;40:593–597. doi: 10.1016/s0041-624x(02)00179-8. [DOI] [PubMed] [Google Scholar]
- 9.Frazier CH, O’Brien WD., Jr Synthetic Aperture Techniques with a Virtual SourceElement. IEEE Transactions on Ultrasonics, Ferroelectrics andFrequency Control. 1998;45(1):196–207. doi: 10.1109/58.646925. [DOI] [PubMed] [Google Scholar]
- 10.Bae M-H, Jeong M-K. A Study of Synthetic-Aperture Imaging with VirtualSource Elements in B-Mode Ultrasound Imaging Systems. IEEE Transactions on Ultrasonics, Ferroelectrics andFrequency Control. 2000;47(6):1510–1519. doi: 10.1109/58.883540. [DOI] [PubMed] [Google Scholar]
- 11.Bradley C. Retrospective transmit beamformation. Whitepaper ACUSON SC2000TM Volume Imaging UltrasoundSystem. 2008 [Google Scholar]
- 12.Bae M-H, Kim NO, Kang MJ, Kwon SJ. A New Synthetic Aperture Imaging Method Using VirtualElements on Both Transmit and Receive. IEEE Ultrasonics Symposium Proceedings. 2015 [Google Scholar]
- 13.Nguyen NQ, Prager RW. High-Resolution Ultrasound Imaging With UnifiedPixel-Based Beamforming. IEEE Transactions on Medical Imaging. 2016;35(1):98–108. doi: 10.1109/TMI.2015.2456982. [DOI] [PubMed] [Google Scholar]
- 14.Bottenus N. A method for intrapulse spatial compounding. 2016 IEEE International Ultrasonics SymposiumProceedings. 2016:1–4. [Google Scholar]
- 15.Jensen JA, Svendsen NB. Calculation of pressure fields from arbitrarilyshaped, apodized, and excited ultrasound transducers. IEEE Transactions on Ultrasonics, Ferroelectrics, andFrequency Control. 1992;39(2):262–267. doi: 10.1109/58.139123. [DOI] [PubMed] [Google Scholar]
- 16.Jensen JA. Field: A Program for Simulating UltrasoundSystems. Medical & Biological Engineering &Computing. 1996;34(Supplement 1 Part 1):351–353. [Google Scholar]
- 17.Friemel BH, Bohs LN, Nightingale KR, Trahey GE. Speckle decorrelation due to two-dimensional flowgradients. IEEE Transactions on Ultrasonics, Ferroelectrics, andFrequency Control. 1998;45(2):317–27. doi: 10.1109/58.660142. [DOI] [PubMed] [Google Scholar]
- 18.Liu D, Ustuner K. Aberration correction using broad transmitbeams. 2012 IEEE International Ultrasonics Symposium. 2012:2270–2273. [Google Scholar]
- 19.Gong P, Kolios MC, Xu Y. Pseudoinverse decoding process in delay-encodedsynthetic transmit aperture imaging. IEEE Transactions on Ultrasonics, Ferroelectrics, andFrequency Control. 2016;63(9):1372–1379. doi: 10.1109/TUFFC.2016.2578952. [DOI] [PubMed] [Google Scholar]
- 20.Hazard CR, Lockwood GR, Introduction I. Effects of motion on a synthetic aperture beamformerfor real-time 3D ultrasound. 1999 IEEE Ultrasonics Symposium. 1999;2:1221–1224. vol.2. [Google Scholar]
- 21.Karaman M, Bilge H, O’Donnell M. Adaptive multi-element synthetic aperture imaging withmotion and phase aberration correction. IEEE Transactions on Ultrasonics, Ferroelectrics, andFrequency Control. 1998;45(4):1077–1087. doi: 10.1109/58.710591. [DOI] [PubMed] [Google Scholar]


