Abstract
A fundamental principle in biology is that the program for early development is established during oogenesis in the form of the maternal transcriptome1,2. How the maternal transcriptome acquires the appropriate content and dosage of transcripts is not fully understood. Here we show that TUT4/7-mediated mRNA 3′ terminal uridylation sculpts the mouse maternal transcriptome by eliminating transcripts during oocyte growth. TUT4/7-mediated uridylation is essential for both oocyte maturation and fertility. In comparison to somatic cells, the oocyte transcriptome displays shorter poly(A) tail length and a high relative proportion of terminal oligo-uridylation. TUT4/7 deletion leads to the accumulation of a cohort of transcripts with a high frequency of very short poly(A) tails and a loss of 3′ oligo-uridylation. In contrast, TUT4/7-deficiency does not alter gene expression in a variety of somatic cells. In summary, we show essential and specific functions for poly(A) tail length and 3′ terminal uridylation in sculpting a functional maternal transcriptome.
Keywords: maternal transcriptome, mRNA uridylation, TUT4, TUT7, microRNA, oogenesis and germ line
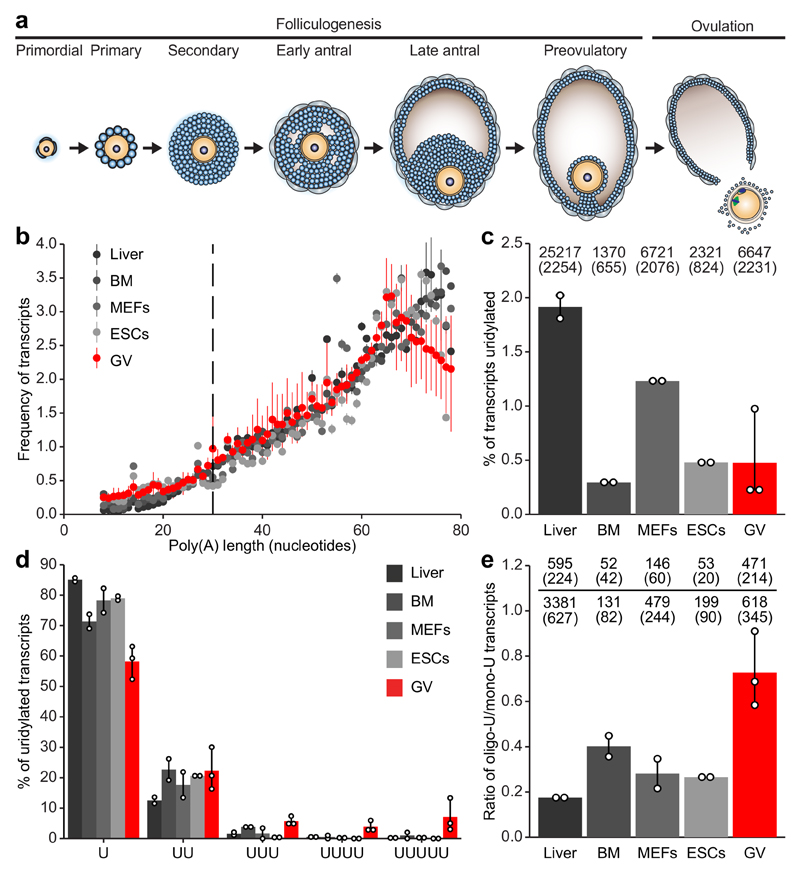
The early stages of zygotic development are characterized by the lack of transcription and thus gene expression is instructed by the maternally-deposited transcriptome1. In mammals, the maternal transcriptome is built during folliculogenesis that encompasses the growth phase of oogenesis and culminates in ovulation2. This process initiates when a clutch of primordial oocytes begins to grow coinciding with the expansion of surrounding somatic cells that together will form follicles. The stages of growing oocytes are classified sequentially as primary, secondary, early antral or late antral depending on morphology and increasing cell size (Fig. 1a). The mature oocyte upon ovulation is competent to support fertilization as well as development3; this competence is largely defined by the maternal transcriptome4,5. The maternal mRNA in growing oocytes is extremely stable6,7, however, each stage of growth is characterized by a distinct transcriptome4. This implies that growing oocytes not only require the ability to accumulate mRNA but also to mediate its selective and limited degradation. How the growing oocyte eliminates transcripts to accrue the appropriate content and dosage of mRNAs defining a functional maternal transcriptome remains largely unknown.
Figure 1. The oocyte transcriptome is characterized by short poly(A) tails and oligo-uridylation.
a, Schematic representation of folliculogenesis and ovulation. b, Frequency of transcripts plotted against poly(A) tail length (8-78 nucleotides) in liver, bone marrow (BM), mouse embryonic fibroblasts (MEFs), embryonic stem cells (ESCs) and germinal vesicle (GV) oocyte transcriptomes. Data points and horizontal lines represent biological replicates’ mean and range, respectively. The number of transcripts / number of genes / percentage of transcripts with poly(A) tail length shorter than 79 nucleotides are 724,498 / 8,395 / 47% for liver, 52,809 / 5,292 / 9% for BM, 130,313 / 6,884 / 19% for MEFs, 123,459 / 7,681 / 20% for ESCs, and 1,035,640 / 11,747 / 35% for GV oocytes. c, Percentage of mRNA 3′ terminal transcriptome uridylation. The number of uridylated transcripts and in parentheses the number of genes represented by those transcripts are shown. d, Relative frequency of indicated U-tail length for transcripts with short (≤ 30 nucleotides) poly(A) tails. e, Ratio of oligo- to mono-uridylation for transcripts with short (≤ 30 nucleotides) poly(A) tails. The total numbers of oligo- and mono-uridylated transcripts and in parentheses the numbers of genes represented by those transcripts are shown. Data points represent biological replicates; the bars’ heights and vertical lines indicate the mean and range, respectively, for (c-e).
Poly(A) tail length and 3′ terminal mRNA uridylation are key determinants of mRNA turnover8–10. In human cell lines approximately a fifth of transcripts with very short poly(A) tails (< 25 nucleotides) is 3′ uridylated and this nucleotide addition optimizes the mRNA for decay9,11. The shortening of a poly(A) tail below ~27 nucleotides results in the loss of the stabilizing PABP binding12,13 and the subsequent recruitment of the terminal uridylyl transferases 4 (TUT4) and TUT7 (TUT4/7) that mediate mRNA 3′ uridylation9. LSM (like-Sm) proteins are central regulators of RNA metabolism and have a binding preference for terminal uridylyl residues14, thus their recruitment sets in motion the 5′-3′ XRN1 decay pathway through the recruitment of DCP1/2 mRNA decapping enzymes15. The contribution of TUT4/7-mediated 3′ uridylation to mRNA degradation in vivo and physiology is undetermined. Here we sought to understand if poly(A) tail length and mRNA 3′ uridylation function in the formation of the maternal transcriptome.
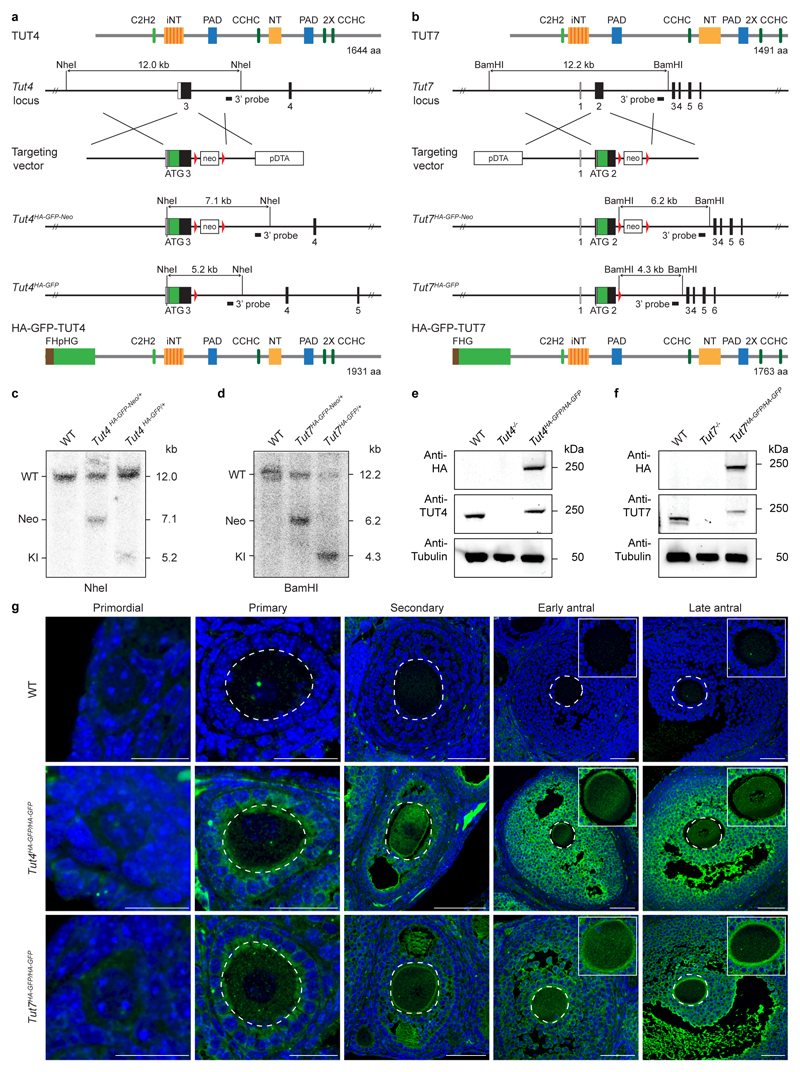
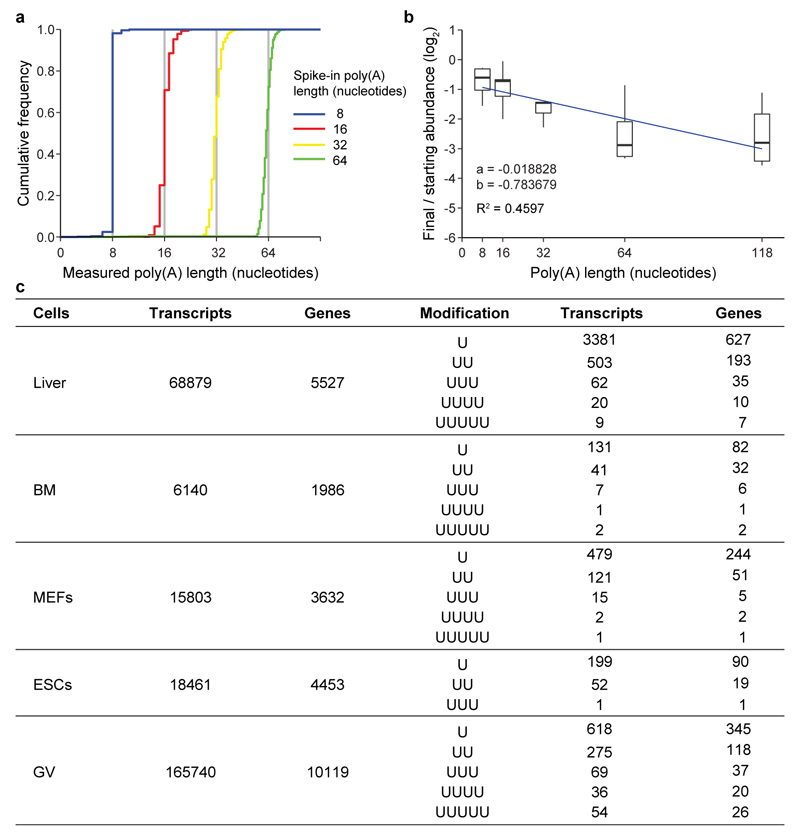
To explore a possible contribution of TUT4/7-mediated mRNA uridylation during oocyte growth, we generated epitope-tagged alleles for both genes (Extended Data Fig. 1a-f). Both TUT4 and TUT7 proteins were expressed from the primordial through to late antral stages of oogenesis (Extended Data Fig. 1g). We next sought to understand the terminal uridylation profile and poly(A) tail features (3′-terminome) of the GV (late antral/preovulatory) oocyte transcriptome. We therefore performed TAIL-seq11 with a slight modification to correct for poly(A) tail length recovery bias (Methods and Extended Data Fig. 2a, b) from GV oocytes as well as from somatic mouse tissues/cells (liver, bone marrow, mouse embryonic fibroblasts (MEFs) and embryonic stem cells (ESCs)). TAIL-seq enables the simultaneous determination of poly(A) tail length and the 3′ terminal nucleotides11. Oocytes had the poly(A) tail length distribution with the shortest mode length (~65 nucleotides) over the 78 nucleotides observed (Fig. 1b). While the overall amount of terminal uridylation in the respective transcriptomes differed (Fig. 1c), a distinguishing feature of the GV oocyte was that it presented the highest relative ratio of oligo- to mono-uridylation among the respective transcriptomes (Fig. 1d, e and Extended Data Fig. 2c).
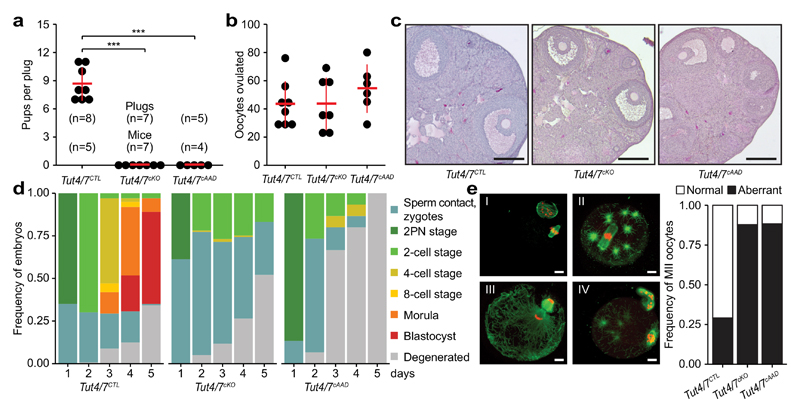
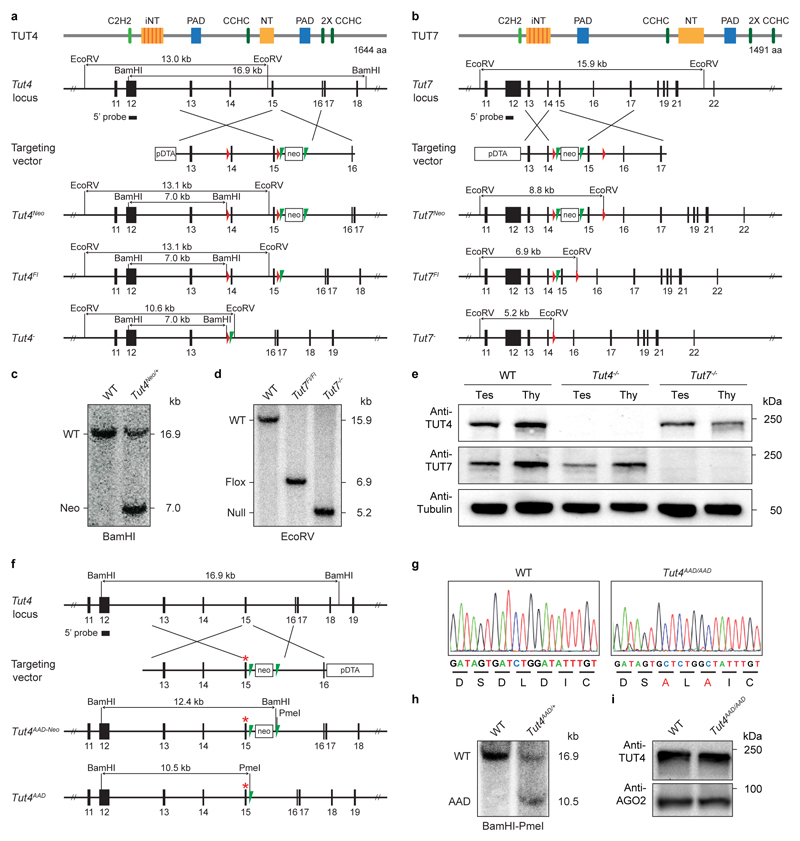
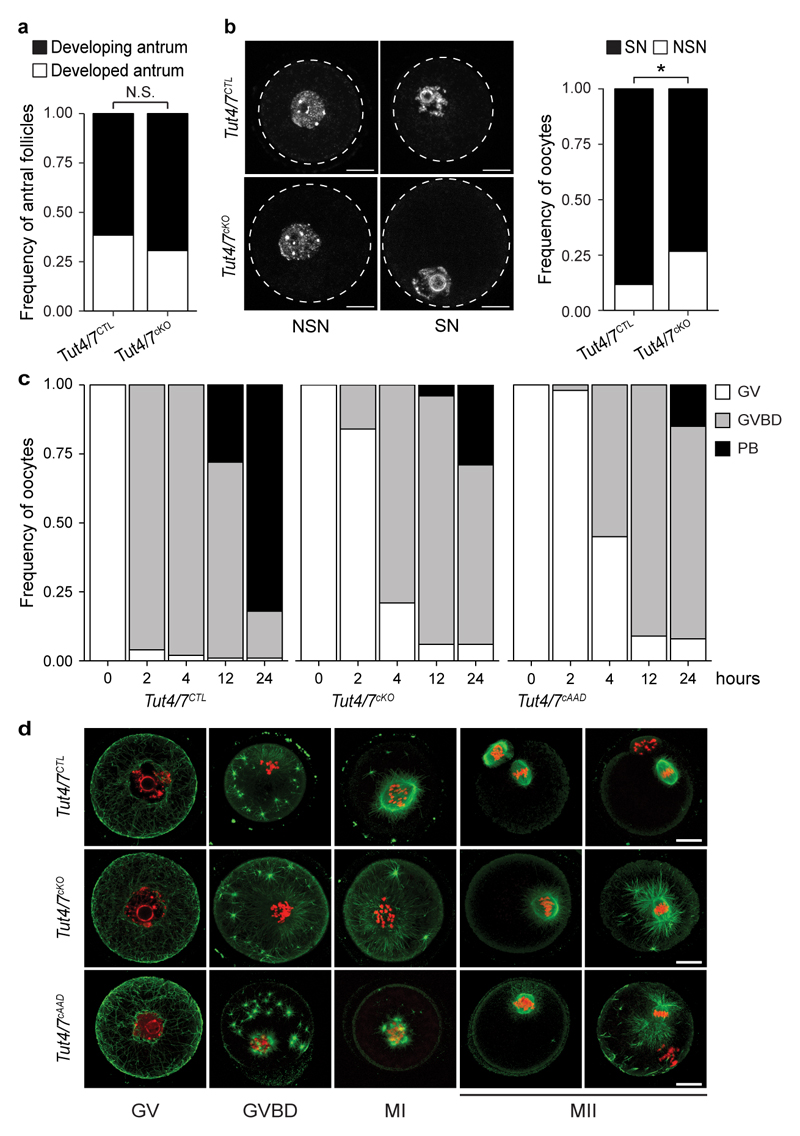
Intrigued by the distinguishing features of the GV oocyte terminome, we sought to use conditional mutagenesis to explore the function of TUT4/7-mediated uridylation during oogenesis. We therefore engineered conditional alleles for both genes in the mouse (Extended Data Fig. 3a-e) and combined these Tut4Fl and Tut7Fl alleles with a Zp3Cre transgene that deletes at the secondary oocyte stage16 to generate control Tut4+/Fl; Tut7+/Fl; Zp3Cre Tg+ or Tut4+/+; Tut7+/+; Zp3Cre Tg+ (Tut4/7CTL) and experimental Tut4Fl/Fl; Tut7Fl/Fl; Zp3Cre Tg+ (Tut4/7cKO) mice. Tut4/7cKO mice were infertile, although they ovulated normal numbers of oocytes (Fig. 2a, b). The morphology of antral follicles in the Tut4/7cKO mice was also normal with a slight decrease in the frequency of surrounded nucleolus state oocytes observed (Fig. 2c and Extended Data Fig. 4a, b). To understand why the mutant oocytes were defective, we hormone primed and set up Tut4/7CTL and Tut4/7cKO females with wild type males and placed isolated oocytes/zygotes in culture to monitor pre-implantation development in vitro. Over the course of five days, the bulk of Tut4/7CTL embryos developed until the blastocyst stage; although sperm contact was observed with Tut4/7cKO oocytes, the majority of them did not develop further (Fig. 2d). A small fraction of the Tut4/7cKO fertilized oocytes were observed at the 2-pronuclei stage but never developed past 2-cell embryos (Fig. 2d). In summary, Tut4/7cKO oocytes are incompetent to support early embryonic development. This phenotype could arise from failure to complete meiosis I properly thus generating aberrant MII oocytes, or alternatively, Tut4/7cKO oocytes complete meiosis I correctly but the resulting MII oocytes are not capable of supporting fertilization. To discriminate between these two possibilities, Tut4/7CTL and Tut4/7cKO females were hormone primed and ovulated oocytes were isolated. The majority of Tut4/7cKO oocytes failed to complete meiosis I properly and multiple phenotypic abnormalities were observed, including abnormal spindle morphology with microtubule asters (Fig. 2e-II), telophase arrest (Fig. 2e-III) as well as aberrant MII oocytes with chromosomes dispersed along the spindle (Fig. 2e-IV). This defective meiosis could also be observed with in vitro cultured GV oocytes with most oocytes failing to extrude the first polar body (Extended Data Fig. 4c, d). We next wanted to formally determine if the uridylation activity of TUT4/7 is the principal function by which these large multidomain enzymes support meiosis I. We therefore took advantage of a previously characterized mutation in the catalytic triad (DDD to AAD) that renders TUT4 enzymatically inactive17,18 and engineered a Tut4AAD allele in the mouse (Extended Data Fig. 3f-i). We then combined the Tut4Fl, Tut7Fl, Tut4AAD and Zp3Cre alleles to generate experimental Tut4Fl/AAD; Tut7Fl/Fl; Zp3Cre Tg+ (Tut4/7cAAD) mice, where only a single copy of the catalytic-dead TUT4AAD protein is expressed during oogenesis. While a single copy of TUT4 supported oogenesis, the expression of the catalytic-dead TUT4AAD protein phenocopied the conditional ablation of TUT4/7 (Fig. 2a-e and Extended Data Fig. 4c, d). In summary, the function of TUT4/7 and specifically their uridylation activity are intrinsically required during oocyte growth to complete meiosis I and generate functional MII oocytes.
Figure 2. Infertility and defective oocyte maturation in Tut4/7cKO mice.
a, Number of pups born per plug from Tut4/7CTL, Tut4/7cKO and Tut4/7cAAD mice. The number of animals tested, the mean and s.d. are indicated (t-test; ***, p < 0.001). b, Number of ovulated oocytes harvested after hormonal stimulation. Center values and error bars indicate the mean and s.d., respectively. The number of mice analyzed is n=8 for Tut4/7CTL, n=7 for Tut4/7cKO and n=6 for Tut4/7cAAD mice. c, Representative ovary sections stained with H&E for Tut4/7CTL, Tut4/7cKO and Tut4/7cAAD mice. Scale bars indicate 200 μm. d, In vitro development of oocytes isolated from Tut4/7CTL, Tut4/7cKO and Tut4/7cAAD mice that had been mated with wild type males of proven fertility. The fraction of oocytes with sperm contact or zygotes at the 2-pronuclei (2PN), 2-cell, 4-cell, 8-cell, morula and blastocyst stages is shown over five consecutive days. The number of mice and oocytes/embryos analyzed is: Tut4/7CTL, n=137 embryos, n=5 mice; Tut4/7cKO, n=119 embryos, n=6 mice and Tut4/7cAAD, n=15 embryos, n=2 mice. e, Representative confocal immunofluorescence micrographs showing Tut4/7CTL (panel I) and abnormal Tut4/7cKO (panel II-IV) MII oocytes stained with anti-tubulin antibody (green) and DNA stained with Hoechst 33342 (red, left). Scale bars indicate 10 μm. The frequency of abnormal MII oocytes is presented for the respective genotypes (right). The number of oocytes and mice analyzed is: Tut4/7CTL, n=117 oocytes, n=3 mice; Tut4/7cKO, n=171 oocytes, n=5 mice and Tut4/7cAAD, n=77 oocytes, n=2 mice.
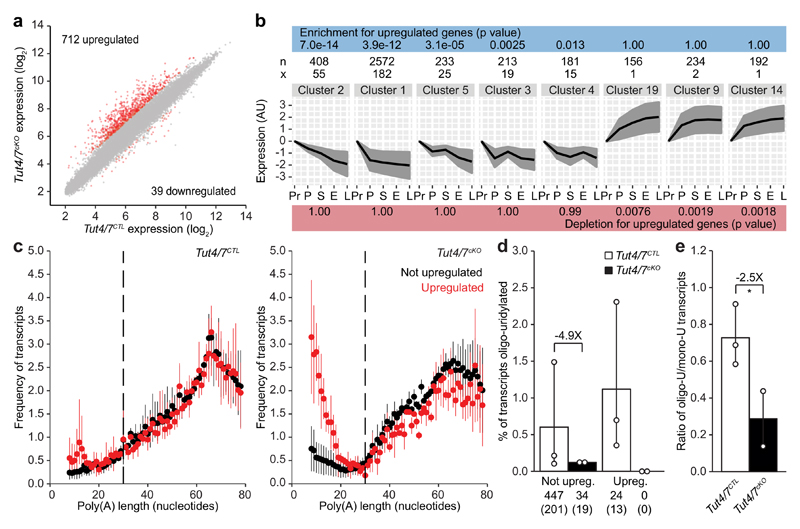
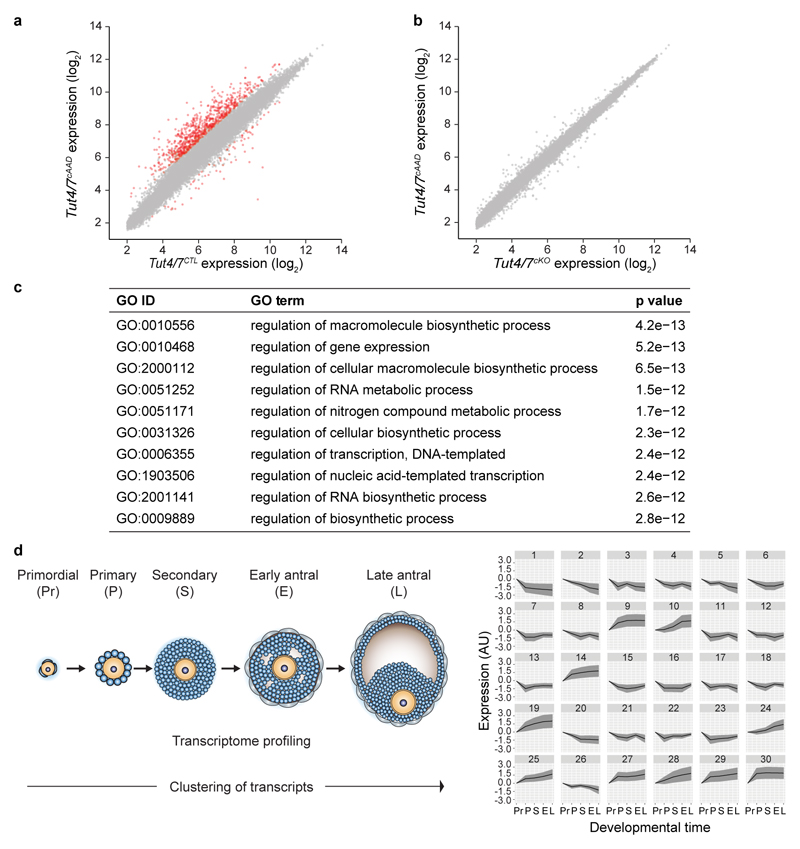
To understand if a defective maternal transcriptome underpinned the Tut4/7cKO phenotype, we analyzed gene expression in Tut4/7CTL and Tut4/7cKO GV oocytes, which represent the terminal stages of oocyte growth just prior to the onset of meiotic maturation and ovulation. The analysis of respective transcriptomes revealed the deregulation of many genes (Fig. 3a). The majority of deregulated genes were upregulated in the absence of TUT4/7 (Fig. 3a and Extended Data Fig. 5a, b), an expected outcome of removing a component of an RNA degrading pathway. The same deregulation of gene expression was observed in Tut4/7cAAD as in Tut4/7cKO GV oocytes (Extended Data Fig. 6a, b). Gene ontology analysis of the deregulated genes did not identify any germline-specific processes but rather revealed generic, mostly metabolic pathways (Extended Data Fig. 6c). We therefore sought to probe the relationship between the deregulated genes and oogenesis. To this end, we analyzed five growing oocyte transcriptomes: primordial, primary, secondary, early and late antral oocytes4. We applied the Markov clustering (MCL) algorithm19 to group genes in terms of expression patterns across oocyte growth (Extended Data Fig. 6d). We next addressed if we could detect enrichment or depletion of the TUT4/7-dependent upregulated genes in any of the gene expression patterns. We identified significant enrichment in clusters where genes are downregulated across oogenesis (Fig. 3b). Conversely, depletion of the gene set was observed in clusters where genes were upregulated or remained unchanged across development (Fig. 3b). Thus, TUT4/7 and specifically their uridylation activity are required to degrade transcripts during oocyte growth; in essence, they sculpt a functional maternal transcriptome.
Figure 3. Short poly(A) tail length and TUT4/7-mediated oligo-uridylation target oocyte transcripts for degradation.
a, Expression scatterplot showing relative average expression of transcripts between Tut4/7CTL and Tut4/7cKO germinal vesicle (GV) oocytes. Significantly deregulated (p < 0.01) genes with a fold change greater than 2 are highlighted in red. b, Enrichment and depletion analysis of Tut4/7cKO upregulated transcripts in gene expression clusters. The p-values for enrichment are indicated on the top blue bar and those for depletion on the bottom red bar. The hyper-geometric test was used to establish the significance. n represents the number of transcripts defining the cluster and x the number of Tut4/7cKO upregulated transcripts within the cluster. c, Frequency of transcripts plotted against poly(A) tail length (8-78 nucleotides) in Tut4/7CTL and Tut4/7cKO germinal vesicle (GV) oocyte. Transcripts upregulated and not upregulated in Tut4/7cKO oocytes are indicated in red and black, respectively. Data points and horizontal lines represent biological replicates’ mean and range, respectively. The number of transcripts / number of genes / percentage of transcripts with poly(A) tail length shorter than 79 nucleotides are 1,020,715 / 11,160 / 35% for Tut4/7CTL (not upregulated), 14,925 / 598 / 36% for Tut4/7CTL (upregulated), 173,641 / 8,790 / 30 % for Tut4/7cKO (not upregulated), and 6,223 / 549 / 46% for Tut4/7cKO (upregulated). d, Quantification of mRNA 3′ oligo-uridylation of transcripts upregulated and not upregulated in Tut4/7cKO oocytes with short (≤ 30 nucleotides) poly(A) tails from Tut4/7CTL and Tut4/7cKO GV oocytes. The numbers of oligo-uridylated transcripts and in parentheses the number of genes represented by these transcripts are shown. The bars’ heights and vertical lines indicate the mean and range, respectively. e, Ratio of oligo- to mono-uridylation for transcripts with short (≤ 30 nucleotides) poly(A) tails from Tut4/7CTL and Tut4/7cKO GV oocytes. The fold change and the significance are indicated (one-tailed t-test; *, p < 0.05) (d, e). The data for the Tut4/7CTL samples are derived from the libraries presented in Fig. 1.
Next we sought to understand why a group of defined transcripts is dependent upon TUT4/7-mediated uridylation during oocyte growth. To this end, we performed TAIL-seq on Tut4/7cKO GV oocytes and analyzed the 3′-terminome of the TUT4/7-dependent upregulated genes and unchanged genes. Interestingly, upon deletion of TUT4/7, the fraction of the TUT4/7-dependent upregulated genes with short poly(A) tails dramatically increased (Fig. 3c), indicating that the failure to degrade the transcripts resulted in their accumulation with short poly(A) tails. TUT4/7-deficiency had little impact on terminal mono-uridylation in transcripts with short poly(A) tails (Extended Data Figure 7a, b). The oligo-uridylation of the TUT4/7-dependent upregulated genes with short poly(A) tails was dependent upon TUT4/7 with not a single oligo-uridylated read for TUT4/7-dependent upregulated genes observed in Tut4/7cKO GV oocyte libraries (Fig. 3d and Extended Data Fig. 7a). The ratio of oligo- to mono-uridylation of transcripts with short poly(A) tails, a defining feature of the GV oocyte transcriptome, was dependent upon TUT4/7 function (Fig. 3e). Thus, the loss of TUT4/7-dependent oligo-uridylation in GV oocytes results in the accumulation of transcripts with short poly(A) tails.
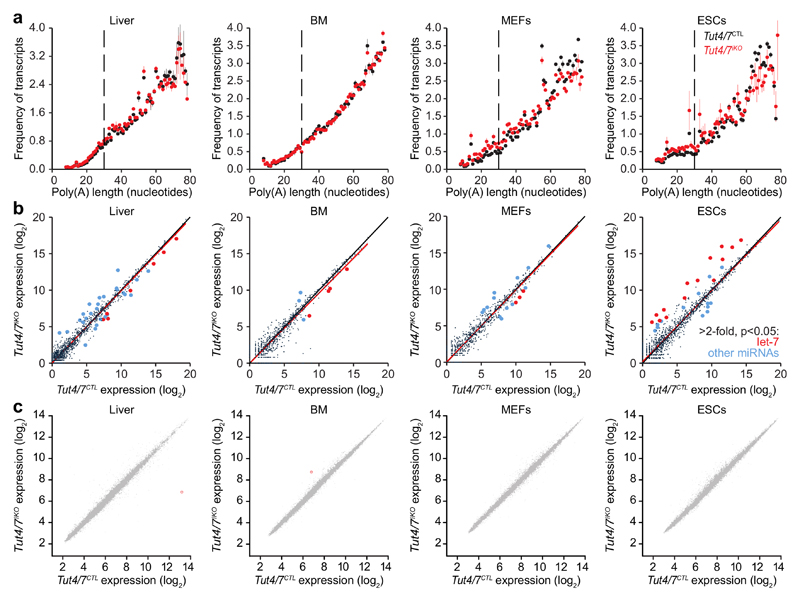
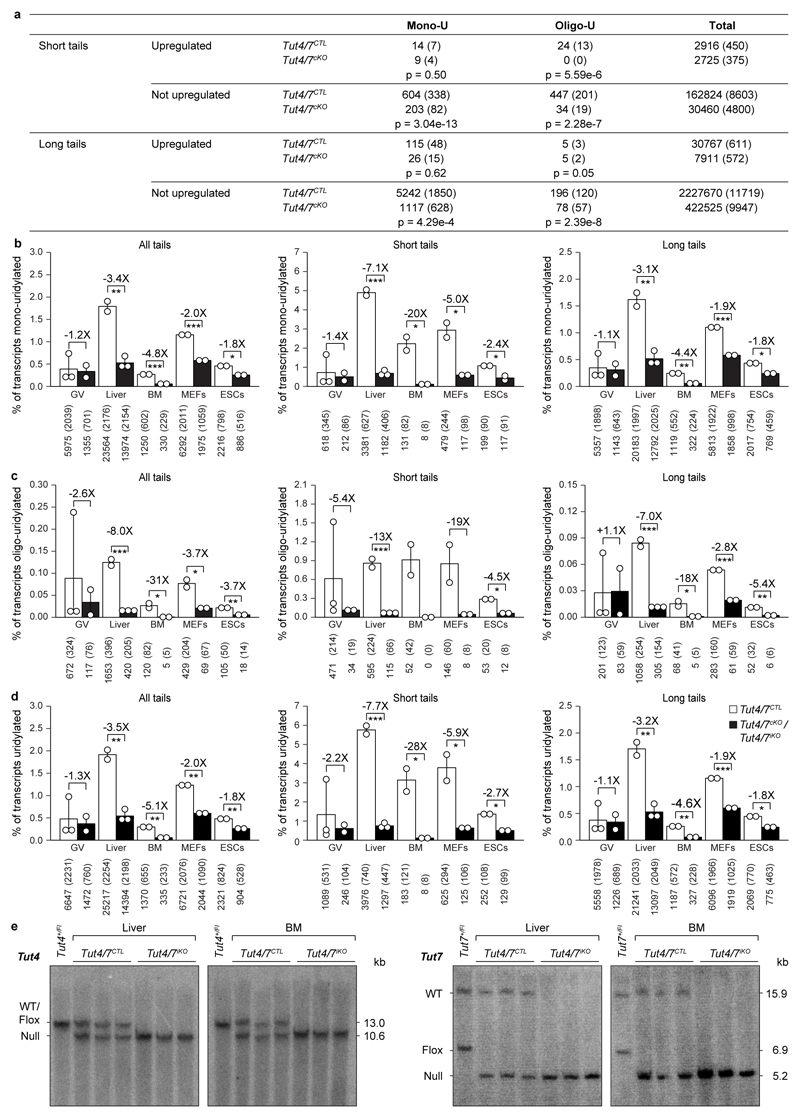
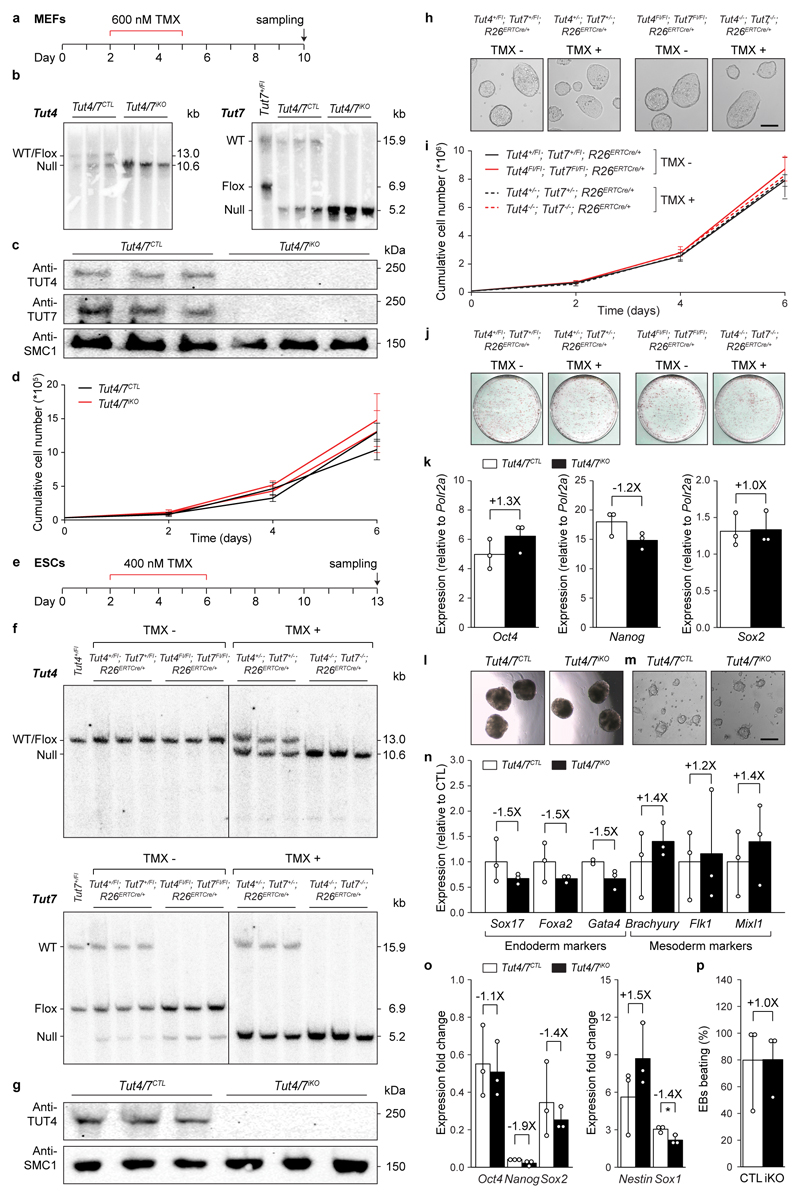
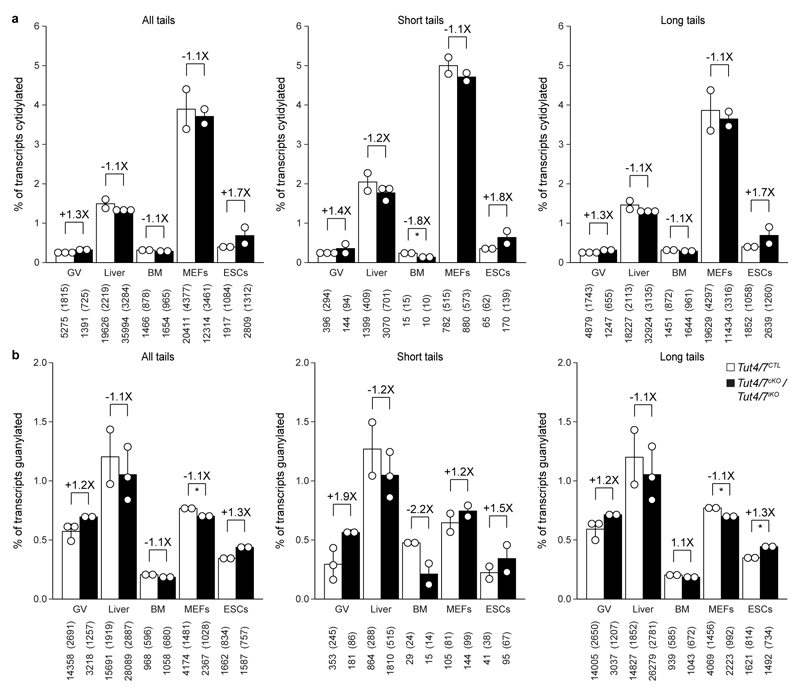
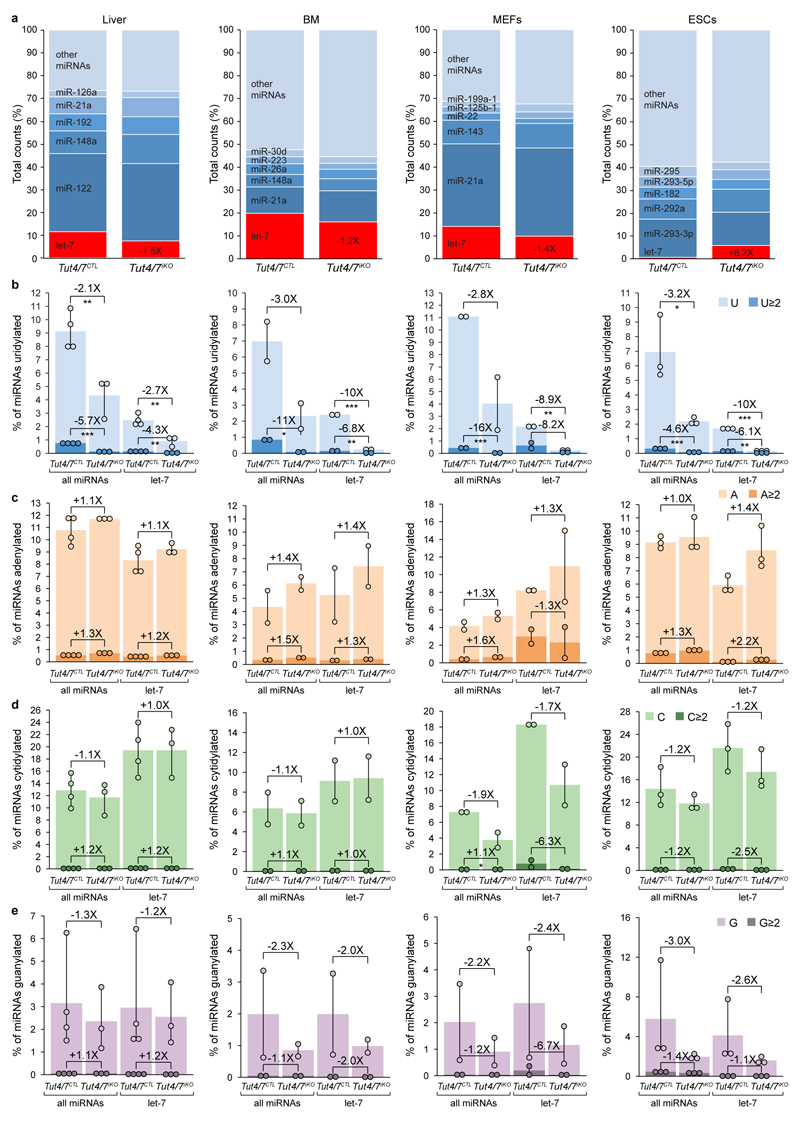
One can argue that the loss of a central RNA degradation targeting pathway will inevitably be detrimental to oogenesis or indeed any cell type or tissue. We therefore sought to understand if TUT4/7-mediated uridylation is a ubiquitous regulator of mRNA degradation. To this end, we combined the ubiquitously-expressed tamoxifen inducible Cre (R26ERTCre) allele with the Tut4Fl and Tut7Fl alleles to generate control Tut4+/Fl; Tut7+/Fl; R26ERTCre/+ and experimental Tut4Fl/Fl; Tut7Fl/Fl; R26ERTCre/+ mice. ESCs and MEFs were derived from these mice and tamoxifen treatment used to induce deletion, generating control Tut4+/-; Tut7+/-; R26ERTCre/+ (Tut4/7CTL) and experimental induced Tut4-/-; Tut7-/-; R26ERTCre/+ (Tut4/7iKO) cell lines (Extended Data Fig. 8). The loss of TUT4/7 did not impact ESC/MEF proliferation, ESC pluripotency or differentiation (Extended Data Fig. 8). We also administered tamoxifen in vivo to generate Tut4/7CTL and Tut4/7iKO adult mice; sampling of liver and bone marrow confirmed complete deletion in the respective tissues (Extended Data Fig. 7e), and these mice appeared healthy up to several months after deletion. We next performed TAIL-seq on the respective transcriptomes to gain insight into terminal mRNA uridylation in vivo. The loss of TUT4/7 did not grossly impact the poly(A) tail length profile of the transcriptomes in the respective cell types (Fig. 4a). However, both mono-uridylation and to a higher extent oligo-uridylation were reduced in all the respective transcriptomes (Extended Data Fig. 7b-d). Furthermore, the reduction of uridylation in the respective transcriptomes did not significantly affect other terminal mRNA modifications (Extended Data Fig. 9). In contrast to oocytes, the miRNA pathway is functional in somatic cells20,21. TUT4/7-deficiency overall had a very modest impact on miRNA expression levels (Fig. 4b and Extended Data Fig. 10a). In ESCs, where LIN28a is expressed and TUT4/7-mediated oligo-uridylation inhibits pre-let-7 processing18,22, an increase in let-7 dosage was observed in the absence of TUT4/7. The opposite effect was seen in liver, bone marrow and MEFs (Fig. 4b and Extended Data Fig. 10a), where LIN28 is not expressed and TUT4/7-mediated mono-uridylation promotes specific pre-let7 processing23. The loss of TUT4/7 resulted in the reduction of terminal uridylation with a more severe reduction observed for let-7 family members in all somatic cells analyzed (Extended Data Fig. 10b). No significant impact on terminal miRNA adenylation, cytidylation or guanylation was observed in the respective Tut4/7iKO cells/tissues (Extended Data Fig. 10c-e). Finally, the loss of TUT4/7 with the consequent reduction of terminal mRNA uridylation and modest alterations to the miRNome did not have any appreciable impact on the gene expression within any of the cell types/tissues analyzed (Fig. 4c and Extended Data Fig. 5c-f). In summary, TUT4/7-mediated uridylation is not an essential requirement for mRNA degradation in somatic cells. However, given that TUT4/7 are broadly expressed, one cannot exclude a function for TUT4/7-mediated mRNA 3′ uridylation beyond steady state in managing somatic cell stress responses.
Figure 4. TUT4/7-dependent RNA uridylation in different tissues and cell lines does not impact gene expression.
a, Frequency of transcripts plotted against poly(A) tail length (8-78 nucleotides) from Tut4/7CTL and Tut4/7iKO liver, bone marrow (BM), mouse embryonic fibroblast (MEFs), embryonic stem cell (ESCs) transcriptomes. Data points and horizontal lines represent biological replicates’ mean and range, respectively. The data for the Tut4/7CTL samples are derived from the libraries presented in Fig. 1. For the Tut4/7iKO libraries the number of transcripts / number of genes / percentage of transcripts with poly(A) tail length shorter than 79 nucleotides are 1,604,023 / 9,986 / 51% for liver, 62,284 / 5,638 / 8% for BM, 115,624 / 6,754 / 27% for MEFs, and 113,808 / 6,897 / 25% for ESCs. b, miRNA expression scatterplots showing relative average miRNA expression levels between Tut4/7CTL and Tut4/7iKO tissues and cell lines. Let-7 family members and other miRNAs with significant (p < 0.05) and more than 2-fold change in expression levels are highlighted in red and blue, respectively. The linear regression fit is shown in red. c, Expression scatterplots showing relative average expression of transcripts between Tut4/7CTL and Tut4/7iKO tissues and cell lines. Significantly deregulated (p < 0.01) genes with a fold change greater than 2.0 are shown in red.
A widely recognized feature in building a maternal transcriptome is the necessity to stabilize RNA that is achieved by stabilizing RNA binding proteins such as MSY224 and the downregulation of RNA degradation pathways25,26. However, limited degradation is also required to define the maternal transcriptome inferred by the distinct transcriptomes of growing oocyte stages4 and data presented herein. The consequence of failing to degrade transcripts during oocyte growth results in the overexpression of ~700 genes and generates a dysfunctional maternal transcriptome, poisoning oocyte maturation. A very short poly(A) tail likely provides the recognition signal to engage the TUT4/7-mediated 3′ uridylation pathway. Indeed, a poly(A) tail length of less than ~27 nucleotides leads to a loss of PABP occupancy12,13 and is a proven substrate for TUT4/7 binding and subsequent uridylation9. In addition, the failure to degrade the TUT4/7-dependent transcripts results in their accumulation with ~10 nucleotide poly(A) tails. The derailing of meiotic maturation in Tut4/7cKO mice may arise from alterations to the proteome and/or the accumulation of these transcripts with short poly(A) tails. Oligo-uridylation appears to be the primary signal that instructs transcript degradation in oocytes, as evidenced by the observation that TUT4/7-deficiency modestly affects terminal mono-uridylation but abolishes oligo-uridylation in the TUT4/7-targeted transcripts with short poly(A) tails. A positive correlation between poly(A) tail length and translation efficiency of maternal transcripts is a conserved feature of early animal development27–30. Here we show a function for 3′ terminal uridylation and poly(A) tail length in the formation of the maternal mammalian transcriptome. Thus, poly(A) tail length regulation is important for both defining and activating the maternal transcriptome.
Methods
Mice and alleles used in this study
For the Tut4HA-GFP allele, we inserted the sequence encoding FLAG-HA2-PreScission-His6x-eGFP (FHpHG) after the endogenous ATG initiation codon within exon 3, the first coding exon of Tut4. A targeting construct was recombineered that contained homology arms and a loxP flanked neomycin cassette 3′ of exon 3. Southern blotting of genomic NheI-digested DNA from individual ESC-derived clones with a 3′ probe was used to identify homologous recombinants. A 12.0-kb DNA fragment corresponds to the wild type Tut4 locus; integration of the loxP flanked neomycin cassette 3′ of exon 3 introduced an additional NheI site, thus decreasing the size of the NheI DNA fragment to 7.1 kb in the targeted allele. Cre-mediated recombination and excision of the loxP flanked neomycin cassette resulted in a 5.2-kb NheI DNA fragment recognized by the 3′ probe, which is diagnostic of the Tut4HA-GFP allele.
For the Tut7HA-GFP allele, we inserted the sequence encoding FLAG-HA2-eGFP (FHG) after the endogenous ATG initiation codon within exon 2, the first coding exon of Tut7. A targeting construct was recombineered that contained homology arms and a loxP flanked neomycin cassette 3′ of exon 2. Southern blotting of genomic BamHI-digested DNA from individual ESC-derived clones with a 3′ probe was used to identify homologous recombinants. A 12.2-kb DNA fragment corresponds to the wild type Tut7 locus; integration of the loxP flanked neomycin cassette 3′ of exon 2 introduced an additional BamHI site, thus decreasing the size of the BamHI DNA fragment to 6.2 kb in the targeted allele. Cre-mediated recombination and excision of the loxP flanked neomycin cassette resulted in a 4.3-kb BamHI DNA fragment recognized by the 3′ probe, which is diagnostic of the Tut7HA-GFP allele.
For the Tut4Fl allele, we flanked exon 14 and 15 with loxP sites, Cre-mediated deletion of which results in out-of-frame splicing between exon 13 and 16, leading to a premature stop codon. To generate this allele, a targeting construct was generated that contains homology arms, an FRT flanked neomycin cassette and a loxP site 5′ of exon 14 and a second loxP site 3’ of exon 15. Southern blotting of genomic BamHI-digested DNA from individual ESC-derived clones with a 5′ probe was used to identify homologous recombinants. A 16.9-kb DNA fragment corresponds to the wild type Tut4 locus; integration of the FRT flanked neomycin cassette 3′ of exon 15 introduces an additional BamHI site, thus decreasing the size of the BamHI DNA fragment to 7.0 kb in the targeted allele. Flp-mediated recombination removed the FRT flanked neomycin cassette and generated the Tut4Fl allele that can be identified with the 3’ probe as a 13.1-kb EcoRV DNA fragment. Cre-mediated recombination and excision of exon 14 and 15 resulted in a 10.6-kb EcoRV DNA fragment recognized by the 3′ probe, which is diagnostic of the Tut4 null (Tut4-) allele.
For the Tut7Fl allele, we flanked exon 15 with loxP sites, Cre-mediated deletion of which results in out-of-frame splicing between exon 14 and 16, leading to a premature stop codon. To generate this allele, a targeting construct was generated that contains homology arms, an FRT-flanked neomycin cassette and loxP sites 5′ and 3′ of exon 15. Southern blotting of genomic EcoRV-digested DNA from individual ESC-derived clones with a 5′ probe was used to identify homologous recombinants. A 15.9-kb DNA fragment corresponds to the wild type Tut7 locus; integration of the FRT flanked neomycin cassette 5′ of exon 15 introduces an additional EcoRV site, thus decreasing the size of the EcoRV DNA fragment to 8.8 kb in the targeted allele. Flp-mediated recombination removed the FRT-flanked neomycin cassette and generated the Tut7Fl allele that can be identified with the 5′ probe as a 6.9-kb EcoRV DNA fragment. Cre-mediated recombination and excision of exon 15 resulted in a 5.2-kb EcoRV DNA fragment recognized by the 5′ probe, which is diagnostic of the Tut7 null (Tut7-) allele.
In order to generate the Tut4AAD allele we replaced wild type exon 15 with a mutant exon where the aspartic acid 1026 and 1028 codons are mutated to encode alanine. A targeting construct was recombineered that contains homology arms and a FRT flanked neomycin cassette 3′ of exon 15 that contains the D1026A and D1028A mutations. Southern blotting of genomic BamHI-digested DNA from individual ESC-derived clones with a 5′ probe was used to identify homologous recombinants. A 16.9-kb DNA fragment corresponds to the wild-type Tut4 locus; integration of the FRT flanked neomycin cassette 3′ of exon 15 introduces an additional BamHI as well as a PmeI site, thus decreasing the size of the BamHI DNA fragment to 12.4 kb in the targeted allele. Flp-mediated recombination and excision of the FRT flanked neomycin cassette removes the additional BamHI site and results in a 10.5-kb BamHI-PmeI DNA fragment recognized by the external 5′ probe, which is diagnostic of the Tut4AAD allele.
The targeting for all alleles was performed in A9 ESCs. Southern blotting as described above of the individual ESC-clone-derived DNA was used to identify homologous recombinants. A9-targeted ESCs were injected into C57BL/6 eight-cell-stage embryos as described31. The targeted Tut4HA-GFP-Neo/+ and Tut7HA-GFP-Neo/+ mice were crossed to Deleter Cre mice32 to remove the loxP flanked neomycin cassette and generate Tut4HA-GFP/+ and Tut7HA-GFP/+ mice, respectively. The targeted Tut4Neo/+, Tut7Neo/+ and Tut4AAD-Neo/+ mice were crossed to FLP-expressing transgenic mice33 to remove the FRT flanked neomycin cassette and generate Tut4Fl/+, Tut7Fl/+ and Tut4AAD/+ mice, respectively. Mice heterozygous for the Tut4Fl and Tut7Fl allele were further crossed to Deleter Cre mice32 to generate the Tut4- and Tut7- allele, respectively. The mice analyzed in this study were on a C57Bl/6 genetic background. The Zp3Cre allele16 and the R26ERTcre allele34 were also used in this study. To induce Cre-mediated gene deletion, mice of two months of age were intraperitoneally injected with a dose of 75 mg tamoxifen/kg body weight for a total of five times. Tamoxifen was administered every other day, with a break of three weeks between the third and fourth injection. Mice were allowed to recover for at least another three weeks after the last tamoxifen injection prior to tissue collection.
All of the mice were bred and maintained at the EMBL Mouse Biology Unit, Monterotondo, in accordance with current Italian legislation (Article 9, 27. Jan 1992, number 116) under license from the Italian Health Ministry.
Southern blotting
DNA was restriction-digested, separated on a 0.8% agarose gel and transferred to a Hybond-XL membrane (Amersham) in alkaline solution (0.4 M NaOH, 1.5 M NaCl). The blot was neutralized in 2X SSC solution, UV-crosslinked at 150 mJ and then prehybridized for two hours in prehybridization solution (0.5 M Na2HPO4, 1 mM EDTA, 5% SDS, 3% BSA). A DNA probe was labeled with the Random Primers DNA Labeling System (Thermo Fisher Scientific) according to the manufacturer’s manual. The membrane was hybridized overnight, washed in 40 mM Na2HPO4, 1 mM EDTA, 5% SDS and exposed on a phosphor screen (Fujifilm).
Western blotting
Cells or homogenized tissues were incubated in lysis buffer (50 mM Tris pH 8.0, 150 mM NaCl, 5 mM MgCl2, 15% glycerol, 1 mM DTT, 0.5% sodium deoxycholate, 0.5% Triton X-100, protease inhibitors) for 10 minutes on ice. After centrifugation at 14,000 g for 10 minutes at 4°C, the supernatant was recovered, the protein extract separated on a 4-12% Bis-Tris protein gel (Invitrogen) and transferred overnight by wet transfer onto a nitrocellulose membrane (GE Healthcare). The membrane was blocked with 3% milk/0.1% Tween-20 in PBS, incubated in primary antibody in 3% milk/0.1% Tween-20 in PBS overnight, washed in 0.1% Tween-20 in PBS, and incubated with appropriate horseradish peroxidase-coupled secondary antibody (Amersham) in 3% milk/0.1% Tween-20 in PBS for one hour. Proteins were detected using the ECL Western Blotting Detection Reagent (Amersham). The antibodies anti-TUT4 (Proteintech, 18980-1-AP), anti-AGO2 (O’Carroll lab), anti-HA (Covance, MMS-101P) and anti-α-tubulin (Sigma, T9026) were used at 1:1000, anti-TUT7 (a gift from R. Pillai, University of Geneva) at 1:2000, and anti-SMC1α (Bethyl, A300-055A) at 1:10,000.
Immunofluorescence staining
HA-GFP-TUT4 and HA-GFP-TUT7 fusion proteins were stained using the anti-HA (Covance, MMS-101P) antibody. Ovaries were collected and fixed in 4% formaldehyde overnight and embedded in paraffin. Sections of 6 μm thickness were stained as described previously35. Free oocytes were fixed in 2% paraformaldehyde for 10 minutes and washed twice with 10% Normal Donkey Serum (NDS) (Sigma Aldrich), 0.1% BSA in PBS. Oocytes were then blocked with 10% NDS, 0.1 M Glycine and 2% BSA in PBS, permeabilized with 0.1% Triton X-100, 10% NDS, 0.1% BSA in PBS and washed again. The anti-β-tubulin (Sigma Aldrich, T4026) primary antibody and the Alexa Fluor Donkey (Invitrogen, A-21202) secondary antibody were used at 1:200 and 1:1000, respectively. DNA was stained with 5 μg/ml of Hoechst 33342 for 10 minutes at room temperature. Cells were mounted on slides for confocal microscopy. Images were acquired with a Leica TCS SP5 confocal microscope and Photoshop was used for cropping and other modifications that were equally performed on control and experimental samples.
Oocyte collection
For the collection of GV oocytes, three weeks old females were stimulated with 10 U of pregnant mare’s serum gonadotropin (PMSG) and their ovaries were removed and placed in M2 medium. GV oocytes were released from the somatic cells via manual mechanical separation as described4. GV oocytes were then washed in M2 medium. For MII oocytes collection, three weeks old females were injected with 10 U of PMSG and 48 hours later with 10 U of human chorionic gonadotropin (hCG). Oocytes were collected 14 hours later from the oviduct.
RNA extraction, quantification and quality control
Total RNA was extracted using QIAzol lysis reagent (Qiagen) according to manufacturer’s instructions. RNA concentration was measured with a Qubit fluorometer (Invitrogen) and quality was verified with a Bioanalyzer (Agilent Technologies).
TAIL-seq
TAIL-seq libraries were generated and analyzed as described11 with the following modifications. Instead of performing a HiSeq asymmetric 50-250 base pair paired-end run, a 100 base pair HiSeq symmetric paired-end run was used. The starting material used for all cells and tissues (except for oocytes) was 5 μg of total RNA. Biological replicates are shown for each tissue/cell. Approximately 100-150 ng of GV oocyte total RNA was mixed with 850-900 ng of C. elegans total RNA in order to have sufficient RNA for TAIL-seq library preparation. To account for artifacts associated with PCR amplification, barcoded 3’ adapters were used with unique molecule identifiers and only one read per ligation event was used in the final analysis. To equalize read depth, the somatic libraries were multiplexed with four libraries sequenced per lane of an Illumina HiSeq 2000, whereas each GV oocyte library was run on two lanes of the same sequencer. The original TAIL-seq pipeline11 was used to determine the poly(A) tail length and map the reads. C. elegans transcripts in GV oocyte libraries were removed during the alignment of the reads to the mouse genome. The TAIL-seq learning algorithm was validated using the previously published spikes-ins11. The pipeline precisely determined the length of the spikes-ins (Extended Data Fig. 2a). A systematic decrease in the read recovery for the spikes-ins with longer poly(A) tails (Extended Data Fig. 2b) was observed. To account for differences in read recoveries, a linear model was fitted to the spike-ins (log2) read recovery using the spike-in’s known poly(A) lengths as predictors (Extended Data Fig. 2b). The model was then used to predict the relative recovery for each nucleotide in the 8 to 79 nucleotide range. For poly(A) length analyses the read recovery of transcripts with poly(A) lengths in the range from 8 to less than or equal to 78 nucleotides was adjusted according to their predicted recovery. To estimate the adjusted fraction of transcripts with poly(A) tails less than or equal to 78, the transcripts with poly(A) tails outside this range were assigned a poly(A) length of 79 nucleotides.
Early embryo development assay
Adult females were stimulated with 10 U of PMSG. After 48 hours the females were injected with 10 U of hCG and set up with a stud C57Bl/6 male of proven fertility. Plugs were checked on the following morning and zygotes were collected in M2 media (Sigma Aldrich) from the oviduct of plugged females. Embryos were cultured under 5% CO2 supplemented atmosphere at 37°C in KSOMaa Evolve media (Zenith Biotech) and the progression was scored every 24 hours for five days.
Oocyte in vitro maturation assay and NSN/SN analysis
GV oocytes were cultured in KSOMaa Evolve medium (Zenith Biotec) at 37°C and 5% CO2 and their maturation was examined after 2, 4, 12 and 24 hours. Progression though meiosis was monitored by the germinal vesicle breakdown (GVBD) followed by the extrusion of the first polar body (PB). Cells were taken at each time point and processed as previously described for the immunofluorescence staining using anti-β-tubulin (Sigma Aldrich, T4026) antibody and Hoechst 33342 to monitor meiotic progression. For NSN/SN oocyte determination fully grown GV oocytes were collected from ovaries 44-46 hours after PMSG injection, fixed in 4% paraformaldehyde for 15 minutes and washed three times with 0.1% Tween 20, 3% BSA in PBS. Oocytes were permeabilized in 0.5% Triton X-100, 3% BSA in PBS for 35 minutes and washed three times with 0.1% Tween 20, 3% BSA in PBS. Oocytes were then stained with Hoechst 33342 for 20 minutes and mounted on Teflon coated slides (Dutscher scientific).
Gene expression analysis
For microarray profiling of oocytes, biotinylated cDNA was synthesized from total RNA using the Ovation Pico WTA System V2 kit (NuGen). The fragmentation and labeling was done using the Encore Biotin Module (NuGen). For all other cells and tissues, biotinylated cDNA was synthesized from total RNA using the Ambion WT Expression kit. The fragmentation and labeling was done using the GeneChip WT Terminal Labeling and Controls kit (Affymetrix). Next, cDNA was hybridized for 16 hours at 45°C on a GeneChip Mouse Gene 2.0 ST Array (Affymetrix). GeneChips were washed and stained in the Affymetrix Fluidics Station 450. Biological replicates were used for the analyses; GV Tut4/7CTL, n=3; GV Tut4/7cKO, n=4; GV Tut4/7cAAD, n=3; Liver Tut4/7CTL, n=3; liver Tut4/7iKO, n=3; BM Tut4/7CTL, n=2; BM Tut4/7iKO, n=2; MEFs Tut4/7CTL, n=3; MEFs Tut4/7iKO, n=3; ESCs Tut4/7CTL, n=3; ESCs Tut4/7iKO, n=3).
For qRT-PCR, total RNA was reverse-transcribed using SuperScript III and random hexamers (both Invitrogen) according to manufacturer’s instructions. qRT-PCR was performed using the LightCycler 480 SYBR Green I Master mix (Roche), and samples were run in technical duplicates or triplicates on a Roche LightCycler 480 instrument. Ct values were normalized against the internal controls Polr2a, Gapdh, or Sod1. Fold differences in expression levels were calculated according to the 2−ΔΔCT method36.
Statistics
For RNA profiling, robust multi-array average (RMA) was used to normalize the raw data and differential expression was determined with the limma package37. Adjusted p-values for the moderated t-statistic were used. For the cluster analysis of transcripts across folliculogenesis, we used the previously described dataset4. Transcripts were clustered using the Markov clustering (MCL) algorithm implemented in the BioLayout express software19. The MCL inflation value was set at 2.2. The enrichment or depletion of upregulated genes in each cluster was determined using the hypergeometric test. Gene ontology enrichment was established with Fisher’s exact test using the R topGO package. T-tests were used to compare differences between treatments assuming equal variance and, unless otherwise stated, were two-tailed. All comparisons were made only using biological replicates as data points. Pearson’s chi-squared test was used to determine the differences in the levels of mono and oligo-uridylation between upregulated and not upregulated genes in TUT4/7 deficient oocytes and control oocytes. Fisher's exact tests were used to evaluate the differences between oocytes in SN and NSN and follicles with developed and underdeveloped antra for Tut4/7CTL and Tut4/7cKO animals.
Data reporting
No statistical methods were used to predetermine sample size. The experiments were not randomized and the investigators were not blinded to allocation during experiments and outcome assessment.
Histology
Ovaries from adult females were collected and fixed in Bouins solution overnight and embedded in paraffin. Standard Periodic Acid-Schiff (PAS) staining was performed on sections 7 μm thick.
MEF culture
Primary MEFs were derived from embryonic day 13.5 embryos according to standard protocols. Cells were cultured in MEF medium (DMEM supplemented with 12.5% fetal calf serum, 2 mM L-glutamine, 1X non-essential amino acids, 100 units/ml penicillin/streptomycin and 100 μM β-mercaptoethanol (all Gibco)) at 37°C and 7.5% CO2. Immortalized MEFs were generated by two consecutive retroviral infections of passage 2 primary MEFs with pBabeSV40LT (a gift from G. Hannon, Cold Spring Harbor Laboratory). To induce Cre-mediated gene deletion, cells were incubated with 600 nM 4-OH-tamoxifen in MEF medium for three days. To determine the growth curve for each line, 68,000 cells per well were plated in a 6-well plate in triplicate for each day of the experiment. Cells were trypsinized and counted with a Cellometer X2 Image Cytometer (Nexcelom). Cells were routinely tested for mycoplasma contamination by PCR; no further verification of the cell line identity was performed.
ESC culture and differentiation
ESCs were derived from mice backcrossed one generation into the 129S2/SvPasCrl (Charles River Laboratories) background as described38. Cells were maintained on 0.1% gelatin in ESC medium (KnockOut DMEM supplemented with 12.5% fetal calf serum, 2 mM L-glutamine, 1X non-essential amino acids, 100 units/ml penicillin/streptomycin, 100 μM β-mercaptoethanol (all Gibco), 1 μM PD0325901, 3 μM CHIR99021 (both University of Dundee), and 20 ng/ml LIF (EMBL Heidelberg)) at 37°C and 7.5% CO2. To induce Cre-mediated gene deletion, cells were incubated with 400 nM 4-OH-tamoxifen in ESC medium for four days. To determine the growth curve for each line, 100,000 cells per well were plated in a 6-well plate in triplicate for each day of the experiment. Cells were trypsinized and counted with a Cellometer X2 Image Cytometer (Nexcelom). Cells were routinely tested for mycoplasma contamination by PCR; no further verification of the cell line identity was performed.
For the alkaline phosphatase staining, ESCs were seeded at 3,000 cells in a 10-cm dish and cultured for eight days. Cells were then washed with PBS, air-dried and stained with AP staining solution (100 mM Tris pH 9, 100 mM NaCl, 5 mM MgCl2, 0.4 μg/ml naphtol phosphate and 1 μg/ml Fast Violet B (both Sigma)) for 15 minutes. Cells were washed again with PBS, air dried and analyzed.
Embryoid bodies (EBs) were derived by culturing ESCs according to the hanging drop method39. Drops of EB differentiation medium (DMEM supplemented with 20% FCS, 2 mM L-glutamine, 1X non-essential amino acids, 100 units/ml penicillin/streptomycin and 100 μM β-mercaptoethanol (all Gibco)) containing 1,000 ES cells were placed onto the lids of culture dishes and cultured for two days. EBs were then transferred onto bacterial plates and cultured in suspension for another two days. For the cardiac differentiation assay, single EBs were plated onto gelatin-coated 24-well plates and checked daily for contractile activity.
In vitro differentiation into neural progenitor cells was achieved by culturing ESCs on 0.1% gelatin in neuronal differentiation medium (1:1 mixture of DMEM/F-12 and Neurobasal-A medium supplemented with 0.5X N-2, 0.5X B-27 (all Gibco), 25 μg/ml BSA, 1 mM L-glutamine, 10 μg/ml insulin, 150 nM thioglycerol, 1 μg/ml heparin (all Sigma) and 250 ng/ml FGF-basic (Peprotech)) for three days.
Small RNA sequencing
Small RNA libraries were generated using the NEBNext Multiplex Small RNA Library Prep Set for Illumina (Set 1) (NEB) according to manufacturer’s instructions. Samples from the same tissue or cell line were multiplexed, pooled and run in one lane of HiSeq. For the analysis of the small RNA-seq data, plain miRNA counts were identified from the small RNA-seq input samples, cleaned from their 3’ adapters and mapped against all mouse hairpin precursors of the miRBase, allowing up to two mismatches using Chimira40,41. Counts of multi-mapped reads were assigned only to the first optimal alignment call returned by BLASTn. Modification analysis was then restricted to pure modification events, i.e. mono-[nt] or poly-[nt] patterns, where [nt] can be the nucleotides U, A, C or G. Poly-[nt] modifications refer to sequences of two or more identical nucleotides. Counts from all other miRNA variants were collapsed with their respective unmodified miRNA counts. Normalization of control and experimental samples and identification of differentially expressed miRNAs was done using the DESeq2 software package42.
Extended Data
Extended Data Figure 1. Generation and analysis of Tut4 and Tut7 reporter alleles.
a, Tut4HA-GFP reporter allele targeting strategy. Depicted at the top is the domain organization of the TUT4 protein consisting of C2H2 and CCHC-type zinc finger domains, an inactive nucleotidyl-transferase (iNT) domain, a polymerase-associated domain (PAD) and a nucleotidyl-transferase (NT) domain. Below it, the 5’ portion of the Tut4 locus, the targeting vector for the insertion of FLAG-HA2-PreScission-His6x-eGFP (FHpHG) into the first coding exon of Tut4 as well as the targeted Tut4 locus before and after Cre-mediated deletion of the loxP site (indicated by red triangles) flanked neomycin (neo) resistance cassette are shown. The position of the diphtheria toxin A (DTA) selection marker within the targeting vector is shown. The NheI restriction sites as well as the expected Southern fragments detected by the 3’ probe are indicated. Depicted at the bottom is the structure of the resulting HA-GFP-TUT4 protein. b, Tut7HA-GFP reporter allele targeting strategy for the insertion of FLAG-HA2-eGFP (FHG) into the first coding exon of Tut7 is depicted as in (a). The BamHI restriction sites as well as the expected Southern fragments detected by the 3’ probe are indicated. c, Southern blot of NheI-digested genomic DNA from wild type, Tut4HA-GFP-Neo/+ and Tut4HA-GFP/+ tails hybridized with the 3’ probe shown in (a). d, Southern blot of BamHI-digested genomic DNA from wild type, Tut7HA-GFP-Neo/+ and Tut7HA-GFP/+ tails hybridized with the 3’ probe shown in (b). e, Western blot using anti-HA, anti-TUT4 and anti-tubulin antibodies on testis whole cell extracts of wild type, Tut4-/- and Tut4HA-GFP/HA-GFP mice is shown. f, Western blot using anti-HA, anti-TUT7 and anti-tubulin antibodies on testis whole cell extracts of wild type, Tut7-/- and Tut7HA-GFP/HA-GFP mice is shown. g, Confocal immunofluorescence micrographs of wild type, Tut4HA-GFP/HA-GFP and Tut7HA-GFP/HA-GFP ovary sections stained with anti-HA antibody (green) and Hoechst 33342 (blue) are shown as indicated. Broken white circles highlight the oocyte within the follicle. Insets are magnifications of the oocytes. Scale bars are 30 μm.
Extended Data Figure 2. Analysis of DNA spike-in standards used for TAIL-seq library preparations and mRNA uridylation counts.
a, Cumulative frequency of poly(A) length determined by the TAIL-seq algorithm for the different standards used. b, Relative read recoveries of the spike-ins according to their poly(A) tail length. All standards were normalized to the spike-in of 0 length. The linear regression line is shown in blue. a indicates slope and b the y-intercept. c, Mono- and oligo-uridylation counts for transcript with short poly(A) tail length (≤ 30 nucleotides). The number of transcripts with short poly(A) tail length and the number of genes represented by these transcripts are shown for the indicated tissues and cell lines.
Extended Data Figure 3. Generation of conditional, null and catalytically inactive alleles for Tut4 and Tut7.
a, Tut4 targeting and deletion strategy. Domain organization of TUT4/7 is presented as in Extended Data Fig. 1a. A portion of the Tut4 locus, the targeting vector used to introduce the loxP sites into the Tut4 locus to flank the exons 14 and 15 and the targeted Tut4 gene before and after Flp-mediated recombination as well as after Cre-mediated recombination are shown. Green and red triangles represent FRT and loxP sites, respectively. Rectangles indicate the position of the neomycin (neo) and diphtheria toxin A (DTA) selection marker genes. The EcoRV and BamHI restriction sites as well as the expected Southern fragments detected by the 5’ probe are indicated. b, Tut7 targeting and deletion strategy. A portion of the Tut7 locus, the targeting vector used to introduce the loxP sites into the Tut7 locus to flank exon 15 and the targeted Tut7 gene before and after Flp-mediated recombination as well as after Cre-mediated recombination are shown. The EcoRV restriction sites as well as the expected Southern fragments detected by the 5’ probe are indicated. c, Southern blot of BamHI digested genomic DNA from wild type and Tut4Neo/+ tails hybridized with the 5’ probe shown in (a). d, Southern blot of EcoRV-digested genomic DNA from wild type, Tut7Flox/Flox and Tut7-/- tails hybridized with the 5’ probe shown in (b). e, Western blot using anti-TUT4, anti-TUT7 and anti-tubulin antibodies on testis (Tes) and thymus (Thy) whole cell extracts of wild type, Tut4-/- and Tut7-/- mice. f, Targeting strategy used to generate the Tut4AAD allele. A portion of the Tut4 locus, the targeting vector used for the introduction of the D1026A and D1028A mutations and the targeted Tut4 gene before and after Flp-mediated recombination are shown. The BamHI and PmeI restriction sites as well as the expected Southern fragments detected by the 5’ probe are indicated. g, Chromatograms showing a portion of Tut4 exon 15 highlighting the two aspartate and alanine codons of wild type and Tut4AAD/AAD mice, respectively. h, Southern blot of BamHI-PmeI-digested genomic DNA from wild type and Tut4AAD/+ tails hybridized with the 5’ probe shown in (f). i, Western blots using anti-TUT4 and anti-AGO2 antibodies on testis whole cell extracts from wild type and Tut4AAD/AAD mice.
Extended Data Figure 4. Antral follicle morphology and in vitro oocyte maturation upon TUT4/7-deficiency.
a, The frequency of developing and developed antral follicles in Tut4/7CTL and Tut4/7cKO mice is shown (Fisher’s exact test; N.S., not significant). The number of follicles and mice analyzed is: Tut4/7CTL, n=52 follicles, n=5 mice and Tut4/7cKO, n=49 follicles, n=5 mice. b, Representative confocal immunofluorescence micrographs of Tut4/7CTL and Tut4/7cKO fully grown germinal vesicle (GV) oocytes stained with Hoechst 33342 are shown in the left panel. The non-surrounded nucleolus (NSN) and surrounded nucleolus (SN) states are indicated. Broken white circles highlight the oocytes. Scale bars indicate 20 μm. The frequency of NSN and SN state in Tut4/7CTL and Tut4/7cKO GV oocytes is shown in the right panel (Fisher’s exact test; *, p < 0.05) The number of oocytes and mice analyzed is: Tut4/7CTL, n=85 oocytes, n=3 mice and Tut4/7cKO, n=135 oocytes, n=3 mice. c, In vitro oocyte maturation of Tut4/7CTL, Tut4/7cKO and Tut4/7cAAD oocytes. The frequency of germinal vesicle (GV) oocytes, germinal vesicle breakdown (GVBD) oocytes and oocytes with polar bodies (PB) is shown at different time points after collection and culture. The number (n) of oocytes analyzed is: Tut4/7CTL n=160 oocytes, n=4 mice; Tut4/7cKO n=194 oocytes, n=3 mice and Tut4/7cAAD n=183 oocytes, n=3 mice. d, Representative confocal immunofluorescence micrographs of in vitro maturating Tut4/7CTL, Tut4/7cKO and Tut4/7cAAD oocytes stained with anti-tubulin antibody (green) and DNA stained with Hoechst 33342 (red) and the indicated time points are presented. Scale bars indicate 20 μm.
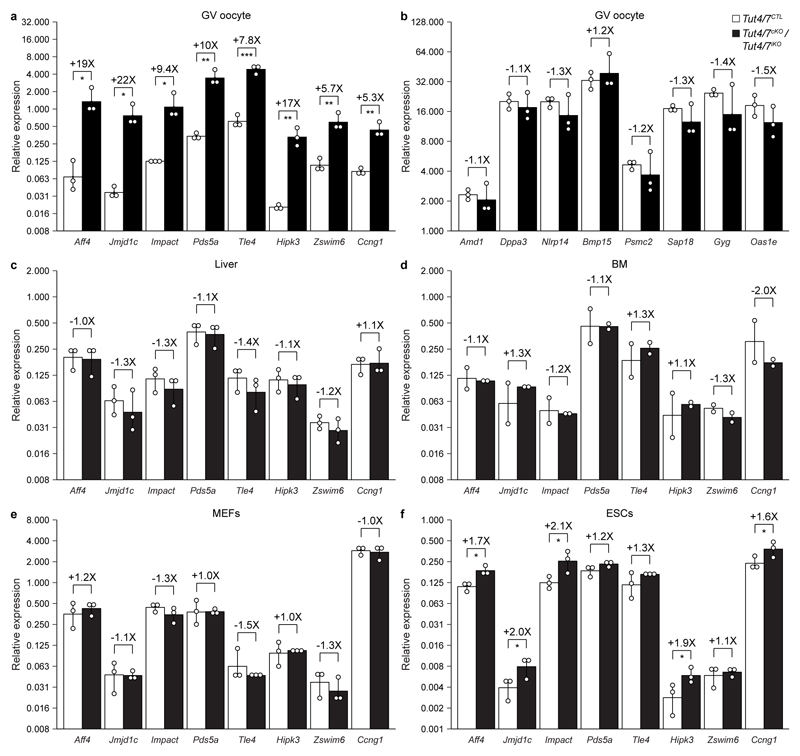
Extended Data Figure 5. Validation of gene expression changes upon loss of TUT4/7 in different tissues and cell lines.
a-f, Relative expression of genes in Tut4/7CTL and Tut4/7cKO germinal vesicle (GV) oocytes (a, b) as well as Tut4/7CTL and Tut4/7iKO liver (c), bone marrow (BM, d), mouse embryonic fibroblasts (MEFs, e) and embryonic stem cells (ESCs, f) as determined by qRT-PCR is shown. Depicted are representative genes that have been determined to be upregulated (a) and unchanged (b-f) according to microarray profiling. Ct values were normalized against Polr2a, Gapdh, and Sod1. Data points represent biological replicates (n=3); the bars’ heights and vertical lines indicate the mean and the range, respectively. The fold change and significance are indicated (one-tailed t-test; *, p < 0.05; **, p < 0.01; ***, p < 0.001).
Extended Data Figure 6. RNA profiling analysis of Tut4/7cKO and Tut4/7cAAD germinal vesicle oocytes.
a, b, Expression scatterplot showing relative average expression of transcripts between Tut4/7CTL and Tut4/7cAAD (a) as well as Tut4/7cKO and Tut4/7cAAD (b) germinal vesicle (GV) oocytes. Significantly deregulated (p < 0.01, moderated t-statistic) genes with a fold change greater than 2 are shown in red. c, Gene ontology analysis for upregulated genes in Tut4/7cKO and Tut4/7cAAD GV oocytes; the top ten most significant pathways identified are shown. d, Diagram of oocyte growth stages that have been analyzed (left). The top 30 clusters resulting from the clustering analysis according to gene expression patterns across oocyte growth stages (x-axis) are shown (right). The average expression change for genes within the cluster is indicated by a black line with the standard deviation range indicated in gray.
Extended Data Figure 7. Loss of TUT4/7 reduces both mono- and oligo-uridylation in different tissues and cell lines.
a, Transcript count for upregulated and not upregulated genes in Tut4/7CTL and Tut4/7cKO GV oocytes. The number of transcripts and in brackets the number of genes represented by those transcripts is presented. The p-value determined using the Pearson's chi-squared test is shown. b-d, Quantification of mRNA 3′ terminal mono- (b), oligo- (c) and total uridylation (d) of all transcripts (left panel) as well as those with short (≤ 30 nucleotides) (center panel) and long (> 30 nucleotides) (right panel) poly(A) tails of Tut4/7CTL and Tut4/7cKO germinal vesicle (GV) oocytes as well as Tut4/7CTL and Tut4/7iKO liver, bone marrow (BM), mouse embryonic fibroblasts (MEFs) and embryonic stem cells (ESCs). Data points represent replicates; the bars’ heights and vertical lines indicate the mean and range, respectively. The fold reduction in uridylation and the significance are indicated (t-test; *, p < 0.05; **, p < 0.01; ***, p < 0.001). e, Southern blots of EcoRV-digested genomic DNA from Tut4/7CTL and Tut4/7iKO liver and bone marrow (BM) confirming deletion of Tut4 and Tut7 after tamoxifen administration. The expected sizes for the wild type (WT), the conditional (flox) and the null alleles are indicated.
Extended Data Figure 8. Deletion of Tut4/7 in mouse embryonic fibroblasts and stem cells.
a, Strategy and timing for the acute deletion of Tut4/7 in mouse embryonic fibroblasts (MEFs). TMX denotes 4-OH-tamoxifen. b, Southern blots of EcoRV-digested genomic DNA from Tut4/7CTL and Tut4/7iKO MEF cell lines confirming deletion of Tut4 and Tut7. The expected sizes for the wild type (WT), the conditional (flox) and the null alleles are indicated. c, Western blots probed with the indicated antibodies from Tut4/7CTL and Tut4/7iKO MEF whole cell extracts. d, Growth curve of two independent Tut4/7CTL and Tut4/7iKO MEF cell lines. The mean and s.d. of three technical replicates is shown. e, Strategy and timing for the acute deletion of Tut4/7 in mouse embryonic stem cells (ESCs). f, Southern blots of EcoRV-digested genomic DNA from Tut4+/Fl; Tut7+/Fl; R26ERTCre/+ and Tut4Fl/Fl; Tut7Fl/Fl; R26ERTCre/+ ESC lines before (TMX-) and after (TMX+) deletion of Tut4/7. The expected sizes for the wild type (WT), the conditional (flox) and the null alleles are indicated. g, Western blots probed with the indicated antibodies from Tut4/7CTL and Tut4/7iKO ESC whole cell extracts. h, Representative images showing morphology of Tut4+/Fl; Tut7+/Fl; R26ERTCre/+ and Tut4Fl/Fl; Tut7Fl/Fl; R26ERTCre/+ ESC lines before (TMX-) and after (TMX+) deletion of Tut4/7. Scale bar indicates 200 μm. i, Growth curve of Tut4+/Fl; Tut7+/Fl; R26ERTCre/+ and Tut4Fl/Fl; Tut7Fl/Fl; R26ERTCre/+ESC lines before (TMX-) and after (TMX+) deletion of Tut4/7. The growth of each line was measured in triplicates. The mean and s.d. of three independently-derived cell lines is shown. j, Alkaline phosphatase staining of untreated (TMX-) and tamoxifen treated (TMX+) Tut4+/Fl; Tut7+/Fl; R26ERTCre/+ and Tut4Fl/Fl; Tut7Fl/Fl; R26ERTCre/+ ESC lines. k, Relative expression of pluripotency markers in Tut4/7CTL and Tut4/7iKO ESC lines as determined by qRT-PCR from three biological replicates. The bars’ heights and vertical lines indicate the mean and range, respectively. The fold change is indicated. l, Representative images showing morphology of Tut4/7CTL and Tut4/7iKO embryoid bodies. Magnification, 20X. m, Representative images showing morphology of neural progenitors derived from of Tut4/7CTL and Tut4/7iKO ESCs. Scale bar indicates 100 μm. n, Relative expression as determined by qRT-PCR of endoderm and mesoderm markers in embryoid bodies derived from Tut4/7CTL and Tut4/7iKO ESCs. The mean from three biological replicates is shown. The bars’ heights and vertical lines indicate the mean and range, respectively. The fold change is indicated. o, Expression as determined by qRT-PCR presented as fold change of pluripotency and neural progenitor markers upon differentiation of Tut4/7CTL and Tut4/7iKO ECSs into neural progenitors. The fold change is indicated. The bars’ heights and vertical lines indicate the mean and range, respectively (t-test; *, p < 0.05). p, Frequency of Tut4/7CTL and Tut4/7iKO embryoid bodies with spontaneous contractile activity. The mean from three biological replicates is shown, each determined from 48 embryoid bodies. The fold change is indicated. The bars’ heights and vertical lines indicate the mean and range, respectively.
Extended Data Figure 9. 3′ mRNA terminal transcriptome cytidylation and guanylation are not affected upon Tut4/7 deletion.
a, b, Quantification of mRNA 3′ terminal cytidylation (a) and guanylation (b) of all transcripts (left panel), transcripts with short poly(A) tails (≤ 30 nucleotides) (center panel) and long poly(A) tails (> 30 nucleotides) (right panel) from Tut4/7CTL and Tut4/7cKO germinal vesicle (GV) oocytes or Tut4/7iKO liver, bone marrow (BM), mouse embryonic fibroblast (MEFs) and embryonic stem cell (ESCs) transcriptomes. The fold change in modification levels and the significance are indicated (t-test; *, p < 0.05). Data points represent replicates; the bars’ heights and vertical lines indicate the mean and range, respectively.
Extended Data Figure 10. Loss of TUT4/7 specifically reduces terminal miRNA uridylation levels and modestly impacts miRNA expression levels.
a, Quantification of the relative abundance of let-7 family members, the five most abundant miRNAs, and all other miRNAs in Tut4/7CTL and Tut4/7iKO liver, bone marrow (BM), mouse embryonic fibroblasts (MEFs) and embryonic stem cells (ESCs). The fold change in relative let-7 expression is depicted. b-e, Quantification of 3’ uridylation (b), adenylation (c), cytidylation (d), and guanylation (e) frequency of all miRNAs and let-7 family members in Tut4/7CTL and Tut4/7iKO cell lines and tissues. Modifications involving one or more than one nucleotide are distinguished. Data points represent replicates; the bars’ heights and vertical lines indicate the mean and range, respectively. The fold change in modification frequency between Tut4/7CTL and Tut4/7iKO as well as the significance are indicated (t-test; *, p < 0.05; **, p < 0.01; ***, p < 0.001).
Supplementary Material
Supplementary Information is available in the online version of the paper.
Acknowledgements
The research leading to these results has received funding from the Wellcome Trust (Award 106144). This study was technically supported by EMBL Monterotondo’s genome engineering and microscopy core facilities.
Footnotes
Author Contributions
M.M and C.M. contributed to the design, execution and analysis of most experiments. M.M. performed most of the molecular biology for library generation and much of the bioinformatics analyses. C.M. performed all inducible conditional genetics in somatic cells/tissues. M.D.G, C.A. and I.I. performed oocyte analysis and collection. D.M.V. performed the small RNA sequencing analysis. P.M. performed the in vitro embryo development experiments. J.P. and V.B. optimized gene expression analysis from oocytes. J.P., P.C. and V.B. optimized spike-ins and sequencing of TAIL-seq libraries. A.J.E. constructed the TAIL-seq pipeline to process the raw sequencing data and oversaw all bioinformatic analyses performed. D.O’C. conceived and supervised this study and wrote the final version of the manuscript.
Reprints and permissions information is available at www.nature.com/reprints. Readers are welcome to comment on the online version of the paper.
The authors declare no competing financial interests.
Data Availability Statement
All mRNA and miRNA expression data that support the findings of this study have been deposited at ArrayExpress under the accession number E-MTAB-5056 and E-MTAB-5677, respectively. The primary data and output of the TAIL-seq pipeline can be retrieved from http://www.ebi.ac.uk/research/enright/morgan-et-al-2017. The scripts used in the analysis of the TAIL-seq output can be found at https://github.com/marcosmorgan/TAIL-seq. The Tut4 and Tut7 alleles will be freely available on a non-collaborative basis. All the other data generated or analysed during this study are included in the article and Supplementary Information.
References
- 1.Tadros W, Lipshitz HD. The maternal-to-zygotic transition: a play in two acts. Development. 2009;136:3033–3042. doi: 10.1242/dev.033183. [DOI] [PubMed] [Google Scholar]
- 2.Svoboda P, Franke V, Schultz RM. Current Topics in Developmental Biology. Vol. 113. Elsevier Inc; 2015. Sculpting the Transcriptome During the Oocyte-to-Embryo Transition in Mouse. [DOI] [PubMed] [Google Scholar]
- 3.Eppig JJ, Schroeder aC. Capacity of mouse oocytes from preantral follicles to undergo embryogenesis and development to live young after growth, maturation, and fertilization in vitro. Biol Reprod. 1989;41:268–276. doi: 10.1095/biolreprod41.2.268. [DOI] [PubMed] [Google Scholar]
- 4.Pan H, O’brien MJ, Wigglesworth K, Eppig JJ, Schultz RM. Transcript profiling during mouse oocyte development and the effect of gonadotropin priming and development in vitro. Dev Biol. 2005;286:493–506. doi: 10.1016/j.ydbio.2005.08.023. [DOI] [PubMed] [Google Scholar]
- 5.Ma J-Y, et al. Maternal factors required for oocyte developmental competence in mice: Transcriptome analysis of non-surrounded nucleolus (NSN) and surrounded nucleolus (SN) oocytes. Cell Cycle. 2013;12:1928–1938. doi: 10.4161/cc.24991. [DOI] [PMC free article] [PubMed] [Google Scholar]
- 6.Brower PT, Gizang E, Boreen SM, Schultz RM. Biochemical studies of mammalian oogenesis: Synthesis and stability of various classes of RNA during growth of the mouse oocyte in vitro. Dev Biol. 1981;86:373–383. doi: 10.1016/0012-1606(81)90195-0. [DOI] [PubMed] [Google Scholar]
- 7.De Leon V, Johnson A, Bachvarova R. Half-lives and relative amounts of stored and polysomal ribosomes and poly(A)+ RNA in mouse oocytes. Dev Biol. 1983;98:400–408. doi: 10.1016/0012-1606(83)90369-x. [DOI] [PubMed] [Google Scholar]
- 8.Rissland OS, Norbury CJ. Decapping is preceded by 3’ uridylation in a novel pathway of bulk mRNA turnover. Nat Struct Mol Biol. 2009;16:616–23. doi: 10.1038/nsmb.1601. [DOI] [PMC free article] [PubMed] [Google Scholar]
- 9.Lim J, et al. Uridylation by TUT4 and TUT7 Marks mRNA for Degradation. Cell. 2014;159:1365–1376. doi: 10.1016/j.cell.2014.10.055. [DOI] [PMC free article] [PubMed] [Google Scholar]
- 10.Mullen TE, Marzluff WF. Degradation of histone mRNA requires oligouridylation followed by decapping and simultaneous degradation of the mRNA both 5′ to 3′ and 3′ to 5′. Genes Dev. 2008;22:50–65. doi: 10.1101/gad.1622708. [DOI] [PMC free article] [PubMed] [Google Scholar]
- 11.Chang H, Lim J, Ha M, Kim VN. TAIL-seq: Genome-wide Determination of Poly(A) Tail Length and 3’ End Modifications. Mol Cell. 2014;53:1044–1052. doi: 10.1016/j.molcel.2014.02.007. [DOI] [PubMed] [Google Scholar]
- 12.Baer BW, Kornberg RD. The protein responsible for the repeating structure of cytoplasmic poly(A)-ribonucleoprotein. J Cell Biol. 1983;96:717–721. doi: 10.1083/jcb.96.3.717. [DOI] [PMC free article] [PubMed] [Google Scholar]
- 13.Eliseeva IA, Lyabin DN, Ovchinnikov LP. Poly ( A ) Binding Proteins : Structure, Domain Organization, and Activity Regulation. 2013;78 doi: 10.1134/S0006297913130014. [DOI] [PubMed] [Google Scholar]
- 14.Chowdhury A, Mukhopadhyay J, Tharun S. The decapping activator Lsm1p-7p-Pat1p complex has the intrinsic ability to distinguish between oligoadenylated and polyadenylated RNAs. RNA. 2007;13:998–1016. doi: 10.1261/rna.502507. [DOI] [PMC free article] [PubMed] [Google Scholar]
- 15.Song M-G, Kiledjian M. 3’ Terminal oligo U-tract-mediated stimulation of decapping. RNA. 2007;13:2356–65. doi: 10.1261/rna.765807. [DOI] [PMC free article] [PubMed] [Google Scholar]
- 16.de Vries WN, et al. Expression of Cre recombinase in mouse oocytes: a means to study maternal effect genes. Genesis. 2000;26:110–2. [PubMed] [Google Scholar]
- 17.Jones MR, et al. Zcchc11-dependent uridylation of microRNA directs cytokine expression. Nat Cell Biol. 2009;11:1157–1163. doi: 10.1038/ncb1931. [DOI] [PMC free article] [PubMed] [Google Scholar]
- 18.Hagan JP, Piskounova E, Gregory RI. Lin28 recruits the TUTase Zcchc11 to inhibit let-7 maturation in mouse embryonic stem cells. Nat Struct Mol Biol. 2009;16:1021–1025. doi: 10.1038/nsmb.1676. [DOI] [PMC free article] [PubMed] [Google Scholar]
- 19.Freeman TC, et al. Construction, visualisation, and clustering of transcription networks from microarray expression data. PLoS Comput Biol. 2007;3:2032–2042. doi: 10.1371/journal.pcbi.0030206. [DOI] [PMC free article] [PubMed] [Google Scholar]
- 20.Suh N, et al. Report MicroRNA Function Is Globally Suppressed in Mouse Oocytes and Early Embryos. Curr Biol. 2010;20:271–277. doi: 10.1016/j.cub.2009.12.044. [DOI] [PMC free article] [PubMed] [Google Scholar]
- 21.Ma J, et al. Report MicroRNA Activity Is Suppressed in Mouse Oocytes. Curr Biol. 2010;20:265–270. doi: 10.1016/j.cub.2009.12.042. [DOI] [PMC free article] [PubMed] [Google Scholar]
- 22.Heo I, et al. Lin28 Mediates the Terminal Uridylation of let-7 Precursor MicroRNA. Mol Cell. 2008;32:276–284. doi: 10.1016/j.molcel.2008.09.014. [DOI] [PubMed] [Google Scholar]
- 23.Heo I, et al. Mono-uridylation of pre-microRNA as a key step in the biogenesis of group II let-7 microRNAs. Cell. 2012;151:521–532. doi: 10.1016/j.cell.2012.09.022. [DOI] [PubMed] [Google Scholar]
- 24.Medvedev S, Yang J, Hecht NB, Schultz RM. CDC2A (CDK1)-mediated phosphorylation of MSY2 triggers maternal mRNA degradation during mouse oocyte maturation. Dev Biol. 2008;321:205–215. doi: 10.1016/j.ydbio.2008.06.016. [DOI] [PMC free article] [PubMed] [Google Scholar]
- 25.Ma J, Flemr M, Strnad H, Svoboda P, Schultz RM. Maternally Recruited DCP1A and DCP2 Contribute to Messenger RNA Degradation During Oocyte Maturation and Genome Activation in Mouse. Biol Reprod. 2013;88:11–11. doi: 10.1095/biolreprod.112.105312. [DOI] [PMC free article] [PubMed] [Google Scholar]
- 26.Ma J, Fukuda Y, Schultz RM. Mobilization of Dormant Cnot7 mRNA Promotes Deadenylation of Maternal Transcripts During Mouse Oocyte Maturation. Biol Reprod. 2015;93:48–48. doi: 10.1095/biolreprod.115.130344. [DOI] [PMC free article] [PubMed] [Google Scholar]
- 27.Huarte J, Belin D, Vassalli A, Strickland S, Vassalli JD. Meiotic maturation of mouse oocytes triggers the translation and polyadenylation of dormant tissue-type plasminogen activator mRNA. Genes Dev. 1987;1:1201–1211. doi: 10.1101/gad.1.10.1201. [DOI] [PubMed] [Google Scholar]
- 28.Subtelny AO, Eichhorn SW, Chen GR, Sive H, Bartel DP. Poly(A)-tail profiling reveals an embryonic switch in translational control. Nature. 2014;508:66–71. doi: 10.1038/nature13007. [DOI] [PMC free article] [PubMed] [Google Scholar]
- 29.Lim J, Lee M, Son A, Chang H, Kim VN. mTAIL-seq reveals dynamic poly ( A ) tail regulation in oocyte-to-embryo development. Genes Dev. 2016;30:1–12. doi: 10.1101/gad.284802.116. [DOI] [PMC free article] [PubMed] [Google Scholar]
- 30.Eichhorn SW, et al. mRNA Poly(A)-tail Changes Specified by Deadenylation Broadly Reshape Translation in Drosophila Oocytes and Early Embryos. Elife. 2016;5 doi: 10.7554/eLife.16955. [DOI] [PMC free article] [PubMed] [Google Scholar]
- 31.De Fazio S, et al. The endonuclease activity of Mili fuels piRNA amplification that silences LINE1 elements. Nature. 2011;480:259–263. doi: 10.1038/nature10547. [DOI] [PubMed] [Google Scholar]
- 32.Schwenk F, Baron U, Rajewsky K. A cre-transgenic mouse strain for the ubiquitous deletion of loxP-flanked gene segments including deletion in germ cells. Nucleic Acids Res. 1995;23:5080–5081. doi: 10.1093/nar/23.24.5080. [DOI] [PMC free article] [PubMed] [Google Scholar]
- 33.Henrich VC, et al. Widespread recombinase expression using FLPeR (flipper) mice. Genesis. 2000;28:106–110. [PubMed] [Google Scholar]
- 34.Badea TC, Wang Y, Nathans J. A noninvasive genetic/pharmacologic strategy for visualizing cell morphology and clonal relationships in the mouse. J Neurosci. 2003;23:2314–22. doi: 10.1523/JNEUROSCI.23-06-02314.2003. [DOI] [PMC free article] [PubMed] [Google Scholar]
- 35.Comazzetto S, et al. Oligoasthenoteratozoospermia and Infertility in Mice Deficient for miR-34b/c and miR-449 Loci. PLoS Genet. 2014;10:e1004597. doi: 10.1371/journal.pgen.1004597. [DOI] [PMC free article] [PubMed] [Google Scholar]
- 36.Livak KJ, Schmittgen TD. Analysis of relative gene expression data using real-time quantitative PCR and the 2^-ΔΔCT Method. Methods. 2001;25:402–408. doi: 10.1006/meth.2001.1262. [DOI] [PubMed] [Google Scholar]
- 37.Ritchie ME, et al. Limma powers differential expression analyses for RNA-sequencing and microarray studies. Nucleic Acids Res. 2015;43:e47. doi: 10.1093/nar/gkv007. [DOI] [PMC free article] [PubMed] [Google Scholar]
- 38.Bryja V, et al. An efficient method for the derivation of mouse embryonic stem cells. Stem Cells. 2006;24:844–849. doi: 10.1634/stemcells.2005-0444. [DOI] [PubMed] [Google Scholar]
- 39.Keller GM. In vitro differentiation of embryonic stem cells. Curr Opin Cell Biol. 1995;7:862–869. doi: 10.1016/0955-0674(95)80071-9. [DOI] [PubMed] [Google Scholar]
- 40.Kozomara A, Griffiths-Jones S. MiRBase: Annotating high confidence microRNAs using deep sequencing data. Nucleic Acids Res. 2014;42:68–73. doi: 10.1093/nar/gkt1181. [DOI] [PMC free article] [PubMed] [Google Scholar]
- 41.Vitsios DM, Enright AJ. Chimira: analysis of small RNA sequencing data and microRNA modifications. Bioinformatics. 2015;31:3365–3367. doi: 10.1093/bioinformatics/btv380. Fig. 1. [DOI] [PMC free article] [PubMed] [Google Scholar]
- 42.Love MI, Huber W, Anders S. Moderated estimation of fold change and dispersion for RNA-seq data with DESeq2. Genome Biol. 2014;15:550. doi: 10.1186/s13059-014-0550-8. [DOI] [PMC free article] [PubMed] [Google Scholar]
Associated Data
This section collects any data citations, data availability statements, or supplementary materials included in this article.


