Abstract
We compared acinar perfusion in isolated rat lungs ventilated using positive or negative pressures. The lungs were ventilated with air at transpulmomary pressures of 15/5 cm H2O, at 25 breaths/min, and perfused with a hetastarch solution at Ppulm art/PLA pressures of 10/0 cm H2O. We evaluated overall perfusability from perfusate flows, and from the venous concentrations of 4-µm diameter fluorescent latex particles infused into the pulmonary circulation during perfusion. We measured perfusion distribution from the trapping patterns of those particles within the lung. We infused approximately 9 million red fluorescent particles into each lung, followed 20 min later by an infusion of an equal number of green particles. In positive pressure lungs, 94.7 ± 2.4% of the infused particles remained trapped within the lungs, compared to 86.8 ± 5.6% in negative pressure lungs (P ≤ 0.05). Perfusate flows averaged 2.5 ± 0.1 mL/min in lungs ventilated with positive pressures, compared to 5.6 ± 01 mL/min in lungs ventilated with negative pressures (P ≤ 0.05). Particle infusions had little effect on perfusate flows. In confocal images of dried sections of each lung, red and green particles were co-localized in clusters in positive pressure lungs, suggesting that acinar vessels that lacked particles were collapsed by these pressures thereby preventing perfusion through them. Particles were more broadly and uniformly distributed in negative pressure lungs, suggesting that perfusion in these lungs was also more uniformly distributed. Our results suggest that the acinar circulation is organized as a web, and further suggest that portions of this web are collapsed by positive pressure ventilation.
Keywords: pulmonary circulation, pulmonary microcirculation, pulmonary acinus, alveolar capillary, sheet flow
Our goal in these studies was to understand how acinar perfusion compared between lungs ventilated by positive pressures and those ventilated by negative pressures. Alveoli receive their perfusion from the acinar vessels, and the close proximity of these vessels to the alveoli suggests that their caliber may be affected by the relationship between lung inflation pressures and vascular perfusion pressures. Positive pressure ventilation, where the lung is inflated by raising pressures within it to values greater than atmospheric pressure, might compress the acinar vessels and thereby reduce overall lung perfusion. Negative pressure ventilation, where the lung is inflated by lowering the pressure outside of it to subatmospheric values, is the method by which the lung is normally ventilated within the thorax. This might dilate the acinar vessels, and produce greater and more uniform lung perfusion than positive pressure ventilation, which might narrow acinar vessels. The goals of our studies were to investigate these possibilities.
These ideas are important for several reasons: hospitalized patients are usually ventilated by positive pressures, which, depending on the pressures used relative to pulmonary artery pressures (PAPs), could have a deleterious effect on lung perfusion if the inflation pressures compressed the acinar vessels. In non-pathological conditions, intrapleural pressures are more deeply subatmospheric in hyperpnea than in tidal breathing. This occurs in conditions such as exercise and hypoxia. Furthermore, intrapleural pressures can reach deeply negative values in conditions such as sleep apnea. Thus, learning how acinar perfusion varies between positive and negative pressure ventilation has important implications for our overall understanding of how the pulmonary circulation functions in both health and disease.
Our method was to infuse 4-µm diameter fluorescent latex particles into isolated, perfused lungs. We infused red particles first, followed by an equal number of green particles. We compared the concentrations of particles of both colors that flowed through the lungs between the two ventilation methods (positive or negative). We also used confocal microscopy to compare trapping patterns of particles of both colors within the lungs.
Methods
We isolated lungs from retired, male, breeder Sprague-Dawley rats (450–550 g), which we chose because of their relatively large size. We anesthetized the rats using isoflurane and sacrificed them by exsanguination following heparin infusion (750 U/kg).
Lung preparation
We opened the chest, cannulated the trachea, pulmonary artery, and left atrium using polyethylene tubing (PE 200), removed the heart and lungs en bloc, and placed them dorsal side down into an open Plexiglas chamber where they were warmed by an incandescent lamp that produced lung surface temperatures of 33 ± 2℃. The trachea, pulmonary artery, and left atrial cannulas were fitted to connectors in the walls of the chamber. Lungs ventilated by positive pressures were ventilated with air (25 breaths/min) at inflation and deflation pressures of 15 and 5 cm H2O (n = 6). To ventilate lungs with negative pressures, we sealed the chamber and cycled pressures within it from −5 to −15 cm H2O (25 breaths/min; n = 6). We perfused the lungs via the pulmonary artery using a buffered hetastarch solution (1.5% Hespan in PBS; B. Braun Medical, Inc.). The solution was pumped into a reservoir that supplied the pulmonary arterial catheter. The reservoir was equipped with an overflow in which the meniscus at the overflow outlet was set 10 cm above the bottom (dorsal side) of the lung. This therefore provided a PAP of 10 cm H2O. Perfusate was pumped from a beaker into the reservoir, and perfusate that did not enter the lung returned to the beaker via the overflow. The venous cannula was set level with the dorsal (bottom) side of the lung (Pven = 0 cm H2O).
Drops falling from the venous cannula interrupted the light beam of a drop counter that recorded the perfusate flow rate. The drops were collected in tubes using an automated sample collector that placed a new tube beneath the drop counter every 30 s.
Particle infusion
When perfusate flows were stable, after approximately 20 min, we infused 8.5 × 10⁶ 4-µm diameter, red fluorescent latex particles (Bangs Laboratories, Fishers, IN, USA), suspended in 1.5 mL of perfusion solution, into the pulmonary arterial catheter over a period of 2 min. Twenty minutes after the start of red particle infusion, we infused an equal number of 4-µm green fluorescent latex particles. We waited 20 min between particle infusions to ensure that the red particle trapping within the lung had become stable. We added 0.5% albumin to the particle solutions before infusion to coat the particles and neutralize their surface charge. This prevented them from clumping in the presence of the saline ions in the perfusate buffer.1 PAPs remained constant during particle infusion because the lungs were perfused from an overflow-equipped reservoir.
We used a flow cytometer (MACSQuant Analyzer 10, Miltenyl Biotec, Cologne, Germany) to count the numbers of particles of each color in each of the venous effluent samples collected from each lung. We also sampled the infusion solutions to verify the numbers of particles infused. We expressed the venous particle counts as a percentage of the total number of particles of each color infused.
When the particle collections were complete (32 min after the start of red particle infusion), we clamped the arterial and venous cannulas, inflated the lungs to 20 cm H2O using compressed air, and maintained the lungs at this pressure for two days to allow them to desiccate. We then sliced a sagittal section from the left or right hilum of each dried lung, and placed it onto the stage of a confocal microscope (Nikon A1R, Nikon Metrology, Brighton, MI, USA) where we obtained digital images (2.1 × 2.1 mm; 512 × 512 pixels; four per section) of the trapping patterns of the fluorescent particles within each lung. Red and green particles were imaged separately.
Particle trapping pattern analysis
We used statistical methods to quantify particle trapping patterns within each digital confocal image.1 We began by using public domain software (ImageJ, National Institutes of Health) to obtain the x-y address of pixels within each image for particles of each color. We used this information to obtain the total number of pixels of each color within each image, which we expressed as fraction of the total number of pixels available within each 512 × 512 pixel image (262,144 total pixels). This was a measure of the fraction of each image occupied by latex particles. We also recorded the number of pixels per pixel cluster. A cluster could consist of a single particle or a group of particles. A single particle occupied 4.3 pixels.
We used the Pearson correlation coefficient to obtain the degree to which red and green particles occupied the same x-y address.2 This was a measure of red–green particle co-localization within each image.
We prepared four additional lungs to examine microvascular particle trapping at higher magnifications than was possible in the dried lungs describe above. Two lungs were ventilated using positive pressures and two were ventilated using negative pressures. These additional lungs were ventilated and perfused like those described above, except at the end of the second particle infusion, the lungs were rapidly frozen using liquid nitrogen. We dissected eight to ten 5-mm blocks from each lung under liquid nitrogen and placed these into vials containing chilled (–70℃) ethanol. We stored the blocks in a −70℃ freezer for three to five days to allow the ethanol to replace the water within the tissue. We warmed the ethanol-saturated tissue to 4℃, and then replaced the ethanol with unpolymerized embedding resin (JB-4; Sigma-Aldrich, St. Louis, MO, USA). We then embedded the blocks in polymerized resin and sectioned them using glass knives. We examined the blocks using transmitted light on our confocal microscope. We were able to visualize particles within microvessels using these methods. The particles did not fluoresce because their fluorescent dyes were dissolved by the solutions used to embed the tissue.
We were surprised to find that some particles appeared to be partially present within the alveolar septa of these lungs. We therefore perfused and froze one additional lung into which we infused 3-µm particles while it was ventilated using positive pressures. We compared images from this lung with those above to learn how particle diameter affected the ability of these particles to enter alveolar septa.
Statistical methods
Results are expressed as mean ± s.d. A total of six air-dried lungs were prepared for each ventilation method (positive versus negative pressure). Statistical comparisons were conducted using one-way analysis of variance, and Fisher’s Least Significant Difference post hoc test to determine if differences were significant. Differences were considered to be significant at P ≤ 0.05.
Results
Perfusate flows
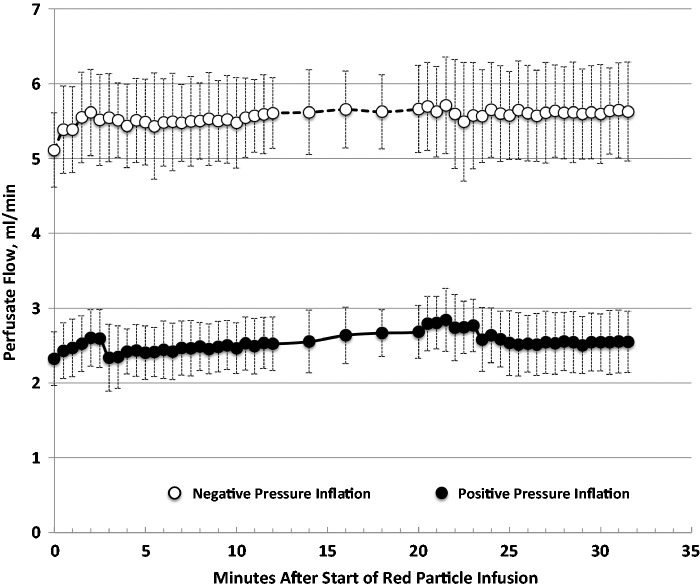
Perfusate flows (Fig. 1) averaged 5.6 ± 0.1 mL/min for lungs ventilated with negative pressure, and 2.5 ± 0.1 mL/min for lungs ventilated with positive pressure (P ≤ 0.05). Flows increased insignificantly during red (first) particle infusion in lungs ventilated with both methods. Green (second) particle infusions had insignificant effects on flows.
Fig. 1.
Perfusate flows (mean ± s.d.) in lungs ventilated with negative pressures (open symbols) or by positive pressures (closed symbols). Red particle infusion began at minute zero. Green particle infusion began at minute 20. Venous flow samples were collected every 30 s, except between minutes 12 and 20, when they were collected every 2 min.
Venous particle concentrations
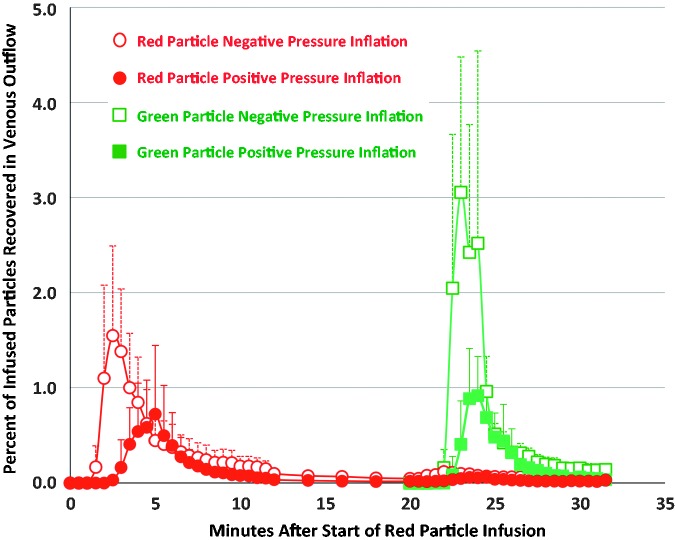
Data on venous particle concentrations are shown in Table 1 and Fig. 2. The total numbers of red and green particles recovered in lungs ventilated with negative pressures were more than twice as great as those in lungs ventilated with positive pressures (Table 1). These values correspond to the areas under the curves in Fig. 2 for particles of each color and ventilation method. Within lungs ventilated with each method, the total concentration of red particles recovered was not significantly different from the total number of green particles recovered. However, in lungs ventilated with negative pressures, the highest green particle concentration measured in a single sample (4.3 ± 1.0%) was significantly greater than the highest red particle concentration measured in a single sample (1.8 ± 0.5%) (Table 1). In lungs ventilated with negative pressure, the highest red particle concentration occurred at 2.8 ± 0.6 min after the start of red particle infusion, which was significantly sooner than the time when the highest red particle concentration occurred in lungs ventilated with positive pressure (4.3 ± 0.7 min.) (Table 1). Appearance times for the highest concentration green particles did not differ between the two ventilation methods.
Table 1.
Particle recovery in venous outflow.
| 4-µm particle color, and ventilation pressure | Total particles recovered (% of infused) | Highest concentration recovered in one venous sample (% of infused) | Time at highest concentration recovered (min)* |
|---|---|---|---|
| Red, negative pressure | 12.1 ± 5.9† | 1.8 ± 0.5†‡ | 2.8 ± 0.6† |
| Red, positive pressure | 5.4 ± 3.8 | 0.9 ± 0.7 | 4.3 ± 0.7 |
| Green, negative pressure | 14.5 ± 3.3§ | 4.3 ± 1.0§ | 23.4 ± 0.7 |
| Green, positive pressure | 5.2 ± 2.8 | 1.0 ± 0.5 | 23.8 ± 0.7 |
Values are presented as mean ± s.d.
Minutes after start of red particle infusion (time = zero); green particle infusion was started at minute 20.
Significantly different from red positive pressure ventilation (P ≤ 0.05).
Significantly different from green negative pressure ventilation (P ≤ 0.05).
Significantly different from green positive pressure ventilation (P ≤ 0.05).
Fig. 2.
Red and green particle concentrations (percent of particles infused; mean ± s.d.) within lung venous outflow samples of lungs ventilated with negative pressures (open symbols) and positive pressures (closed symbols). Red particles were infused over 2 min beginning at minute 0. Green particles were infused over 2 min beginning at minute 20. Venous samples were collected at 30-s intervals, except between minutes 12 and 20, when samples were collected at 2-min intervals.
Particle trapping patterns
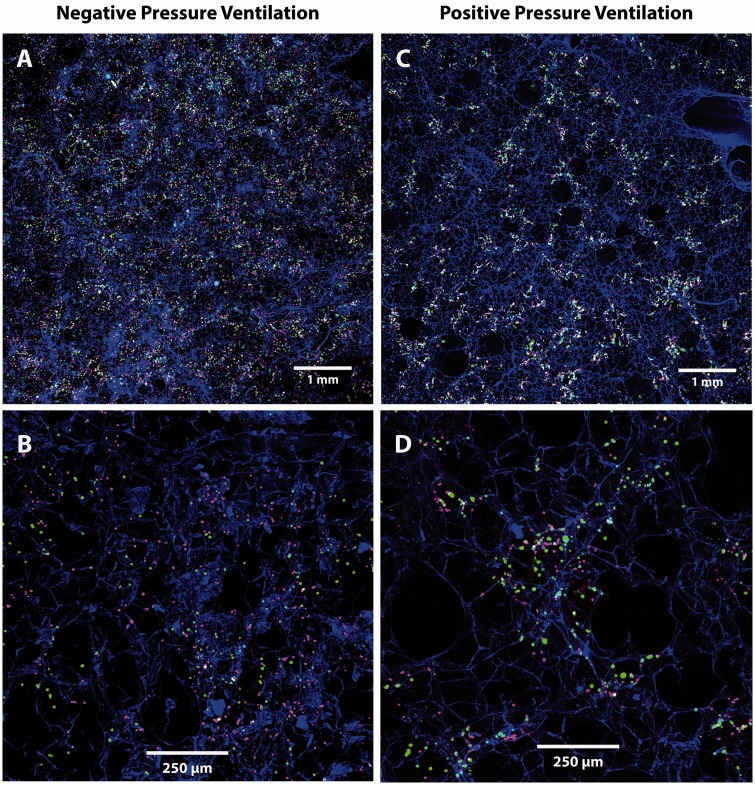
Examples of images from which particle trapping measurements were made are shown in Fig. 3. The particle trapping pattern data are shown in Table 2. The percent of each confocal image area occupied by latex particle pixels ranged from 3.95% for green particles in lungs inflated with negative pressures to 4.95% for red particles in lungs ventilated with positive pressures. These percentages were not significantly different for particles of either color or either ventilation method. This means that, on average, the images contained the same number of latex particles regardless of particle color or ventilation method.
Fig. 3.
Trapping patterns of red (infused first) and green (infused second) 4-µm particles in lungs ventilated with negative (a, b) or positive (c, d) pressures. Particles in lungs ventilated using negative pressures are more uniformly distributed and less clustered than those in lungs ventilated using positive pressures (Table 2). Lung tissue appears blue.
Table 2.
Red and green latex particle pixel counts in confocal images of lungs ventilated with negative and positive pressures.
| Ventilation pressure and particle color | Each confocal image area occupied by latex particle pixels (%) | Pixel clumps per confocal image (n) | Pixels in each pixel clump (n)* | Pearson red-green pixel co-localization coefficient |
|---|---|---|---|---|
| Negative pressure, green particles | 3.95 ± 1.26 | 2174 ± 597† | 4.77 ± 1.07† | Negative pressure ventilation |
| Negative pressure, red particles | 4.10 ± 0.95 | 2523 ± 682‡ | 4.22 ± 1.17‡ | 0.20 ± 0.03§ |
| Positive pressure, green particles | 4.88 ± 1.92 | 1222 ± 369 | 10.32 ± 2.93 | Positive pressure ventilation |
| Positive pressure, red particles | 4.95 ± 2.32 | 1435 ± 179 | 8.79 ± 3.90 | 0.40 ± 0.05 |
Values are presented as mean ± s.d.
4.3 pixels per latex particle.
Signficantly different from positive pressure green.
Signficantly different from positive pressure red.
Significantly different from positive pressure ventilation.
The number of pixel clumps in each image was significantly higher for particles of both colors in lungs ventilated with negative pressures compared to lungs ventilated with positive pressures. Conversely, the number of pixels within each clump, which is a measure of particle clustering, was significantly lower for particles of both colors in lungs ventilated with negative pressures compared to lungs ventilated with positive pressures. Together, these two findings demonstrate that the particles were more likely to be present as individual particles in negative pressure lungs, but were more likely to be present in particle clusters in positive pressure lungs.
Co-localization of red and green pixels within each image was significantly less in lungs ventilated with negative pressures compared to lungs ventilated with positive pressures (Table 2).
In lungs ventilated using positive pressure, we found that trapped particles of both colors were clustered in islands (Fig. 3c and d). These islands had an average cross-sectional area of 0.15 ± 0.02 mm2, and the average distance between these islands was 0.66 ± 0.20 mm.
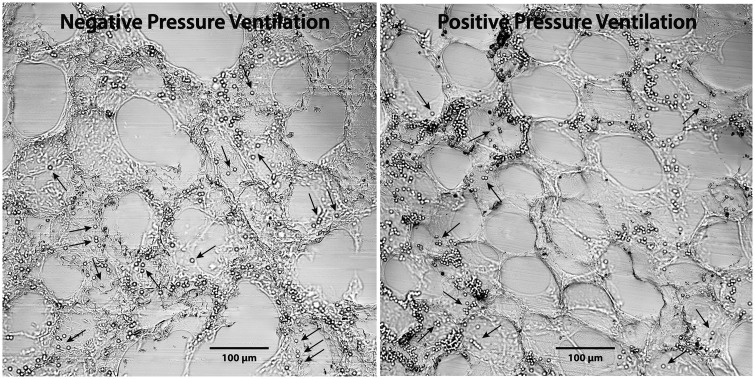
Images of particles in lungs rapidly frozen after 4-µm particle infusion are shown in Fig. 4. The vast majority of the particles were trapped within the acinar vessels that surround the alveoli. However, a few individual particles appeared to be present within alveolar septa. Particles within septa appeared more frequently in lungs ventilated using negative pressures than in those ventilated using positive pressures. Images of the lung perfused with 3-µm particles during positive pressure ventilation are shown in Fig. 5. These particles were present within alveolar septa in greater numbers than were 4-µm particles in lungs inflated by positive pressures.
Fig. 4.
Trapping patterns of 4-µm diameter latex particles infused into isolated rat lungs perfused during negative (left) and positive (right) pressure ventilation, then rapidly frozen. Most of these particles are trapped within acinar vessels, as would be expected,5–7,15 but a few (arrows) also appear to be present within peripheral portions of alveolar septa. Compare with particle trapping patterns in Figs. 3, and with 3-µm diameter particle trapping patterns in Fig. 5. These particles do not fluoresce due to loss of their dyes during tissue preparation.
Fig. 5.
Trapping patterns of 3-µm diameter latex particles (arrows) infused into an isolated rat lung perfused during positive pressure ventilation, then rapidly frozen. Compare with the trapping patterns of 4-µm particles in Fig. 4. The 3-µm particles are present within alveolar septa, unlike the 4-µm particles which were barely able to enter them. Also note the complete absence of 3-µm particles from the acinar vessels surrounding the alveoli. This suggests that these particles were able to flow freely through the acinar vessels under these conditions.
Discussion
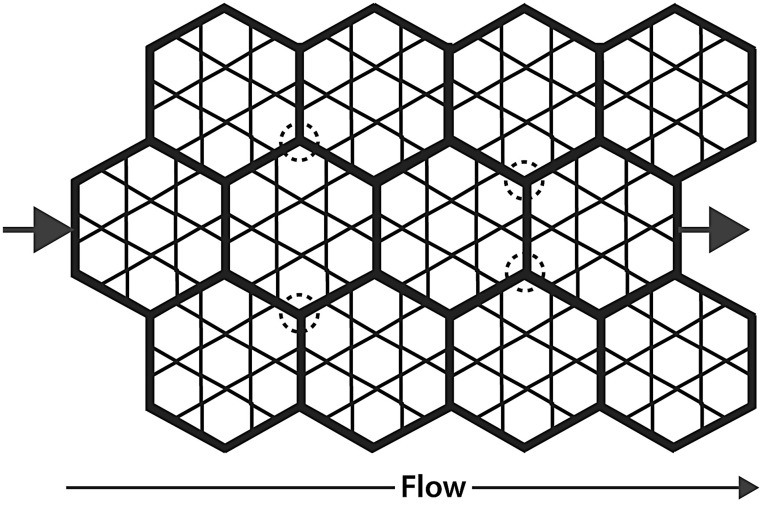
Our results suggest that the acinar circulation is a well-developed, parallel perfusion network that surrounds the alveoli. A diagram of such an arrangement is shown in Fig. 6. Our results support this idea, as follows.
Two infusions of 8.5 × 10⁶ 4-µm particles into each lung had negligible effect on perfusate flows (Fig. 1). Infusion of so many particles into a circulation arranged in series would have been expected to partially obstruct the circulation and cause flow to decline. Only a circulation arranged in parallel would be expected to absorb so many particles without a flow reduction.
Significant numbers of the infused particles flowed through the lungs from artery to vein (Fig. 2). If the circulation were arranged in series, the particles would have become trapped within the alveoli, restricting their entry into the venous outflow.
Trapping patterns of the particles within acinar vessels (Figs. 3 and 4) supports the idea that these vessels were the main pathway of the particles through the circulation. These particles would have been unlikely to enter the venous circulation in such large numbers so quickly unless a bypass route around the alveoli was available to them.
Fig. 6.
Parallel perfusion model of acinar circulation among the alveoli. We hypothesize that the acinar vessels (bold) form a network throughout which perfusion flows among alveoli during flow from arteriole (left arrow) to venule (right arrow). Positive pressure ventilation narrows these vessels, while negative pressure ventilation dilates them. The 4-µm diameter latex particles we infused were confined mainly to these vessels (Fig. 4). Circled areas show examples of network regions that may be less susceptible to compression during positive pressure ventilation, which might be the areas in which particles became trapped in lungs ventilated with positive pressures (Fig. 3c and d).
Our results also suggest that the acinar circulation is compressed by positive pressure ventilation, as follows.
Perfusate flows through lungs ventilated with positive pressures were less than one-half that of flows through lungs ventilated with negative pressures (Fig. 1). Compression of the acinar and septal vessels by positive pressure ventilation would be expected to produce this result.
Particle flows through lungs ventilated with positive pressures were significantly less than those in lungs ventilated with negative pressures for particles of both colors (Fig. 2, Table 1). This would be an expected consequence of acinar vessel compression during positive pressure ventilation since the 4-µm diameter particles are largely excluded from septal capillaries. We will return to this point below.
Trapping patterns of particles of both colors in lungs ventilated with positive pressures were more clustered than in lungs ventilated with negative pressures (Fig. 3, Table 2). Compression of the acinar vessels by positive pressures would have been expected to produce this result.
Appearances of the 4-µm particles in rapidly frozen lungs (Fig. 4) show that these particles became trapped mostly within the acinar vessels that surround the alveoli. This suggests that the acinar vessels were the route taken by the particles through the pulmonary microcirculation into the venous outflow. We were surprised to find that some particles were present within alveolar septa. This adds further support to the idea that the acinar circulation is a parallel perfusion pathway that supplies perfusion to the alveoli. The smaller 3-µm diameter particles (Fig. 5) were present within septa in higher numbers than were 4-µm particles, which also supports this idea. The 3-µm particles were absent from acinar vessels, suggesting that those particles were able to flow through the acinar parallel perfusion pathway with little restriction in this lung ventilated using positive pressures.
The presence of 4-µm particles mainly within acinar vessels (Fig. 4) provides insight into the patterns of particle trapping within the fluorescence images (Fig. 3). Negative pressure ventilation appears to have allowed more acinar vessels to become accessible to 4-µm particles of both colors. This is shown by the more uniform distribution of particles within the lungs ventilated with negative pressures (Table 2, Fig. 3), by the higher flows through lungs ventilated with negative pressures (Table 1), and by the higher concentrations of infused particles that appeared in the venous outflow (Fig. 2, Table 1). It is also shown by the more rapid appearance of particles within the samples obtained from lungs ventilated with negative pressures (Table 1, Figure 2). Together, these observations suggest that negative pressure ventilation expanded the acinar circulation more than did positive pressure ventilation, thereby allowing not only greater flow through these vessels but also broader perfusion distribution.
The total number of pixels for particles of each color was not significantly different between confocal images from lungs ventilated with either method, which meant that the total number of particles in the fluorescence images was not different between the two methods (Table 2). However, the distribution of the pixels within the images was different. There were more pixel clusters in lungs ventilated with negative pressures, and the number of pixels within these clusters was smaller in lungs ventilated with negative pressures, meaning that pixel clusters in negative inflation lungs consisted of fewer particles than those in positive inflation lungs. Together, these data demonstrate that the particles were less clumped and more widely dispersed in lungs ventilated with negative pressures (Fig. 3). This conclusion is also supported by the co-localization coefficients (Table 2), a measure of particle clumping, which showed twofold greater co-localization in lungs ventilated with positive pressures. These data are also supported by the appearances of the particles within the images (Fig. 3), where the particles are less uniformly distributed in lungs ventilated with positive pressures.
The differences in particle trapping patterns provide an explanation for why flow was less in lungs ventilated with positive pressure. Areas that lacked particles in positive pressure lungs (Fig. 3) were areas where positive pressure apparently collapsed the vessels and prevented particle entry into them. If these areas did not receive flow, it would explain why flow through positive pressure lungs was lower. It is not known why these vessels are more collapsible than those that did contain particles, but our results show the existence of such a vessel population for the first time. Negative pressure ventilation, by comparison, produced much more uniform particle distributions. This provides an explanation for why perfusion through those lungs was greater than for lungs perfused by positive pressures: if more acinar vessels were accessible in negative pressure ventilation, as shown by the uniform particle distribution, then flows would be expected to be greater through these lungs than through those in which some of those vessels were compressed (positive pressure ventilation). Our findings provide documentation for the first time of differences in acinar vessel perfusion between positive and negative pressure ventilation. We speculate that acinar vessel interconnections (Fig. 6, circled areas) may be the less compressible portions in which we found the trapped particles to be present.
Our findings have important implications for the use of positive pressure ventilation in hospitalized patients: pulmonary vascular perfusion in positive-pressure ventilated patients may not only be lower, but also may be less uniform than in healthy patients breathing spontaneously.
It could be argued that 4-µm particles should easily flow through alveolar septal capillaries, which in rats have an estimated diameter of 5–6 µm.3 However, these rigid particles do not deform within capillaries as do red blood cells. We believe the 4-µm particles became trapped mainly within the vessels that supply the alveolar septal capillaries, not within the septal capillaries themselves, and images from our frozen lungs (Fig. 4) support this. The general presence of these particles within acinar vessels can also be seen in Fig. 3b and d. Our conclusion that these particles are largely excluded from alveolar septa is also supported by results of our previous studies in which we showed that 4-µm particles did not enter septal capillaries in isolated rat lungs perfused using positive pressure inflation in zone 1, nor did red cells.4,5 We also showed that 4-µm particles entered only 9% of septa in unventilated lungs perfused at the zone I–II border, and entered only 25% of septa perfused in lungs perfused in zone II (Pinfl. 25, Ppulm art. 30 cm H2O).6,7 Based on our present and previous results, we conclude that the majority of the 4-µm particles in our present studies were trapped within acinar vessels. Previous authors have referred to these as corner vessels while others label them acinar vessels.8,9 We prefer the latter term.
Our parallel perfusion model (Fig. 6) supports the findings of earlier investigators who suggested that the so-called “middle segment” vessels, that lie somewhere between pulmonary arteries and veins, were compressed by positive pressure inflation.10 Our model also provides an explanation for reports that perfusion and gas exchange continue in isolated lungs in Zone 1 (Pinf > Ppulm art > PLA).11 Albert et al. found that up to 15% of resting cardiac output occurred through lungs completely in zone I, and suggested that this flow occurred through acinar vessels.12 In a subsequent report, they showed that flow continued through acinar vessels at the pleural surface under zone I conditions in which alveolar septal vessels were collapsed.9 These observations support the idea that the acinar microcirculation is a parallel perfusion network that makes perfusion available to the alveoli it encircles. Indeed, flow could not have continued through zone I lungs in which the alveolar vessels were collapsed unless an extra-alveolar parallel perfusion network existed, such as that shown in our model (Fig. 6). Others have expressed a similar idea previously. Clark et al. proposed a theoretical model of the acinar circulation that consisted of both serial and parallel microperfusion pathways among and within the pulmonary acini.8 They suggested that their model provided a greater capacity for capillary recruitment when pulmonary vascular pressures were elevated.
Our suggestion, that the acinar circulation is a web of parallel perfusion pathways, has not been previously described. Previous authors have viewed perfusion through acinar vessels on the surface of the lung, and we previously measured the total concentration of 4-µm particles in the venous outflow of isolated rat lungs.1,3 However, no previous work has compared the effects of positive and negative pressure ventilation on perfusion through this circulation. Furthermore, no previous work has shown how particles infused first (red particles) affect the venous concentrations and perfusion distributions (trapping patterns) of particles infused subsequently (green particles). The global view of the acinar circulation that we propose here (Fig. 6) is entirely new.
The main difference between our results and those of previous authors is that we provide direct, anatomical evidence to show how perfusion is affected by positive and negative ventilation within the lung parenchyma, and not just at the pleural surface. Much of the previous evidence is indirect, based on assumptions about the definition of “middle segment” vessels. Such vessels have never been defined anatomically. However, our results show specifically, for the first time, how perfusion within acinar vessels is affected by positive and negative pressure ventilation.
Our parallel perfusion model (Fig. 6) also shows how this acinar vessel population might be arranged. Fung and Sobin suggested that flow through alveolar vessels occurs as a sheet, rather than through individual alveolar septal capillaries.13 Our results extend this concept to the next larger vessel population, namely the acinar vessels that supply the septal capillaries. Our results suggest that flow through these vessels also occurs as a sheet, rather than through individual vessels, as in an arteriole–capillary–venule arrangement of vessels in series. This is demonstrated by the broad interdigitation of the red and green particles (Fig. 3) that were infused sequentially. Our conclusion has important implications for how the lung operates in health and disease, where microthrombi might obstruct portions of the acinar circulation, and in conditions where the acinar circulation might be compressed, as in positive pressure ventilation, or dilated in conditions such hyperpnea of exercise where intrapleural pressures are more subatmospheric than at rest, or where they are deeply subatmospheric as in sleep apnea. Our acinar circulation model (Fig. 6) also provides an explanation for the observation that systolic PAP rises measurably only after one-third of the pulmonary circulation is obstructed.14
In summary, we found that negative pressure ventilation produced greater perfusate flows, greater venous particle concentrations, and more uniform distribution of 4-µm particle intravascular trapping than did positive pressure ventilation. We further found that particle trapping within lungs ventilated using positive pressures was confined to islands that may represent flow-through channels that are less susceptible to compression than other portions of the acinar microcirculation (Fig. 6). This phenomenon has not been previously reported. We believe that our data provide firm support, for the first time, for the existence of an extensive parallel perfusion acinar vessel network that surrounds the alveoli. Such a network would provide optimal perfusion distribution among the alveoli, while also allowing perfusate bypass into the pulmonary venous outflow. This idea provides an explanation for the reports by numerous previous authors of continued perfusion through the lung under conditions in which inflation pressures exceed vascular pressures. Such a network would provide optimal perfusion distribution among the alveoli at the low perfusion pressures at which the lung operates.
Conflict of interest
The author(s) declare that there is no conflict of interest.
Funding
Supported by the Veterans Health Administration, Office of Research and Development, Department of Veterans Affairs, Biomedical Laboratory Research and Development Service. The contents do not represent the views of the Department of Veterans Affairs or the United States Government.
References
- 1.Conhaim RL, Watson KE, Heisey DM, et al. Perfusion heterogeneity in rat lungs assessed from the distribution of 4-µm diameter latex particles. J Applied Physiol 2003; 94: 420–428. [DOI] [PubMed] [Google Scholar]
- 2.Fulekar M. Bioinformatics: Applications in Life and Environmental Sciences, Mineola, NY: Dover, 2009. [Google Scholar]
- 3.Short AC, Montoya ML, Gebb SA, et al. Pulmonary capillary diameters and recruitment characteristics in subpleural and interior networks. J Applied Physiol 1996; 80(5): 1568–1573. [DOI] [PubMed] [Google Scholar]
- 4.Conhaim RL, Rodenkirch LA, Harms BA. Acellular hemoglobin solution enters compressed lung capillaries more readily than red blood cells. J Applied Physiol 2000; 89: 1198–1204. [DOI] [PubMed] [Google Scholar]
- 5.Conhaim RL, Harms BA. Perfusion of alveolar septa in isolated rat lungs in zone 1. J Applied Physiol 1993; 75(2): 704–711. [DOI] [PubMed] [Google Scholar]
- 6.Conhaim RL, Rodenkirch LA. Estimated functional diameter of alveolar septal microvessels at the zone I-II border. Microcirculation 1997; 4(1): 51–59. [DOI] [PubMed] [Google Scholar]
- 7.Conhaim RL, Rodenkirch LA. Functional diameters of alveolar microvessels at high lung volume in zone II. J Applied Physiol 1998; 85(1): 47–52. [DOI] [PubMed] [Google Scholar]
- 8.Clark AR, Burrowes KS, Tawhai MH. Contribution of serial and parallel microperfusion to spatial variability in pulmonary inter- and intra-acinar blood flow. J Appl Physiol 2010; 108: 1116–1126. [DOI] [PMC free article] [PubMed] [Google Scholar]
- 9.Lamm WJE, Kirk KR, Hanson WL, et al. Flow thorough zone 1 lung utilizes alveolar corner vessels. J Applied Physiol 1991; 70(4): 1518–1523. [DOI] [PubMed] [Google Scholar]
- 10.Howell JBL, Permutt S, Proctor DF, et al. Effect of inflation of the lung on different parts of pulmonary vascular bed. J Appl Physiol 1961; 16(1): 71–76. [DOI] [PubMed] [Google Scholar]
- 11.Lamm WJ, Obermiller T, Hlastala MP, et al. Perfusion through vessels open in zone 1 contributes to gas exchange in rabbit lungs in situ. J Applied Physiol 1995; 79(6): 1895–1899. [DOI] [PubMed] [Google Scholar]
- 12.Koyama S, Lamm WJ, Hildebrant J, et al. Flow characteristics of open vessels in zone 1 rabbit lungs. J Appl Physiol 1989; 66(4): 1817–1823. [DOI] [PubMed] [Google Scholar]
- 13.Fung YC, Sobin SS. Theory of sheet flow in lung alveoli. J Appl Physiol 1969; 26(4): 472–488. [DOI] [PubMed] [Google Scholar]
- 14.Liu Y-Y, Li XC, Duan Z, et al. Correlation between the embolism area and pulmonary arterial systolic pressure as an indicator of pulmonary arterial hypertension in patients with acute thromboembolism. Eur Rev Med Pharmacol Sci 2014; 18: 2551–2555. [PubMed] [Google Scholar]
- 15.Conhaim RL, Rodenkirch LA. Estimated functional diameter of alveolar septal microvessels in zone 1. Am J Physiol 1996; 271(3 Pt 2): H996–1003. [DOI] [PubMed] [Google Scholar]


