Abstract
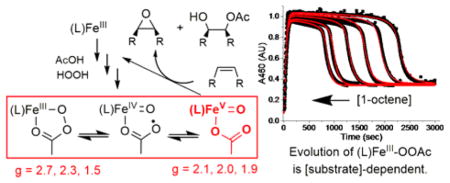
Inspired by the remarkable chemistry of the family of Rieske oxygenase enzymes, nonheme iron complexes of tetradentate N4 ligands have been developed to catalyze hydrocarbon oxidation reactions using H2O2 in the presence of added carboxylic acids. The observation that the stereo- and enantioselectivity of the oxidation products can be modulated by the electronic and steric properties of the acid implicates an oxidizing species that incorporates the carboxylate moiety. Frozen solutions of these catalytic mixtures generally afford two S = ½ intermediates, a highly anisotropic g2.7 subset (gmax = 2.58 to 2.78 and Δg = 0.85 – 1.2) that we assign to an FeIII–OOAc species and the less anisotropic g2.07 subset (g = 2.07, 2.01, and 1.96 and Δg ~ 0.11) we associate with an FeV(O)(OAc) species. Kinetic studies on the reactions of iron complexes supported by the TPA (tris(pyridyl-2-methyl)amine) ligand family with H2O2/AcOH or AcOOH at −40 °C reveal the formation of a visible chromophore at 460 nm, which persists in a steady state phase and then decays exponentially upon depletion of the peroxo oxidant with a rate constant that is substrate independent. Remarkably, the duration of this steady state phase can be modulated by the nature of the substrate and its concentration, which is a rarely observed phenomenon. A numerical simulation of this behavior as a function of substrate type and concentration affords a kinetic model in which the two intermediates exist in a dynamic equilibrium that is modulated by the electronic properties of the supporting ligands. This notion is supported by EPR studies of the reaction mixtures. Importantly, these studies unambiguously show that the g2.07 species, and not the g2.7 species, is responsible for substrate oxidation in the (L)FeII/H2O2/AcOH catalytic system. Instead the g2.7 species appears to be off-pathway and serves as a reservoir for the g2.07 species. These findings will be helpful not only for the design of regio- and stereo-specific nonheme iron oxidation catalysts but also for providing insight into the mechanisms of the remarkably versatile oxidants formed by nature’s most potent oxygenases.
Graphical abstract
INTRODUCTION
The oxidation of hydrocarbons is a process of significant biological and industrial importance. Our approach to designing new synthetic catalysts for oxidative hydrocarbon transformations is inspired by the many iron-dependent oxygenases that have evolved in biological systems for the stereoselective oxidation of C–H and C=C bonds.1–3 Among these biological catalysts, a particularly broad and versatile class activates dioxygen at an iron center ligated by a common 2-histidine-1-carboxylate facial triad motif.3–6 One of the more intriguing members of this class is the Rieske oxygenase family of enzymes, which requires two electrons from NADH to activate dioxygen and carry out a wide array of important transformations, including C–H and C=C bond oxygenation, O- and N-demethylation, and C–C bond formation.5, 7 For naphthalene 1,2-dioxygenase and carbazole 1,9a-dioxygenase, O2 adducts of the respective enzyme-substrate complexes have been trapped in crystals and found to possess a dioxygen unit that is side-on bound to the iron center and in close proximity to the target C=C bond of the bound substrate.8, 9 This O2 adduct is speculated to correspond to the (hydro)peroxoiron(III) intermediate observed in the “peroxide shunt” reaction of fully oxidized benzoate 1,2-dioxygenase, which is capable of producing one turnover of the expected cis-diol product.10 Additional studies on the reaction of benzoate 1,2-dioxygenase with dioxygen suggest that O2 binds to the mononuclear FeII to form an FeIII-superoxo species that attacks the substrate.11 This transient species is stabilized by a nearly simultaneous electron transfer from the Rieske cluster to yield an FeIII-peroxo species. Whether these peroxoiron(III) intermediates directly yield the oxidation products, or first undergo O–O bond cleavage to generate intermediate (L)FeV(O) oxidizing species is currently not clear. This puzzle has motivated chemists to design and study synthetic model complexes that resemble the active site species and/or duplicate function,12–18 which can provide fundamental insights into the oxidative chemistry, in addition to the discovery of practical systems for the synthesis of organic compounds.
Inspired by the broad range of oxidative reactivities exhibited by the Rieske enzyme family,5 particularly with respect to C–H bond cleavage and C=C bond oxidation, we and others have described a family of synthetic mono-iron catalysts supported by tetradentate N4 ligands that can mediate C–H bond hydroxylation and C=C bond epoxidation and cis-dihydroxylation using H2O2 as the oxidant.12–18 In these systems, the H2O2 serves as a convenient substitute for the O2/2e−/2H+ combination utilized by the oxygenases.10, 19 Analogous to the biological reactions, the synthetic Fe(L)/H2O2 reaction mixtures afford FeIII–OOH intermediates, which have been trapped and characterized at −40 °C for a number of these bio-inspired catalysts.17, 20–28 Initially, the observed incorporation of 18O from added H218O into the alkane or olefin oxidation products led us to propose a “water-assisted mechanism”,17, 22, 23 in which an iron-bound water ligand promotes the heterolytic cleavage of the O–O bond of the peroxoiron(III) intermediate to generate an FeV(O)(OH) oxidant, analogous to that proposed for the Rieske oxygenases.29, 30 This idea was corroborated by Costas and co-workers in their observation of suitably labelled (L)FeV(O)(OH) ions by cold spray ionization mass spectrometry when the ions were generated in the presence of H218O2 or H218O.31, 32 In further support, recent kinetic studies revealed an H2O/D2O isotope effect in the decay of the FeIII–OOH intermediate as well as in the formation of the diol and epoxide products of 1-octene oxidation.28
The efficiency and selectivity of these iron catalysts have been further enhanced by replacing water with carboxylic acids.33, 34 This has resulted in the development of synthetically useful transformations where specific C–H bonds in polyfunctional organic molecules can be oxidized with surprisingly high selectivity.13, 35–38 The carboxylic acid additive has also led to the development of highly enantioselective olefin epoxidation reactions,16, 18, 39–42 for which the % enantiomeric excess can be modulated by the steric bulk of the carboxylic acid40, 43 and the electronic properties of the supporting ligand.41
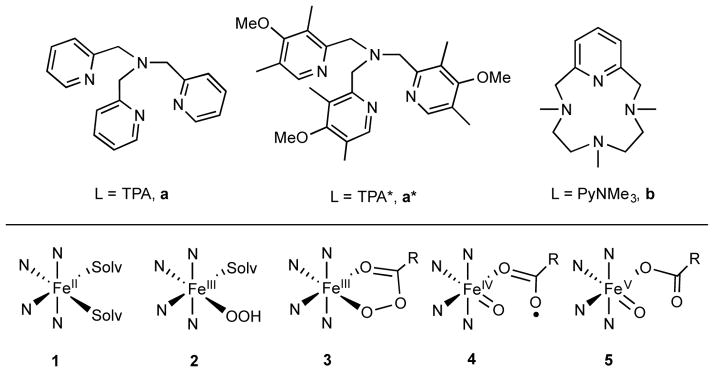
Mechanistic studies aimed at elucidating the “magic” elicited by the carboxylic acid additive have been unexpectedly complicated. EPR studies at cryogenic temperatures on reaction mixtures of the Fe(L) catalysts with H2O2/RC(O)OH or peracids have revealed the formation of transient S = ½ intermediates that have stimulated significant discussion regarding the oxidation states of the iron centers. These S = ½ species can be broadly classified into two categories on the basis of their EPR anisotropy (Table 1): (i) a highly anisotropic subset (hereafter referred to as g2.7 species) with gmax values ranging from 2.58 to 2.78 (Δg = 0.85 – 1.2), and (ii) a much less anisotropic subset (referred to as g2.07 species) with invariant g-values of 2.07, 2.01, and 1.96 (Δg ~ 0.11).40, 44–50 The structural assignments and reactivity patterns of these two subsets of intermediates have, however, remained unclear, as there are contradictory interpretations regarding the nature of the iron center in the literature.17, 49, 51–54 For example, the g2.7 species supported by the TPA ligand (Scheme 1) has been assigned based on EPR evidence alone by Talsi and co-workers as an FeV(O)(OAc) species,44, 45, 49 while the analogous g2.7 intermediate supported by TPA* has been identified by some of us as an FeIII–κ2-OOAc species based on a more comprehensive spectroscopic analysis.26 Additionally, the g2.07 species supported by the TPA* and PDP* ligands, first observed by Talsi, have been assigned as FeIV(O)(•OAc) species, where the oxidizing equivalents are distributed between the ligand and the iron center.51, 52 However, detailed EPR studies by Costas and co-workers on a related g2.07 species have argued against the FeIV(O)(•OAc) characterization and instead favored an FeV(O) electronic structure for which the oxidizing equivalents are predominantly located on the iron center.54 This contradiction extends to the reactivity patterns, as the g2.7 species supported by the TPA ligand was reported to epoxidize cyclohexene at a rate dependent on olefin concentration,44, 49 whereas the decay rate of the related g2.7 species supported by TPA* was unaffected by the nature and concentrations of various olefins.50 More significantly, the connection between the g2.7 and g2.07 species has not yet been established, even though these seemingly related subsets of intermediates are generated under comparable reaction conditions.
Table 1.
EPR properties of the S = ½ iron species previously observed in reaction mixtures of nonheme iron catalysts with H2O2/RCOOH or peracids
| Precursor | Oxidant (Temp) | High g-anisotropy (g2.7) species % spin |
Low g-anisotropy (g2.07) species (2.07, 2.01, 1.96) % spin |
ref |
|---|---|---|---|---|
| (TPA)FeII | H2O2/AcOH (−40 °C) or mCPBA (−60°C) |
2.74, 2.42, 1.53 4 – 21% |
not observed | 44, 50, 54 |
| (TPA*)FeII | H2O2/AcOH or mCPBA (−40 °C) |
2.58, 2.38, 1.73 43 – 50 % |
not observed | 50 |
| [(TPA*)FeIII]2O | H2O2/AcOH (−85 °C) |
2.58, 2.38, 1.73 observed but % not reported |
2 – 3 % | 51 |
| (BPMEN)FeII | H2O2/AcOH (−70 °C) or peracids (−60 °C) |
2.69, 2.42, 1.70 4–10 % |
not observed | 50 |
| (S,S-PDP)FeII | H2O2/AcOH (−70 °C) H2O2/2-EhOH (−70 °C) |
2.66, 2.42, 1.71 2 – 3 % not observed |
not observed 2 – 3 % |
40, 52 53 |
| (S,S-PDP*)FeII | H2O2/AcOH (−40 to −85 °C) |
2.72, 2.42, ? 7% |
not observed | 48 |
| [(S,S-PDP*)FeIII]2O | H2O2/AcOH or AcOOH (−65 to −85 °C) |
2.52, 2.41, 1.80 observed but % not reported |
<2 % | 51, 53 |
| (PyNMe3)FeII | AcOOH (−40 °C) | not observed | 40 % | 54 |
Abbreviations used: BPMCN = N,N′-dimethyl-N,N′-bis(2-pyridylmethyl)-trans-1,2-diaminocyclohexane; BPMEN = N,N′-dimethyl-N,N′-bis(2-pyridylmethyl)ethane-1,2-diamine; mCPBA = meta-chloroperbenzoic acid; PDP = N,N′-bis(2-pyridylmethyl)-2,2′-bipyrrolidine; PDP* = N,N′-bis(3,5-dimethyl-4-methoxy-2-pyridylmethyl)-2,2′-bipyrrolidine; PyNMe3 = 3,6,9-trimethyl-3,6,9-triaza-1(2,6)-pyridinacyclodecaphane; 2-EhOH = 2-ethylhexanoic acid; TPA = tris(2-pyridylmethyl)amine; TPA* = tris(3,5-dimethyl-4-methoxy-2-pyridylmethyl)amine.
Scheme 1.
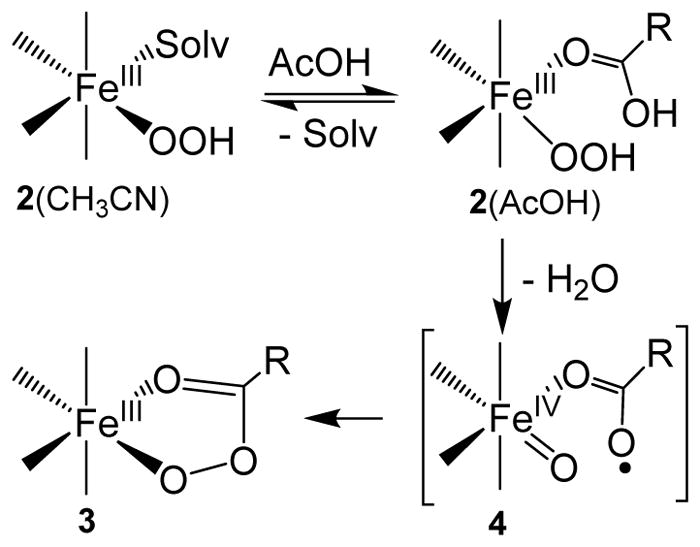
Proposed mechanism for the formation of the S = ½ FeIII–OOAc intermediate based on previous DFT calculations.44, 45, 48, 74
Herein, we describe detailed kinetic studies that demonstrate the presence of an equilibrium between the g2.7 and the g2.07 species. Accompanied by a more comprehensive spectroscopic analysis, this work also enables a more definitive assignment of the nature of the two novel intermediates. Insight into the role of each intermediate in hydrocarbon oxidation reactions by the (L)Fe/H2O2/RC(O)OH catalytic systems, where L = tetradentate N4 ligand is also provided. Overall, these studies provide clarity to current contradictions that surround the structural assignment and reactivity patterns of the g2.7 and g2.07 intermediate classes.
EXPERIMENTAL SECTION
Materials
All reagents and solvents used were of commercially available quality, unless otherwise stated. Solvents were purchased from Acros and Sigma-Aldrich and used without further purification. Peracetic acid was purchased from Aldrich as a 32 wt % solution in acetic acid containing less than 6 % H2O2, while cyclohexane peroxycarboxylic acid (CPCA) was prepared according to published procedures.55 Compounds 1a and 1a* were prepared as previously described.23, 50
Physical Methods
UV-visible spectra were recorded on a Hewlett-Packard 8453A diode array spectrometer equipped with a cryostat from Unisoku Scientific Instruments, Osaka, Japan. X-band EPR spectra were recorded on a Bruker Elexsys E-500 spectrometer equipped with an Oxford ESR 910 liquid helium cryostat and an Oxford temperature controller. The quantification of the signals was relative to a Cu-EDTA spin standard. The SpinCount software for EPR analysis was provided by Dr. Michael P. Hendrich of Carnegie Mellon University.
Product analyses were performed on a Perkin-Elmer Sigma 3 gas chromatography (AT-1701 column, 30 m) and a flame-ionization detector. GC mass spectral analyses were performed on a HP 5898 GC (DB-5 column, 60 m) with a Finnigan MAT 95 mass detector or a HP 6890 GC (HP-5 column, 30 m) with an Agilent 5973 mass detector. NH3/CH4 (4 %) was used as the ionization gas for chemical ionization analyses.
Catalytic Substrate Oxidation
In a typical reaction, H2O2 in CH3CN was introduced to a vigorously stirred CH3CN solution (2.0 mL) containing the iron catalyst, AcOH, and the substrate. The solution was stirred at the temperature of interest until the UV-vis chromophore of 3 completely decayed. The reaction mixture was subsequently treated with 0.1 mL of 1-methylimidazole and 1 mL of acetic anhydride to esterify the alcohol products for GC and GC-MS analyses. Naphthalene was used as an internal standard in these analyses.
RESULTS AND DISCUSSION
Kinetic studies for C–H and C=C oxidation by 3a and 3a*
We have previously reported that the g2.7 species 3a* (See Figure 1) can be generated from a combination of the iron(II) complex 1a* and either the H2O2/AcOH combination or AcOOH in CH3CN at −40 °C.50 The UV-visible, EPR, Mössbauer, and ESI mass spectrometric properties of this species favor its assignment as a low-spin FeIII–OOAc complex. Optical monitoring of the kinetic evolution of 3a* at its λmax of 460 nm reveals that this species forms rapidly, persists in a steady state, and then undergoes decay once H2O2 is depleted (Figure 2). Changes in the concentration of 3a*, as monitored at 460 nm, track well with changes in the integrated EPR signals of samples taken during the course of the reaction,17 indicating that the optical and EPR spectra arise from the same species. The decay of 3a* during the last turnover exhibits an exponential behavior, which can be fit to obtain a first-order rate constant of 0.010(1) s−1. Significantly, this observed rate constant does not vary with the nature or concentration of various substrates,50 indicating that 3a* does not oxidize substrates directly.
Figure 1.
Top: Ligands used in this study that are proposed to support nonheme FeV(O) intermediates. Bottom: Various metal species involved in this study. The labelling scheme used throughout the text combines numbers that designate the metal species with letters that designate the ligands. For example, for complexes supported by TPA, the (L)FeII complex = 1a, (L)FeIII-OOH = 2a, (L)FeIII-OOAc = 3a, (L)FeIV(O)(•OAc) = 4a, and (L)FeV(O)(OAc) = 5a.
Figure 2.
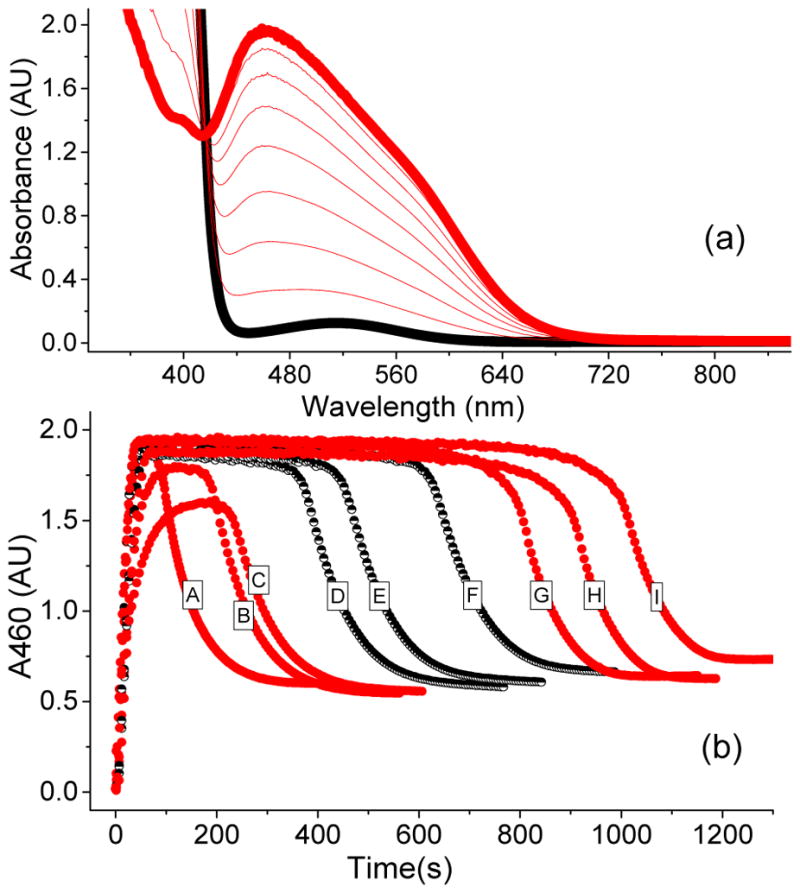
(a) UV-vis spectrum of a catalytic oxidation reaction involving 1a* (1 mM), H2O2 (10 mM), and AcOH (200 mM) in CH3CN at −40 °C showing the formation of 3a*, which is generated in 50 % yield relative to the 1a*. (b) The time traces depict the kinetic time course of 3a* as monitored at 460 nm in the presence of various substrate types and concentrations. A = 250 mM cyclohexadiene; B = 250 mM cyclohexene; C = 250 mM cyclooctene; D = 250 mM 1-octene; E = 125 mM 1-octene; F = 62.5 mM 1-octene; G = 250 mM cyclohexane; H = 250 mM tert-butyl acrylate; I = No substrate. The black half-filled circles representing different 1-octene concentrations demonstrate that the length of the steady state phase is also influenced by this variable.
Unlike 3a*, the observed rate constant for the decay of the related 3a species, which is supported by the less electron-donating TPA ligand, changes upon the introduction of 1-octene (Figure 3a). Upon addition of excess H2O2 into a CH3CN solution of 1a and AcOH at −40 °C,50 3a is generated, goes into a steady state phase, and then undergoes rapid decay upon depletion of H2O2 in the multiple-turnover reaction, analogous to 3a*. Analysis of the kinetic time course for the seemingly exponential decay of 3a towards the end of the reaction provides a first-order decay rate constant of 0.010 s−1 at −40 °C, which increases to 0.032 s−1 in the presence of 50 equivalents of 1-octene. At first glance, these results are consistent with the previously reported substrate reactivity of 3a by Talsi and co-workers,44 who monitored the intensity of the gmax = 2.7 EPR signal of 3a as a function of time at −70 °C and found the decay rate constant to increase by a factor of 5 in the presence of 12 equivalents of cyclohexene. However, we find that the observed rate constant for 3a-decay increases further as a function of 1-octene concentration until it reaches a maximum of 0.045 s−1, and then becomes independent of substrate concentration (Figure 3b). This hyperbolic correlation indicates that, analogous to 3a*, 3a does not oxidize substrates directly and is most likely reversibly connected to the actual oxidizing species.
Figure 3.
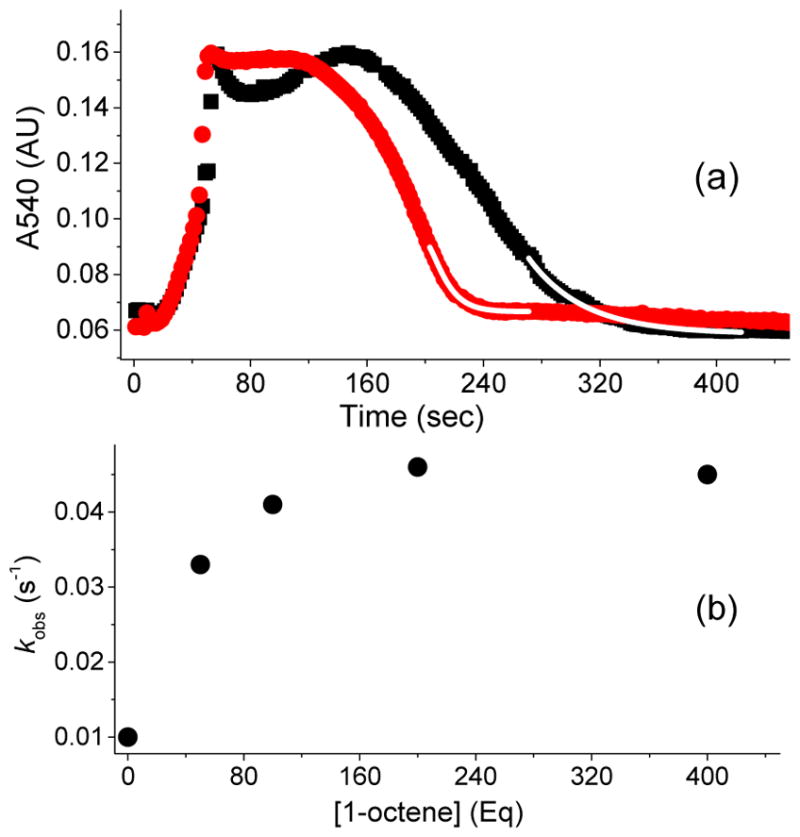
(a) Kinetic time course of 3a (monitored at 540 nm), generated in 20 % yield by adding 20 equiv. of H2O2 (90 % v/v) to a 0.5 mM solution of 1a in CH3CN at −40 °C in the presence of 200 equiv. of AcOH with either no substrate added (black rectangles) or with 50 equiv. 1-octene (red circles). Addition of 1-octene increases the decay rate constant of 3a by a factor of 5. The fitting to obtain the decay rate constant was conducted during the last turnover (upon depletion of HOOH). The decay time course is exponential as the reaction nears completion. The starting points for the exponential fits shown (white line) are chosen well after the transition from the steady state portion of the time course. (b) Correlation between the observed decay rate constants for 3a and 1-octene concentration in the catalytic oxidation of 1-octene using 1a (0.5 mM), H2O2 (10 mM), and AcOH (100 mM) in CH3CN at −40 °C. Note that the kinetic evolution of 3a was monitored at 540 nm, because the 460 nm λmax has significant background contribution from the decay product due to the low yield of 3a. For comparison, the kinetic behavior of 3a* is identical whether followed at its λmax of 460 nm or at 540 nm (Figure S1).
Interestingly, the lengths of the steady state phase of both 3a and 3a* (Figures 2b and 3a) are sensitive to the nature of the substrates. For example, the steady state phase of 3a* in the presence of the electron-poor t-butyl acrylate substrate is almost as long as that in the absence of substrate, but is shortened significantly with the introduction of electron-rich olefins such as cyclooctene and cyclohexene (Figure 2b). Substrate concentration also alters the duration of the steady state phase of 3a*, as can be seen for 1-octene (Figure 2b, black traces). In fact, a linear correlation between the inverse length of the steady state phase and substrate concentration can be obtained for various substrates (Figure 4a). A similar trend is observed in C–H bond oxidation reactions, where substrates with strong C–H bonds such as cyclohexane (BDE ~ 99 kcal/mol)56 exhibit a longer steady state phase than those with weaker C–H bonds such as cyclohexadiene (BDE = 77 kcal/mol) (Figure 2). Remarkably, an excellent linear correlation is observed when the ln(1/steady state duration) is plotted vs. C–H BDE56 (Figure 4b, see discussion based on the numerical simulation of the reaction below). Because the inverse of the length of the steady state phase is related to the C–H bond cleavage rate, this plot corresponds to the Bell–Evans–Polanyi plot of log kHAT vs C–H BDE commonly used to describe H-atom transfer reactivity of various oxidants.57–59 As 3a and 3a* do not oxidize substrates directly, the observed changes in the length of their steady state phase as a function of the nature of the substrate and its concentration support the notion that these intermediates are reversibly connected to the species responsible for substrate oxidation.
Figure 4.
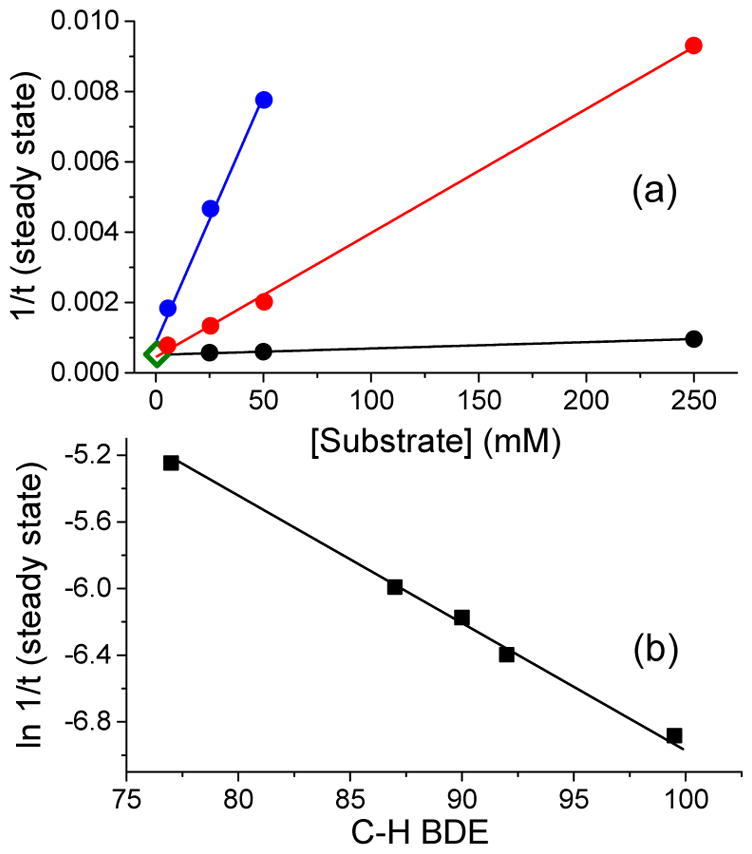
(a) Plot of the inverse length of the steady state duration of 3a* (460 nm) as a function of [cyclohexadiene] (blue), [cyclohexene] (red), and [1-octene] (black) in the 1a* (1 mM)/H2O2 (20 mM)/AcOH (200 mM)/substrate mixture in CH3CN at −40 °C. The point represented by the open diamond at the bottom left corner corresponds to the inverse length of the steady state duration of 3a* in the absence of any substrate. (b) Correlation between the natural log of the inverse length of the steady state for 3a* (460 nm) as a function of C–H bond dissociation energy in the 1a* (1 mM)/H2O2 (20 mM)/AcOH (200 mM)/substrate (250 mM) reaction mixture in CH3CN at −40 °C. Substrates used are from left to right cyclohexadiene, ethylbenzene, toluene, tetrahydrofuran, and cyclohexane.
In order to further explore the role of species 3 in the catalytic olefin oxidation reactions, the formation of the 1,2-epoxyoctane product was monitored as a function of time in the 1a*/H2O2/AcOH/1-octene catalytic system via gas chromatography. In agreement with previous results,50 epoxide formation takes place only when 3a* is present in the solution (Figure 5a). There is a short lag phase in epoxide formation, during which time 3a* accumulates to its maximum steady-state level. These results indicate that either 3a* or a species directly connected to it must be involved in the substrate oxidation step. The duration of the lag phase appears to be dependent on the concentration of the substrate. Numerical simulation analysis (vide infra) however shows that the rate of product formation has a minor effect on the length of the lag phase, which suggests that the observed dependence is most likely an experimental artefact that arises due to low detection limits of the gas chromatography. Following the lag phase, the epoxide product forms linearly as a function of time. The rate of epoxide formation correlates linearly with the concentration of 1-octene, indicating a first order dependence on [substrate] (Figure 5b). Replacing CH3COOH with CH3COOD does not alter the rate of epoxide formation (Table 2), indicating that the rate determining step of this reaction is not sensitive to the presence of the O–D bond of this additive. An Arrhenius plot of epoxide formation rates gives an activation energy of 54(2) kJ/mol (Figure S2a and Table 2). This value is significantly smaller than the corresponding activation enthalpy for the unimolecular decay of 3a*, which was obtained under identical reaction conditions (Figure S2b and Table 2). Cumulatively, these results indicate that the rate determining step (rds) of the 1a*/H2O2/AcOH catalytic system is dominated by the epoxide product formation step at low to moderate equivalents of substrate and involves an oxidizing species that is likely to arise from 3a*.
Figure 5.
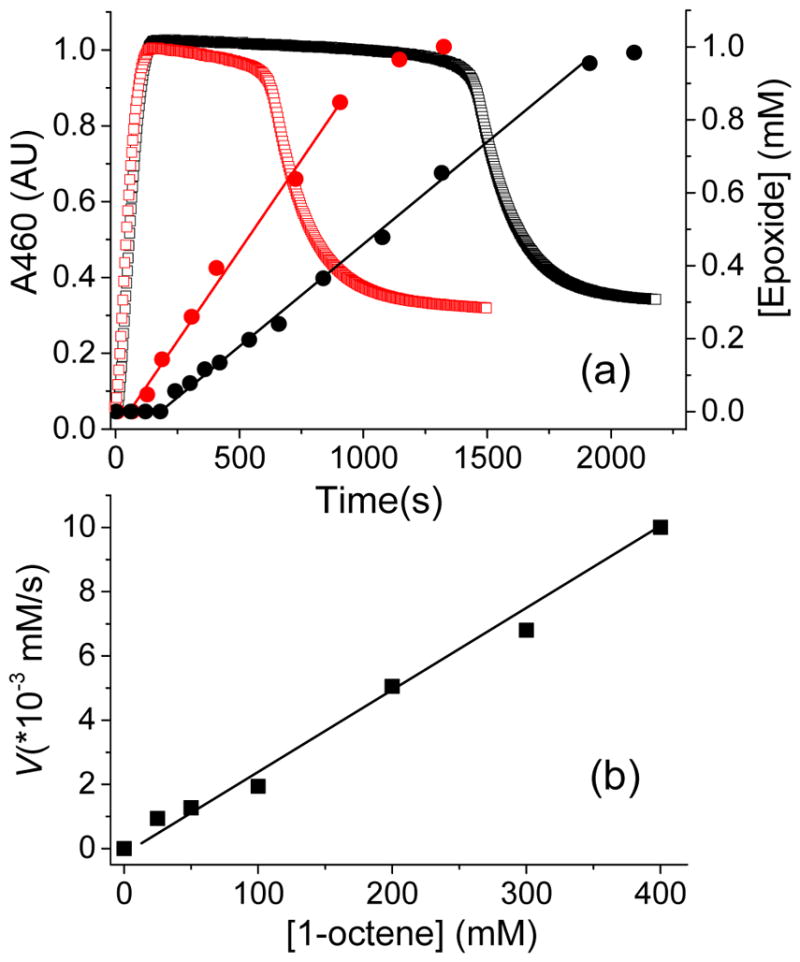
(a) Monitoring the A460 optical chromophore corresponding to 3a* (open squares) and the 1,2-epoxyoctane product yields (filled circles) determined by gas chromatography (GC) as a function of time in the 1a*/H2O2/AcOH/1-octene reaction at −40 °C, with 100 equiv. (black traces) and 400 equiv. (red traces) of 1-octene. The product formation time traces are fit with a linear function (red and black straight lines) to obtain the rate. (b) Plot for the rate of 1,2-epoxyoctane production as a function of [1-octene], in the catalytic oxidation of this substrate using 1a* (0.5 mM), H2O2 (10 mM) and AcOH (100 mM).
Table 2.
Eyring activation parameters and KIE values for the decay of peroxoiron(III) intermediates and product formation rates in catalytic oxidation reactions by iron(II) complexes.
| Reaction mixture | Chemical step monitored | ΔH‡ kJ/mol | ΔS‡ J/mol•K | KIEa | ref |
|---|---|---|---|---|---|
| (TPA)FeII + H2O2 in CH3CN/H2O + 1-octene | H2O-accelerated decay of (TPA)FeIII-OOH (2a) | 45(1) | −95(10) | 2.5 | 28 |
| Product formation | 47(1)b | - | 2.5 | 28 | |
| (TPA)FeIII–OOH in CH3CN + AcOH | AcOH-accelerated decay of (TPA)FeIII-OOH (2a) | 25(2) | −151(10) | 1.7 | This work |
| (TPA*)FeII + H2O2 in CH3CN/AcOH + 1-octene | (TPA*)FeIII–OOAc (3a*) decay | 74(1) | 45(10) | 1.0 | This work |
| Product formation | 54(2)b | - | 1.0 |
Determination of KIE values involved reactions conducted with 200 equiv. of added H2O vs D2O or AcOH vs AcOD.
These values correspond to the activation energies obtained by Arrhenius analysis.
The reaction mechanism for the 1a*/H2O2/AcOH catalytic system appears to be considerably different from that previously deduced for the 1a/H2O2 system.28 For the latter, activation parameters for the (TPA)FeIII-OOH (2a) decay and 1-octene oxide formation were reported to be nearly identical (Table 2). The rate constant of 2a decay was additionally found to be independent of substrate concentration, and an identical KIE of 2.5 was obtained for both the decay of 2a and product formation (Table 2). These results are consistent with an rds for the catalytic reaction that involves 2a decay. Thus, the addition of AcOH into the iron(II)/H2O2 reaction mixtures alters the nature of the intermediate that accumulates in a steady-state manner from 2 to 3 by modifying the overall rds of the catalytic reaction. Importantly, an rds that is dominated by the substrate oxidation step at low to moderate equivalents of substrate, suggests that the oxidizing species may accumulate in the absence of substrate and can therefore be trapped and characterized.
Spectroscopic evidence for the oxidizing species
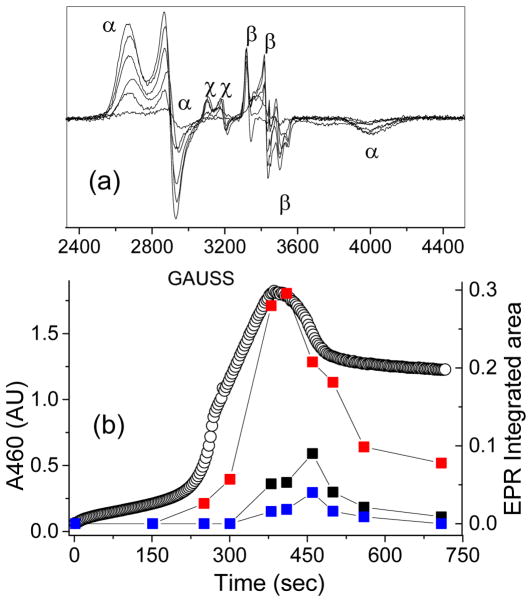
In an effort to trap and characterize the oxidizing species, reaction mixtures of 1a or 1a* with the H2O2/AcOH combination were prepared in CH3CN at −40 °C. Examination of the optical and EPR spectral data for these reaction mixtures revealed no spectroscopic evidence for the presence of a unique intermediate apart from 3a or 3a*.50 As the catalytic activities of the (L)FeII/H2O2/AcOH reaction mixtures (L = TPA and BPMEN, See Figure 1) have previously been shown to be essentially identical to that of (L)FeII/AcOOH,60 the latter combinations were additionally prepared in an attempt to obtain evidence for the oxidizing species. Unfortunately, UV-vis spectral analysis of these reaction mixtures showed the presence of only the respective FeIII–OOAc species, 3. However, EPR spectra of 1a*/AcOOH samples frozen at the time point of maximum accumulation of 3a* based on its 460-nm chromophore showed the presence of two additional sets of EPR signals with g-values of 2.07, 2.01 and 1.96 (designated as 5a*, 9% yield relative to 1a*) and 2.21, 2.16 and 1.94 (designated as 6a*, 4% yield relative to 1a*) (Figure 6 and S3). Interestingly, the g-values of the corresponding complexes 5a and 6a supported by the less electron-donating TPA ligand, which were obtained from the 1a/AcOOH reaction mixture in CH3CN at −40 °C, are quite similar to those of 5a* and 6a* (Table 3), indicating that the difference in the donicity of the supporting tetradentate ligand (TPA, TPA*) does not affect the EPR parameters of 5 and 6 significantly.
Figure 6.
(a) EPR spectrum of a frozen mixture of 1a* and AcOOH in CH3CN showing the formation and decay of 3a* at g = 2.58, 2.38, 1.73 (α, 28 %), 5a* at g = 2.07, 2.01, 1.96 (β, 9 %), and 6a* at g = 2.21, 2.16, 1.94 (χ, 4 %) as a function of time. (b) EPR time-trace for 3a* (red boxes), 5a* (black boxes) and 6a* (blue boxes). The black, open circles represent the optical chromophore of 3a*, monitored at the 460 nm wavelength. EPR conditions: T = 20K, 0.2 mW, 1 mT modulation amplitude.
Table 3.
EPR properties of S = ½ iron species related to the high-valent iron intermediates.
| Complex a | EPR gx,y,z | 57Fe Ax, Ay, Az (MHz) | % Fe | ref |
|---|---|---|---|---|
| (N4Py)FeIII–OOH | 2.16, 2.11, 1.98 | − 9, − 53, + 6 | 100 % | 65 |
| (TPA*)FeIII–OOAc (3a*) | 2.58, 2.38, 1.72 | − 62, + 26, + 42 | 50 % | 50 |
| (TPA)FeIII–OOAc (3a) | 2.74, 2.43, 1.52 | – | 23 % | b |
| 6a* | 2.22, 2.16, 1.94 | Ax = 60 | 4 % | 51/b |
| 6a | 2.21, 2.16, 1.96 | Ax = 60 | 5 % | b |
| 5a* | 2.07, 2.01, 1.96 | Ay = 65 | 9 % | 51/b |
| 5a | 2.07, 2.01, 1.96 | Ay = 65 | 10 % | b |
| [(PyNMe3)FeV(O)]3+ (5b) | 2.07, 2.01, 1.96 | Ax ≪ Ay = 47 ≫ Az | 40 % | 54 |
| [(TMC)FeV(O)(NC(O)Me)]+ | 2.05, 2.01, 1.97 | −47, −17, 0 | 50 % | 61 |
| [(TAML)FeV(O)]− | 1.99, 1.97. 1.74 | −67, −2, − 22 | 95 % | 64 |
| [(Me3TACN)FeIV(O)(Cl-acac•+)]2+ | 1.97, 1.93, 1.91 | – | 35 % | 70 |
| [(TBP8Cz•+)FeIV(O)] | 2.09, 2.05, 2.02 | – | 71 | |
| HRP-Cpd I | 1.99 (broad) | − 26, − 26, − 8 | 62 | |
| CPO-Cpd I | 1.72, 1.61, 2.00 | − 42, − 41, − 3 | 72 | |
| CYP119-Cpd I | 2.00, 1.96, 1.86 | − 38, − 44, − 4 | 72 |
Abbreviations used: CPO = chloroperoxidase; CYP119 = cytochrome P-450; HRP = horseradish peroxidase; Me3TACN = 1,4,7-trimethyl-1,4,7-triazacyclononane, Cl-acac = 3-chloro-acetylacetonate; N4Py = bis(2-pyridylmethyl)-bis(2-pyridyl)methylamine; PyNMe3 = 3,6,9-trimethyl-3,6,9-triaza-1(2,6)-pyridinacyclodecaphane; TAML = tetraamidate macrocyclic ligand; TBP8Cz = octakis(4-tert-butylphenyl)corrolazine; TMC = tetramethylcyclam, TPA* = tris(3,5-dimethyl-4-methoxypyridyl-2-methyl)amine.
This work.
Given that 3a* is not responsible for substrate oxidation, kinetic studies were subsequently conducted in order to determine which of the two new intermediates, 5a* or 6a*, is responsible for substrate oxidation. Aliquots of the 1a*/AcOOH reaction mixture were frozen at various time points and analyzed via EPR spectroscopy. These aliquots revealed a simultaneous accumulation and decay of the EPR signals of 3a*, 5a* and 6a* as a function of time, which tracked the growth and decay of the 460-nm chromophore of 3a* (Figure 6a). These results suggest that the three species most likely exist in a rapid, reversible equilibrium under steady state conditions. When the 1a*/AcOOH reaction mixture was prepared in the presence of various equivalents of 1-octene, the length of the steady state phase of 3a* (460 nm) decreased with increasing 1-octene concentrations, similar to what was observed for the 1a*/H2O2/AcOH reaction mixtures (Figure S4). Importantly, the only EPR signals observed in the presence of 50 equivalents of 1-octene were those of 3a*, while those for 5a* and 6a* disappeared (Figure S5), suggesting that either 5a* or 6a* could be the oxidizing species in the catalytic reaction. These observations are consistent with EPR studies on the (TPA)*FeIII/H2O2/AcOH reaction mixture by Talsi and co-workers,51 in which a frozen sample of the reaction mixture prepared at −85 °C showed EPR signals belonging to 3a*, 5a* and 6a*. In agreement with our observations, they found that the introduction of excess 1-octene caused the EPR signals of 5a* and 6a* to disappear. Even more importantly, the pseudo-first order rate constants for the decay of the EPR signal of 5a* showed a linear correlation with 1-octene concentration, providing a second order decay rate constant of 0.032 M−1 s−1 at −85 °C; unfortunately the kinetic behavior of 6a* was not reported. While these results are consistent with 5a* being the species responsible for oxidizing 1-octene, they do not preclude 6a* from being the oxidant, as these two species appear to be connected via a rapid equilibrium. We subsequently attempted to probe the electronic structures of these species in order to obtain insight into which of the two intermediates is the key oxidizing species.
In order to achieve a reliable spectroscopic characterization of 5a* and 6a*, we first attempted to increase the yield of these species beyond the 4 – 10 % obtained in the 1a*/AcOOH combination at −40 °C, and also suppress the accumulation of 3a*. Lowering the reaction temperature to −65 °C in a CH3CN/(CH3)2CO (1:1 v/v) solvent mixture and substituting peracetic acid with cyclohexane peroxycarboxylic acid (CPCA) suppressed the yields of 5a* and 6a*, but the amount of 3a* remained relatively unchanged. However, combination of the less electron-rich complex 1a and CPCA at −65 °C afforded 5a in a yield of 10 % (relative to 1a) and suppressed the accumulation of 3a and 6a completely (Figure 7 inset). This observation concurs with that of Talsi and co-workers who had previously noted that the relative amounts of 3 and 5 in the (S,S-PDP)FeII/H2O2/RC(O)OH catalytic system strongly depended on the steric bulk of the carboxylic acid used. The accumulated results indicate that the proposed equilibrium between 3 and 5 is perturbed by the electronic properties of the supporting ligand as well as the steric bulk of the carboxylate ligand.52 Importantly, the visible spectrum associated with the reaction solution obtained from the 1a/CPCA combination shows absorption features at 447, 578 and 730 nm (Figure 7), which decayed completely once the EPR signal of 5a disappeared. If these UV-vis features belong to 5a entirely, then respective extinction coefficients of 9000, 5000 and 2000 M−1cm−1 can be estimated. These electronic absorption features are in the same spectroscopic region and of similar intensity as those of related g2.07 species 5b (L = PyNMe3),54 which exhibits visible bands at 490 nm (ε = 7000 M−1cm−1) and 680 nm (ε = 1100 M−1cm−1), and [(TMC)FeV(O)(NC(O)tBu)]+,61 which exhibits bands at 425 nm (ε = 4100 M−1cm−1), 600 nm (ε = 680 M−1cm−1) and 750 nm (ε = 530 M−1cm−1). The similarity in the EPR (see Table 3) and electronic absorption parameters of these g2.07 species indicates that 5a and 5a* may be electronically related to 5b and [(TMC)FeV(O)(NC(O)tBu)]+, the EPR properties of which strongly argue for an FeV(O) assignment.54, 61
Figure 7.
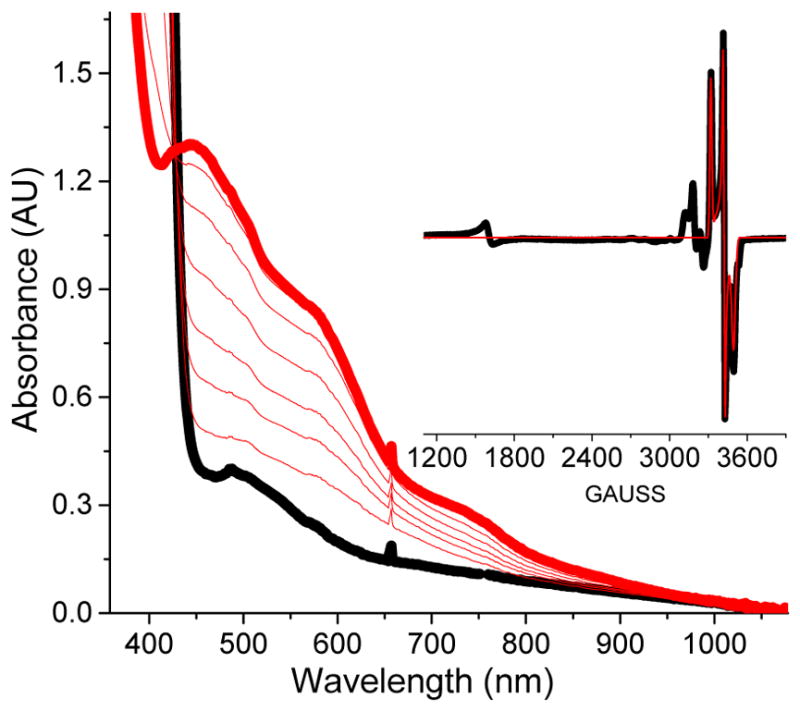
UV-vis spectral evolution of a reaction of 1.5 mM 1a with 5 equiv. of cyclohexane peroxycarboxylic acid (CPCA) in CH3CN/(CH3)2CO (1:1 v/v) at −65 °C. (Inset) EPR spectrum of a sample frozen upon maximum accumulation of the chromophoric species. The black trace is the experimental spectrum, while the red trace is the S = ½ SpinCount simulation with g = 2.07, 2.01, and 1.96 (10 % of total Fe). EPR conditions: T = 20 K, 0.2 mW power, 1 mT modulation.
While our approach to obtaining insight into the oxidation state of intermediates 5 and 6 would typically have involved conducting Mössbauer studies, the ~ 4 – 10 % yields of these species make a reliable Mössbauer characterization difficult. Instead, EPR studies were conducted on 57Fe (I = ½)-enriched frozen samples of the 1/AcOOH reaction mixtures in CH3CN/(CH3)2CO (v/v 1:1). These spectra show that the gmid = gy = 2.01 features of both 5a and 5a* have an identical 57Fe hyperfine splitting corresponding to |Ay(57Fe)| = 65 MHz, while the other two g-values have much smaller A-values. Similarly, the EPR signals of 6a and 6a* show an identical hyperfine splitting along the gmin = gx = 1.94 feature corresponding to |Ax(57Fe)| = 60 MHz, with the other two g-values exhibiting smaller A-values. The large A-tensor anisotropy observed, with the largest A-value along the x or y-axis, has previously been used to argue against an (L•+)FeIV(O) electronic structure,54, 61 which should have comparable Ax and Ay values because of the dxz1dyz1 configuration. Indeed, S = ½ (L•+)FeIV(O) species such as the Compounds I of horseradish peroxidase, chloroperoxidase, and cytochrome P450 exhibit axial 57Fe A-tensors with |Ax| ≈ |Ay| ≫ |Az| (Table 3),62, 63 which reflect the dxy2(dxz)1(dyz)1 electronic configuration associated with an S = 1 FeIV(O) unit. In contrast, the large x/y anisotropy exhibited by 5 and 6 is best rationalized by an S = ½ FeIII or FeV assignment, with the sole unpaired electron occupying either the dxz or dyz orbital.54 Such an x/y anisotropy has been observed for the three other S = ½ FeV complexes [(TAML)FeV(O)]−,64 [(TMC)FeV(O)(NR)]+,61 and (PyNMe3)FeV(O)(OAc),54 as well as low-spin FeIII complexes such as (TPA*)FeIII–OOAc (3a*) and (N4Py)FeIII–OOH (Table 3).50, 65 The EPR g-values of 6 fit well to the Griffith-Taylor model for low-spin iron(III) complexes,50, 54 which considers spin-orbit coupling within a T2g set that is energetically well separated from the Eg set and low-lying charge transfer states.66, 67 In contrast, the g-values of complexes 5a and 5a* do not fit well to the Griffith-Taylor model, but are similar to those of the two characterized FeV(O) complexes [(TAML)FeV(O)]− 64 and [(TMC)FeV(O)(NR)]+,61 as well as (PyNMe3)FeV(O)(OAc), 5b, described by Serrano et al.,54 which argue for their assignment as oxoiron(V) species.
Our proposed assignment of 5a and 5a* as FeV(O) complexes is consistent with their observed reactivity towards hydrocarbon substrates. In particular, 5a* has previously been reported by Talsi to react with 1-octene with a relatively large rate constant of 0.032 M−1s−1 at −85 °C.51 We also find cyclooctene oxidation by the 1a*/AcOOH mixture to afford a large yield of cyclooctene oxide, along with a minor amount of cis-2-acetoxycyclooctanol. The latter incorporates a CD3CO2 group (31 %), when a CH3C(O)OOH/CD3COOH mixture is used. Formation of the cis-2-acetoxycyclooctanol product most likely involves transfer of cis-disposed oxo and acetato ligands of 5a* to the olefinic C=C bonds via a [3+2] cycloaddition pathway.68, 69 The incorporation of deuterated acetate into the cis-2-acetoxycyclooctanol product presumably involves an acetate ligand exchange that takes place at the FeV(O)(OAc) stage, as peracetic acid does not readily exchange with CD3CO2D even in the presence of a Lewis acid,54 so acetate exchange between FeIII–OOAc and CD3CO2D is highly unlikely. These results also support the FeV(O)(OAc) formulation for 5a and 5a*.
The reactivity patterns of 5a and 5a* dovetail well with those of (PyNMe3)FeV(O) complex 5b, which is generated from the reaction of the FeII(PyNMe3) precursor 1b with peracids.54 Apart from exhibiting EPR spectroscopic parameters and 57Fe hyperfine splittings that are nearly identical to those of 5a and 5a* (Table 3), 5b has also been shown to oxidize cyclohexane with a bimolecular rate constant of 2.8 M−1s−1 at −40 °C, which is the largest rate constant for cyclohexane oxidation observed to date for high-valent iron species. 5b also oxidizes cyclooctene with a large bimolecular rate constant of 375 M−1s−1 at −60 °C to afford cyclooctene oxide,73 along with minor amounts of cis-2-acetoxycyclooctanol that become partially deuterated (10 %) when an AcOOH/CD3COOD mixture is used. Given the FeV(O)(OAc) electronic structure deduced for 5b,54 the similar spectroscopic parameters and reactivity patterns of 5a, 5a* and 5b argue for the analogous FeV(O)(OAc) electronic structure assignment for these intermediates. We thus propose 5 to be the active oxidant in the catalytic hydrocarbon oxidation reactions we have described.
Kinetic studies on the role of the FeIII–OOAc complex, 3
Further kinetic studies have been conducted in order to obtain insight into the role of 3 in the 1/H2O2/AcOH catalytic reaction, as well as its relation to the oxidizing species, 5. We began by investigating the formation mechanism of 3a* from 1a*, H2O2 and AcOH. Careful analysis of the optical spectra obtained during the formation of 3a* in the 1a*/H2O2/AcOH reaction mixture at −40 °C did not reveal the presence of a unique UV-vis feature that would correspond to an intervening species.50 EPR analysis of aliquots of this reaction mixture frozen at appropriately chosen time-points, however, showed the presence of additional EPR signals at g = 2.18, 2.15, 1.97, which correspond to the (TPA*)FeIII–OOH species, 2a* (Figure S6).50 The involvement of the FeIII–OOH intermediate during the formation of FeIII–OOAc complexes was even more obvious in reactions involving complex 1a supported by the less electron-rich TPA ligand. The UV-vis spectrum of the 1a/H2O2/AcOH reaction mixture at −40 °C revealed the presence of a broad optical feature at λmax ~ 540 nm, which is characteristic of the (TPA)FeIII–OOH species 2a (Figure 8).24 An EPR analysis of aliquots of this reaction mixture also showed the unique EPR signals of 2a at g⊥ = 2.15 and g║ = 1.97, which accumulated and decayed along the same time frame as those of 3a (Figure 8, inset).34 These results suggest that low-spin FeIII–OOH complexes are likely precursors to the S = ½ FeIII–OOAc complexes 3a and 3a*.
Figure 8.
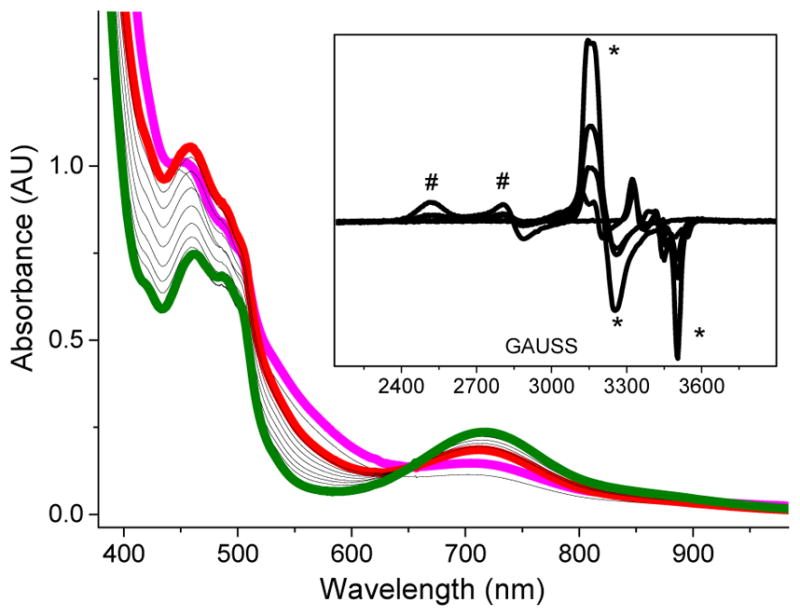
Addition of 20 equiv. of H2O2 to a 1 mM CH3CN solution of 1a and AcOH (200 equiv.) at −40 °C, showing (TPA)FeIII–OOAc complex 3a (red trace), (TPA)FeIII–OOH complex 2a (purple trace) and (TPA)FeIV=O (green trace), which derives from the decay of both 2a and 3a. Inset: EPR analysis of aliquots of this reaction mixture collected at various time points. EPR signals of 2a (*) and 3a (#) can be observed. Both signals are, however, not present at the end of the reaction. EPR conditions: T = 20 K, 0.2 mW, 1 mT modulation amplitude.
If low-spin FeIII–OOH species 2 were competent intermediates during the formation of the FeIII–OOAc complexes 3, then the addition of AcOH to independently generated FeIII–OOH species should also furnish the acylperoxoiron(III) complexes. Consistent with this hypothesis, the addition of excess AcOH into CH3CN solutions of 2a and 2a* at −40 °C led to a rapid accumulation of the ~460-nm chromophore of the respective FeIII–OOAc complexes (Figure 9 and S7). However, the time frames for the decay of 2a and for the formation of 3a were substantially different, indicating that 2a does not directly convert to 3a. The presence of an intermediate in this transformation is made apparent by a careful inspection of the UV-vis spectrum, which shows a rapid increase in absorbance at 370 nm concomitant with the decay of absorbance at 540 nm arising from 2a. This intermediate, designated as 4a, subsequently decays on a longer time frame to afford 3a. In the analogous reaction of 2a* with excess AcOH (Figure S7), the extensive overlap between the broad chromophores of 2a* and 3a* masks the observation of an intermediate during this transformation. EPR analysis of aliquots of the 2a/AcOH reaction mixture, collected at −40 °C and frozen at appropriately chosen time-points showed decay of the S = ½ EPR signals of 2a (gmax ~ 2.15), along with the appearance of the EPR signals of 3a (gmax = 2.74); the latter subsequently disappeared within a time-scale of ~ 400 seconds in agreement with the UV-vis kinetic time course (Figure S8). However, no other S = ½ EPR signals were detected during the decay of 2a and the formation of 3a. Cumulatively, these results show that 3a is formed from the combination of 2a and AcOH via 4a. Current reaction conditions, however, do not lead to the generation of 4a in sufficient yield and purity to ascertain its electronic structure.
Figure 9.
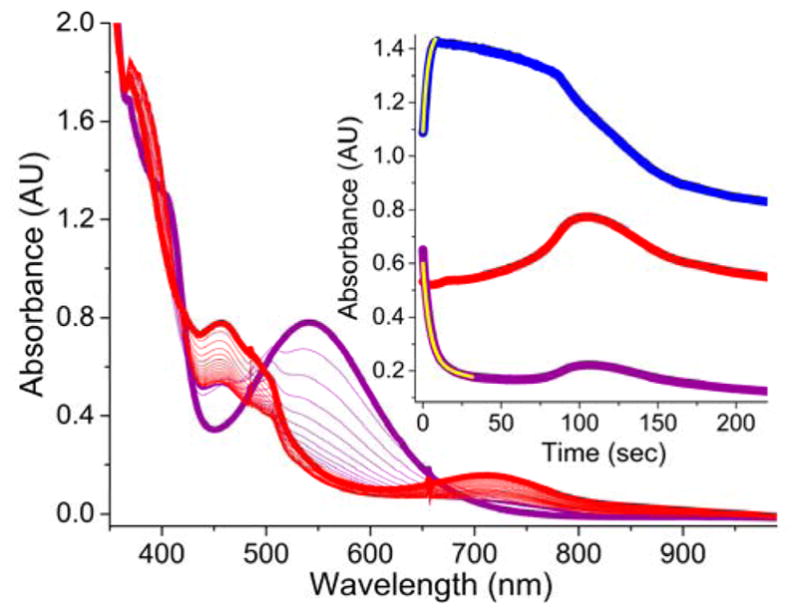
The addition of AcOH (200 equiv.) to 2a (CH3CN, purple trace) generated from a 1 mM CH3CN solution of 1a and H2O2 (10 equiv.) at −40 °C, initiates the decay of 2a (purple trace) and the subsequent formation of 3a (red trace). (Inset) Time trace for the same reaction monitored at 460 nm (red trace), 540 nm (purple trace) and 370 nm (blue trace) wavelengths. The yellow traces in the inset are single exponential fits for the decay of 2a (kobs = 0.17(1) s−1) and formation of 4a (kobs = 0.19(1) s−1). While the decay of 2a is complete within 50 seconds (purple trace), the maximal accumulation of 3a is not complete until 120 seconds (red trace). 3a also possesses an electronic absorption band at 540 nm accounting for the increase in absorption at 540 nm concomitant with the increase at its λmax of 460 nm.
As a detailed spectroscopic characterization of 4 is currently not possible, we have employed an alternative approach to obtain insight into the electronic structure of this species by performing an extensive kinetic study of the AcOH-assisted decay of 2a to form 4a. Given that the rapid decay of 2a is kinetically isolated from the relatively slow formation of 3a, the pseudo unimolecular decay rate constant of 2a can be reliably obtained via exponential fitting of the 540-nm time trace. A good single exponential fit for the decay of 2a in the presence of 200 equiv. of AcOH can indeed be obtained (Figure 9, inset, yellow trace), which provides a pseudo first-order decay rate constant of 0.17(1) s−1. This matches the rate constant for the formation of intermediate 4a as obtained from an exponential fitting of the rapid increase in absorbance at 370 nm. The decay rate constant of 2a varies with AcOH concentration and shows a saturation type behavior (Figure 10) that provides a maximum decay rate constant of 0.28 s−1. This represents a ~900-fold enhancement in the decay of 2a due to the presence of AcOH. The role of AcOH as a proton donor in 2a-decay is further demonstrated by an H/D kinetic isotope effect of 1.7(1) upon substitution of AcOD for AcOH (100 or 200 equiv.). When monitored as a function of temperature, the decay of 2a in the presence of 200 equiv. AcOH takes place with a relatively small activation enthalpy of 25(2) kJ/mol and a large, negative activation entropy of −151(10) J/mol•K (Figure S9), which is consistent with an associative process. Thus, the formation of intermediate 4a involves a fast reversible association of AcOH and 2a, followed by a slower, proton-assisted decay step.
Figure 10.
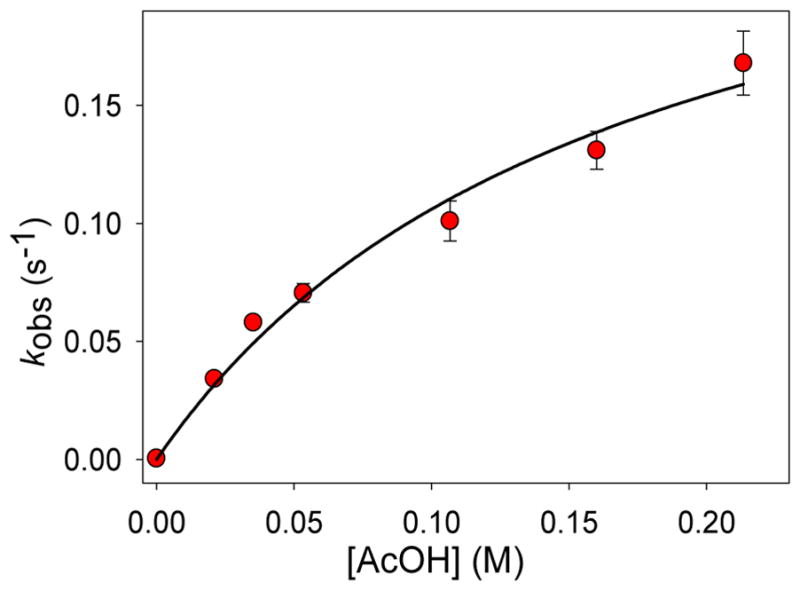
Decay rate constants of 2a (λmax = 540 nm) plotted as a function of [AcOH] at −40 °C. The data are fitted with a hyperbolic function. This fit suggests a 2-step process in which fast reversible binding of AcOH (Kd = 0.17 M) is followed by a slower conversion to another species (4a) at a maximum apparent rate constant of 0.28 s−1. The maximal rate of decay shows that AcOH increases the decay rate of 2a by ~ 900-fold when saturation is achieved.
The formation mechanism we deduce for intermediate 3a parallels that proposed by Wang and Shaik for the generation of the low-spin (S,S-PDP)FeIII–OOAc species based on DFT calculations.74 They found that the most energetically favorable pathway for the AcOH-assisted decay of the (S,S-PDP)FeIII–OOH precursor involved homolytic cleavage of the O–O bond to yield H2O and an S = 1/2 FeIV(O)(•OAc) species with a calculated KIE of 3.3. Subsequent O–O bond coupling occurs with a relatively small energy barrier to generate the FeIII–OOAc species (Scheme 1). Accordingly, we tentatively formulate 4 as an FeIV(O)(•OAc) species but can only associate it with a fleeting absorbance at 370 nm. Additional studies aimed at confirming the assignment of this intermediate and gaining further insight into its electronic structure are ongoing.
Numerical simulation of the kinetic traces of 3a* in the presence of 1-octene
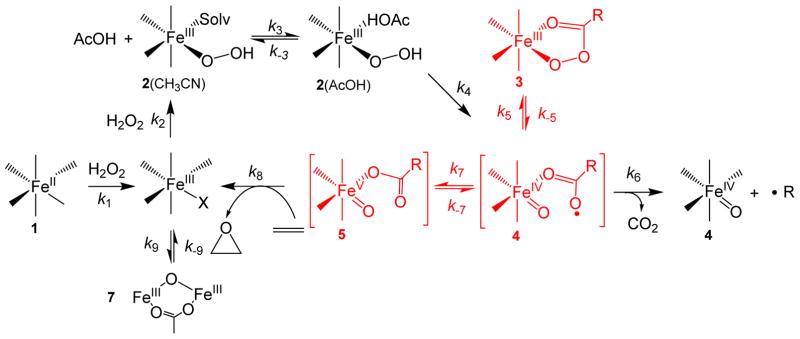
In order to obtain further clarity on the roles of the FeIII–OOAc and FeV(O)(OAc) species in the FeII/H2O2/AcOH catalytic system, we have devised a chemical scheme (Scheme 2) based upon the aforementioned kinetic studies describing the formation of the g2.7 species (3a/3a*), its lack of reactivity with C–H and C=C bonds,50 and its necessary evolution to the g2.07 species (5a/5a*) that actually carries out substrate oxidation. Using this chemical model, we can rationalize the curious kinetic behavior of 3a*, where the duration of its steady state phase decreases as a function of the nature of the substrate and its concentration without an apparent enhancement in the observed rate constant of its ultimate decay (Figure 2). The comparatively high yield of 3a* and the well-defined steady state segment makes this reaction the best choice for simulation of the time course.
Scheme 2.
Chemical model used to fit the kinetic evolution of 3a* (460 nm) as a function of 1-octene concentration shown in Figure 11. The unique equilibrium among the components of the catalytic troika, 3, 4 and 5, is highlighted with red. The H/D KIE observed in the reaction of 2 with AcOH (Table 2) would be connected in the k4 step in this scheme.
A numerical integration simulation approach has been utilized where the rate constants for the steps in Scheme 2 are varied to produce the best least-squares fit to the experimental data. The initial parameters for some of the kinetic steps were obtained from previous experimental values34 and from experiments describing the formation of (TPA)FeIII–OOAc from (TPA)FeIII–OOH and AcOH in this study. This model successfully simulates the variation in the kinetic time traces of 3a* as a function of [1-octene] (Figure 11). The details of the fitting method are described in the SI. The fitted rate constants for the individual steps in this kinetic model are presented in Table 4. A few of the rate constants, especially those in the beginning of the catalytic cycle (k1, k2, k3) can be varied significantly without altering the fit to the data. With the use of the same model and rate constants, a comparably good fit of the data can also be obtained for the oxidation of 1-octene shown in Figure 2b at double the catalyst concentration (Figure S10). The good fit between the numerical simulations and the experimental data presented in Figures 2 and 11 show that the mechanism presented in Scheme 2 is plausible and consistent with the experimental data. Alternative chemical models shown in Schemes S2 and S3 were also considered as possible solutions, but they did not prove successful. The presence of an equilibrium between the tautomeric species 4a* and 5a* means that 4a* in Scheme 2 cannot be ruled out as a reactive species. As 4a* is only present in a very small concentration, it is difficult to clarify its nature. However there is growing evidence that nonheme oxoiron(V) species are observable (see Table 3), and several are powerful enough to carry out the oxidation reactions studied here.54,64,70 The latter point leads us to favor 5a* as the likely key oxidant of the catalytic reaction, so the following discussion focuses on 5a*.
Figure 11.
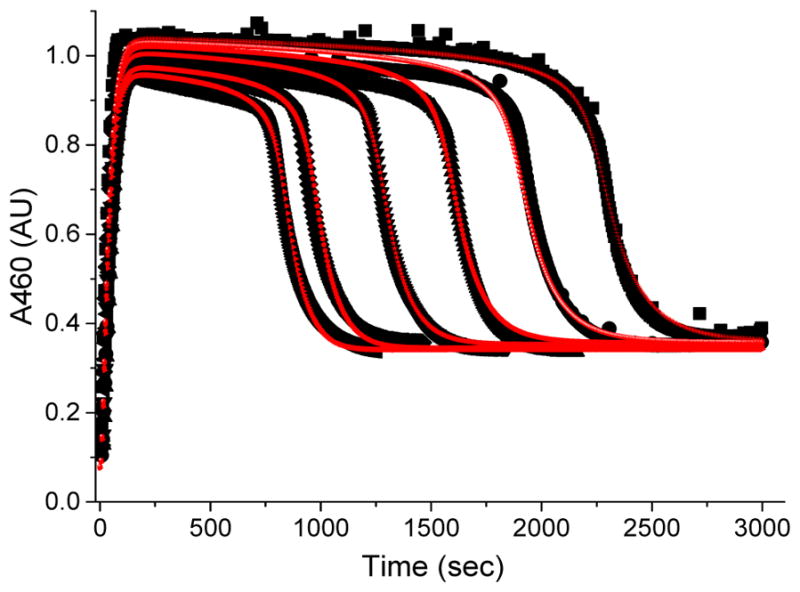
Black traces represent kinetic time courses of 3a* (460 nm) generated by adding 20 equiv. of H2O2 (90 % v/v) to a 0.5 mM solution of 1a* in CH3CN −40 °C in the presence of 200 equiv. of AcOH and various equivalents of 1-octene. The red traces indicate fits derived from numerical simulation of the experimental data according to the model presented in Scheme 2. The traces from right to left correspond to 0, 50, 100, 200, 400 and 600 equiv. of 1-octene added.
Table 4.
Rate constants obtained from the simulation of the time trace of 3a* (460 nm) in the presence of varying amounts of 1-octene at −40 °C.
| Rate constants | Best fit | Lower bounda | Upper bounda | Experimentally measured | ref |
|---|---|---|---|---|---|
| k1 (M−1 s−1) | 7.6 | 5.5 | 14 | 12 for (PyNMe3)FeII at −35 °C 35 for (BPMEN)FeII at 20 °C 82 for (S,S-PDP)FeII at 20 °C |
54 48 48 |
| k−1 (s−1) | 0 | 0 | 0 | 0 | |
| k2 (M−1 s−1) | 640 | 507 | 800 | ||
| k−2 (s−1) | 0 | 0 | 0.1 | ||
| k3 (M−1 s−1) | 11 | 9 | 920 | ||
| k−3 (s−1) | 0 | 0 | 0.1 | ||
| k4 (s−1) | 0.137 | 0.128 | 0.16 | 0.28 for 2a | |
| k−4 (s−1) | 0 | 0 | 0.0090 | 0 | |
| k5 (s−1) | 0.057 | 0.050 | 0.058 | ||
| k−5 (s−1) | 0.016 | 0.015 | 0.017 | 0.01 for 3a* | |
| k6 (s−1) | 0.047 | 0.045 | 0.047 | ||
| k−6 (s−1) | 0.0 | 0.0 | 0.0 | 0 | |
| k7 (s−1) | 0.28 | 0.27 | 0.29 | ||
| k−7 (s−1) | 0.45 | 0.41 | 0.52 | ||
| k8 (M−1 s−1) | 0.77 | 0.70 | 0.92 | 0.032 at −85 °C (~ 0.77 at −40 °C)b | |
| k−8 (s−1) | 0.0 | 0.0 | 0.0 | ||
| k9 (s−1) | 0.012 | 0.0090 | 0.015 | ||
| k−9 (s−1) | 0.0 | 0.0 | 0.00060 |
The lower and upper bounds for each rate constant depict the ranges in which each fitted parameter can vary independently while still allowing an acceptably good fit. Note that the rate constant k3 is not constrained by the data as a large variation in its value can fit the available data.
This extrapolation was made, assuming a 2-fold acceleration in the rate constant for every 10-degree rise in temperature.
The first step in the catalytic cycle depicted in Scheme 2 (k1) involves oxidation of the iron(II) precursor 1a* by H2O2 to afford the one-electron-oxidized (L)FeIII–OH species. The facile conversion of FeII catalysts supported by tetradentate N4 ligands to their catalytically active FeIII forms in the presence of peroxo-based oxidants such as H2O2, AcOOH and mCPBA has been demonstrated numerous times.22, 23, 25, 51, 54 The fitted rate constant for this step is indeed in the range reported for the conversion of 1b into (PyNMe3)FeIII–OH, as well as the conversion of iron(II) complexes supported by tetradentate N4 ligands BPMEN and PDP to the corresponding FeIII–OOH species, assuming that the following step is relatively fast (see Table 4). The subsequent generation of the FeIII–OOH complex 2a* (k2 and k−2) requires an additional equivalent of H2O2.22, 23, 25, 54, 75, 76 This step essentially entails substitution of an –OH for an–OOH ligand via an acid-base type of transformation and is significantly faster than the previous step.
The next step involves the binding of AcOH to the available solvent site on 2a* to form an AcOH adduct of 2a*(AcOH) (k3 and k−3), which then decays to intermediate 4a* (k4 and k−4). The experimentally determined unimolecular 2a decay rate constant of 0.28 s−1 under saturating AcOH concentrations (Figure 10) is not too different from the value of 0.137 s−1 obtained for the decay of an AcOH adduct of 2a* to form 4a* via numerical simulation (Table 4). This is the step that exhibits an AcOH/AcOD KIE of 1.7 in Table 2. On the basis of kinetic and spectroscopic studies, intermediate 4a is shown to possess an optical chromophore at 370 nm. This species has been formulated to be FeIV(O)(•OAc) based on the nature of its decay products (discussed in the next paragraph) and the DFT calculations by Wang and Shaik.74
Intermediate 4a* can be converted into three distinct species. The first (k6) involves irreversible decarboxylation of the carboxyl radical to afford CO2, an alkyl radical and FeIV(O). This pathway is required to account for the finite steady state lifetime of species 3a* at the end of the multiple turnover cycle in the absence of substrate. The existence of this pathway is supported by the formation of [(TPA)FeIV(O)(NCMe)]2+ and benzaldehyde in respective 70% and 90% yields relative to 1a when acetic acid is replaced by phenylacetic acid,77 where the benzaldehyde product arises from trapping of the relatively stable benzyl radical with dioxygen.34, 78, 79 On the other hand, when acetic acid is substituted by perfluorobenzoic acid, formation of C6F5OH is observed, which derives from the more reactive aryl radical undergoing rebound onto the nascent FeIV(O) species, resulting in catalytic C6F5OH formation.34, 78, 79 The introduction of olefins into either reaction mixture was shown to decrease the yields of both radical-derived products,34, 79 indicating that oxidative decarboxylation and olefin epoxidation are competitive processes. Importantly, these results support the involvement of an FeIV(O)(•OAc) species (tentatively assigned as 4 in Scheme 2) in the catalytic cycle that is reversibly connected to the species responsible for olefin oxidation.
The second decay pathway for the FeIV(O)(•OAc) species (k7 and k−7) involves valence tautomerization to the FeV(O)(OAc) electromer 5a*,50 the forward rate constant k7 being five-fold larger than k6 in the numerical simulation (Table 4). Satisfactory fits were obtained only if this step is reversible. Complex 5a exhibits an EPR signal with g-values of 2.07, 2.01 and 1.96, which can be associated with a visible chromophore with features at 447, 578 and 730 nm, (Figure 7). The EPR g-values and 57Fe-hyperfine splitting for 5a and 5a* are identical to each other.51, 52, 54, 73 Importantly, 5a* was shown by Talsi and co-workers to oxidize 1-octene with a rate constant of 0.032 M−1s−1 at −85 °C,51 which is consistent with the 20-fold larger fitted second order rate constant of 0.77 M−1s−1 we obtained at −40 °C (Table 4). The congruence of these two rate constants supports the notion that 5a* is the key oxidant in the 1a*/H2O2/AcOH reaction mixture.
The third decay pathway (k5 and k−5) involves an O–O bond formation to re-generate the FeIII–OOAc species 3a*, which occurs at a comparable rate as the step associated with k6 (Table 4).74 The fitting analysis of the kinetic data requires reversible interconversion between the FeIV(O)(•OAc) complex and the FeIII–OOAc species, in agreement with previous DFT calculations.50, 74 Indeed, the reverse rate constant (k−5) of 0.016 s−1 found by numerical simulation approaches the observed rate constant of 0.010(1) s−1 obtained by exponential fitting of the A460 time-trace associated with 3a* decay upon depletion of H2O2 at the end of the multiple turnover reaction. The model suggests that the decay time course of species 3a* when H2O2 is depleted will be affected not only by k−5, but also by k5, k6, k7, k−7 and k8. This is true because all of these rate constants, as well as the substrate concentration, affect the rate of reformation of 3a* as it is decaying. The time course appears to be exponential because all of the rate constants involved are first order or pseudo-first order under the conditions of the experiment. As it turns out, the relative magnitudes of these rate constants cause the decay of 3a* to follow approximately the same time course over a wide range of substrate concentrations, making the experimental rate constants appear to be invariant (Figure 2). The exponential fit of the composite decay time course gives a slightly less than the true value for k−5. For species 3a, this observed decay rate constant, which is also a composite of the rate constants k−5, k5, k6, k7, k−7 and k8 initially responds to changes in substrate concentration but then becomes invariant at higher concentrations (Figure 3).
The decay of the FeIII–OOAc complex therefore involves a dynamic equilibrium among the FeIII–OOAc (3), FeIV(O)(•OAc) (4) and FeV(O)(OAc) (5) components of the catalytic troika, as depicted in Scheme 2. The existence of this equilibrium is additionally supported by monitoring the steady state yield of the FeIII–OOAc intermediate 3a* as a function of substrate concentration. In particular, the maximum yield of the FeIII–OOAc species is dictated by the relative rate constants for the formation and decay of FeIII–OOAc (k5 and k−5) and FeV(O)(OAc) (k7 and k−7) from the FeIV(O)(•OAc) species, as well as the rate constant of substrate oxidation by FeV(O)(OAc) (k8). According to this model, the accumulation of 3a* should be sensitive to the rate of substrate oxidation by 5a*. Thus, varying the concentration of substrate and its C–H bond strength should alter this rate. Indeed, at high concentrations of an easily oxidizable substrate like 1,4-cyclohexadiene with a C–H bond dissociation energy of 77 kcal/mol, the maximum yield of 3a* under steady state conditions was observed to decrease by ~ 50 % (Figure 12). Numerical simulation of the time course of 3a* as a function of [cyclohexadiene] using the model shown in Scheme 2 affords a C–H bond cleavage rate of 88 M−1s−1 (Figure S11), which is two orders of magnitude larger than the second order rate constant for 1-octene oxidation (0.7 M−1s−1). A decrease in the maximum yield of 3a* thus occurs because the decay rate constant of the FeV(O)(OAc) species becomes much larger in magnitude than its reverse rate constant of conversion to the FeIV(O)(•OAc) species at higher concentrations of the substrate, in effect shifting the equilibrium away from FeIII–OOAc in Scheme 2. Similarly, in the 1a/H2O2/AcOH/1-octene catalytic system, the maximum yield of 3a under steady state conditions decreases as the concentration of 1-octene is increased (Figure S12). Thus, the formation of the FeIII–OOAc species 3 and substrate oxidation by the FeV(O)(OAc) electromer must be competitive, which in turn indicates that these species are reversibly connected.
Figure 12.
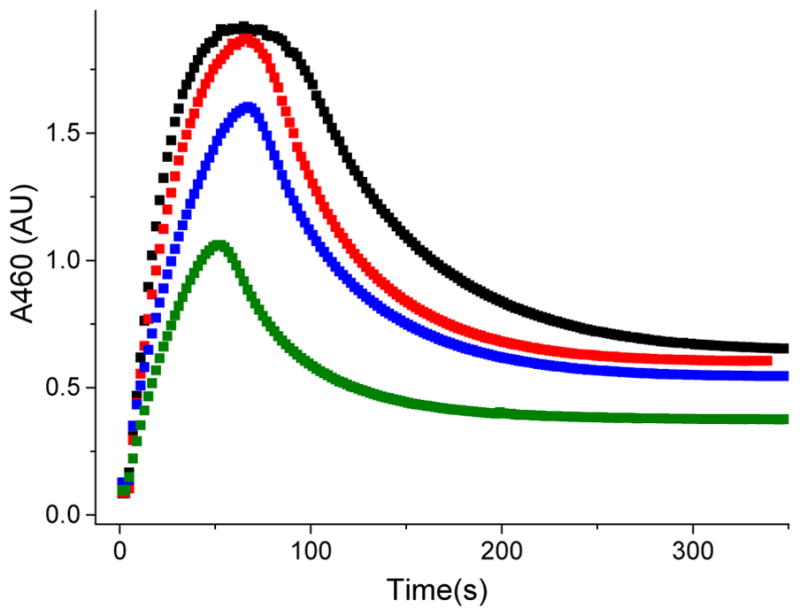
Kinetic trace for the formation and decay of 3a* in the reaction between 1a* and H2O2 (10 equiv.) in the presence of AcOH (200 equiv.) and 50 (black), 150 (red), 500 (blue), and 1000 (green) equivalents of 1,4-cyclohexadiene, demonstrating that the maximum yield of 3a* depends on the amount of 1,4-cyclohexadiene present in solution.
The dynamic equilibrium among the FeIII–OOAc, FeV(O)(OAc), and FeIV(O)(•OAc) species is responsible for the curious kinetic evolution of the FeIII–OOAc complex (Figures 2, 3, 4 and 11), where the length of the steady state phase responds to the nature and concentration of the substrate. In particular, as substrate oxidation by the FeV(O)(OAc) species is the predominant contributor to the rate-determining step of the entire reaction under the conditions studied here (see Figure 5b), the rate of this step controls the consumption rate of the H2O2 reagent, thereby dictating the duration of each turnover cycle. With a fixed amount of H2O2, a faster single turnover cycle reduces the duration of the overall multiple turnover reaction, in effect decreasing the duration of the steady-state accumulation of FeIII–OOAc that is in equilibrium with the FeV(O)(OAc) oxidant. As a consequence, the inverse length of the steady state phase of 3 is proportional to the rate constant for substrate oxidation. The inverse of the duration of the steady state phase thus becomes a surrogate for k(substrate oxidation), and a linear plot of ln(surrogate k) vs BDE can be observed (Figure 4b) that essentially corresponds to the Bell–Evans–Polanyi plots commonly used to describe the C–H bond cleavage reactivity of a variety of high-valent iron oxidants.57–59, 80 Species 3 effectively reaches an equilibrium with 4, which slows the reaction by decreasing the concentration of the key oxidant 5 in solution, but has little effect on the reaction flux after this equilibrium is established.
The formation of the diiron(III) species 7 is included in the chemical model as it helps to account for the slight loss in the steady state accumulation of 3 during the course of the multiple turnover reaction. It also explains the residual absorbance at 460 nm at the end of the reaction. Indeed ESI-MS analysis of the reaction mixture at the end of the reaction shows the major decay product to be [(TPA*)2FeIII2(μ-O)(μ-OAc)]3+ (Figure S13), which possesses an absorption maximum at ~460 nm81, 82 and has been shown to be catalytically inactive towards the substrates tested in this study.34, 83
The numerical simulation results on 1-octene oxidation can also be used to obtain insights into the oxidation rates of other substrates. For example, the longer steady state phase observed for the oxidation of 250 mM cyclohexane in Figure 2b can be reproduced assuming a 1-octene concentration of 25 mM (Figure S10), suggesting that the oxidation rate for cyclohexane is about an order of magnitude slower than that of 1-octene. Indeed comparable rate differences for the oxidation of 1-octene versus cyclohexane have been found for two other high-valent iron-oxo oxidants. The high-spin [FeIV(O)(TQA] complex oxidizes 1-octene 16-fold faster than cyclohexane at −40 °C,59 while the FeV(O) oxidant generated from Fe(PyNMe3) and AcOOH is about 40-fold faster in the oxidation of 1-octene than cyclohexane.54.73 Furthermore, a competitive oxidation experiment suggested by a reviewer of equimolar amounts of tert-butyl acrylate and cyclohexane shows a 2:1 ratio of acrylate oxidation products over cyclohexane oxidation products, confirming that the rate constants for oxidation of tert-butyl acrylate and cyclohexane are comparable within the error of these measurements, consistent with the data in Figure 2b.
We have attempted to include the minor species 6 in the kinetic modelling of Scheme 2. The numerical simulations indicate that placing 6a* at any of several positions in the pathway in equilibrium with species 3a*, 4a* or 5a* had minimal effect on the quality of the simulation shown in Figure 11. Rate constants of other steps in the reaction (Table 4) were nearly unaltered. Given the low yield of 6a* (4%), the lack of information regarding its electronic structure, its lack of reactivity with substrates, as well as uncertainty of its position in the reaction pathway, we believe that addition of 6a* to Scheme 2 would be too speculative. None of the major findings of this study are impacted by omission of species 6a* from Scheme 2.
SUMMARY AND PERSPECTIVES
Our cumulative kinetic and spectroscopic studies have facilitated a determination of the roles that the g2.7 and the g2.07 species play in the FeII/H2O2/AcOH catalytic system. These results show that the g2.7 species 3a and 3a* do not oxidize substrates directly, but are instead off-pathway in the catalytic transformations. The relevance of the g2.7 species in catalytic reactions should therefore not be over-emphasized. The g2.07 subset on the other hand has been demonstrated to be the key oxidizing species in the catalytic reaction. This species exhibits EPR g-values at ca. 2.07, 2.01 and 1.96, which are insensitive to the electronic properties of the supporting ligands, as well as visible spectral features at 447, 578 and 730 nm. These spectral features resemble those of better characterized FeV(O) complexes 5b (L = PyNMe3) and [(TMC)FeV(O)(NC(O)tBu)]+. The similarity of the spectroscopic properties of 5a and 5a* with those of 5b and [(TMC)FeV(O)(NC(O)tBu)]+ favor the assignment of 5a and 5a* as FeV(O)(OAc) species. Importantly, these g2.07 species 5 have been demonstrated to be in a reversible equilibrium with the FeIII–OOAc complexes, 3. The equilibrium is shown to be perturbed by the electronic properties of the supporting tetradentate ligand and the steric properties of carboxylic acids.52 The previously reported reactivity differences between the FeIII–OOAc complexes 3a and 3a* can thus be attributed to the existence of the equilibrium between 3 and 5.44, 50 In particular, the linear dependence of the rate constant for 3a decay as a function of substrate concentration (low concentration range) does not arise from a direct reaction with substrate, but instead arises from the enhancement in the rate of 5 decay. The apparent rate constant for 3 decay is a composite of multiple rate constants as a result of the equilibrium between species 3, 4 and 5.
The current study shows that the g2.7 and g2.07 EPR species resulting from the reaction of H2O2 and AcOH with 1a and 1a* differ in both structure and reactivity. Observation of 57Fe- hyperfine splitting on only one of the three g-values for these species formed by using 57Fe-enriched catalysts indicates that neither is the FeIV(O)(•OAc) species favored by others.51, 52 This hyperfine splitting pattern is instead consistent with either a low-spin FeIII or FeV assignment. Accordingly, spectroscopic analysis and comparisons with characterized model complexes54, 61 suggest that the g2.7 species correlated with intermediates 3a and 3a* is a low-spin FeIII–OOAc species, while the g2.07 intermediate correlated with intermediates 5a and 5a* is a FeV(O)(OAc) species. Our kinetic analysis of the evolution of the 3a* intermediate (Figures 2b, 6 and 11) reveals that 3 and 5 must exist in a dynamic equilibrium that is modulated by the nature of the supporting ligand. Moreover, it is shown that the true reactive species of this system, and probably of all similar carboxylic-acid-modulated mononuclear iron catalyst systems, is the high-valent FeV(O) intermediate, 5.
Similar to the synthetic transformations discussed here, the role of peroxoiron(III) and oxoiron(V) intermediates in C–H and C=C oxidations mediated by the biological Rieske oxygenases are not yet clear.5 As mentioned previously, side-on bound O2 adducts of enzyme-substrate complexes of naphthalene 1,2-dioxygenase and carbazole 1,9a-dioxygenases have been trapped in crystals.8, 9 These adducts are speculated to correspond to the (hydro)peroxoiron(III) intermediate observed in the “peroxide shunt” reaction of fully oxidized benzoate 1,2-dioxygenase, which is capable of producing one turnover of the expected cis-diol product.10 It is unclear whether the peroxoiron(III) intermediate is responsible for oxidizing the substrates or if this species undergoes O–O bond breaking to afford an FeV(O)(OH) oxidant. Experimental evidence, however exists that support the model of an FeV(O) oxidant in these enzymes based upon the observed incorporation of 18O from H218O into the oxidation products of indan (68 % into 1-indanol product of monooxygenase chemistry) by toluene dioxygenase29 and naphthalene (3 % into cis-1,2-dihydrodiol product of dioxygenase chemistry) by naphthalene dioxygenase during a peroxide shunt reaction.30 These results show that an FeV(O) species similar to 5 in our study could plausibly act as the key oxidant in the chemistry of Rieske oxygenases. The findings presented here, therefore, have significance for the design of catalysis to carry out regio- and stereo-specific reactions, as well as for the goal of understanding the mechanisms of the remarkably versatile oxidants formed by nature’s most potent oxygenases.
Supplementary Material
Acknowledgments
Financial support for this work was provided by grants from the Department of Energy, Office of Basic Energy Sciences (DE-FG02-03ER15455 to L.Q.), the National Science Foundation (CHE-1361773 and CHE-1665391 to L.Q.), and National Institutes of Health (GM40466 and GM100943 to J.D.L.)
Footnotes
Notes
The authors declare no competing financial interest.
The Supporting Information is available free of charge on the ACS Publications website at DOI: xxxxxx. The supporting information provides further details on the UV–vis and EPR experiments for the generation and reactivity of 2, 3 and 5.
References
- 1.Sono M, Roach MP, Coulter ED, Dawson JH. Chem Rev. 1996;96:2841–2887. doi: 10.1021/cr9500500. [DOI] [PubMed] [Google Scholar]
- 2.Solomon EI, Brunold TC, Davis MI, Kemsley JN, Lee SK, Lehnert N, Neese F, Skulan AJ, Yang YS, Zhou J. Chem Rev. 2000;100:235–349. doi: 10.1021/cr9900275. [DOI] [PubMed] [Google Scholar]
- 3.Costas M, Mehn MP, Jensen MP, Que L., Jr Chem Rev. 2004;104:939–986. doi: 10.1021/cr020628n. [DOI] [PubMed] [Google Scholar]
- 4.Kovaleva EG, Lipscomb JD. Nature Chem Biol. 2008;4:186–193. doi: 10.1038/nchembio.71. [DOI] [PMC free article] [PubMed] [Google Scholar]
- 5.Barry SM, Challis GL. ACS Catal. 2013;3:2362–2370. doi: 10.1021/cs400087p. [DOI] [PMC free article] [PubMed] [Google Scholar]
- 6.Kal S, Que L. J Biol Inorg Chem. 2017;22:339–365. doi: 10.1007/s00775-016-1431-2. [DOI] [PubMed] [Google Scholar]
- 7.Ferraro DJ, Gakhar L, Ramaswamy S. Biochem Biophys Res Commun. 2005;338:175–190. doi: 10.1016/j.bbrc.2005.08.222. [DOI] [PubMed] [Google Scholar]
- 8.Karlsson A, Parales JV, Parales RE, Gibson DT, Eklund H, Ramaswamy S. Science. 2003;299:1039–1042. doi: 10.1126/science.1078020. [DOI] [PubMed] [Google Scholar]
- 9.Ashikawa Y, Fujimoto Z, Usami Y, Inoue K, Noguchi H, Yamane H, Nojiri H. BMC Struct Bio. 2012;12:15. doi: 10.1186/1472-6807-12-15. [DOI] [PMC free article] [PubMed] [Google Scholar]
- 10.Neibergall MB, Stubna A, Mekmouche Y, Münck E, Lipscomb JD. Biochemistry. 2007;46:8004–8016. doi: 10.1021/bi700120j. [DOI] [PMC free article] [PubMed] [Google Scholar]
- 11.Rivard BS, Rogers MS, Marell DJ, Neibergall MB, Chakrabarty S, Cramer CJ, Lipscomb JD. Biochemistry. 2015;54:4652–4664. doi: 10.1021/acs.biochem.5b00573. [DOI] [PMC free article] [PubMed] [Google Scholar]
- 12.Que L, Jr, Tolman WB. Nature. 2008;455:333–340. doi: 10.1038/nature07371. [DOI] [PubMed] [Google Scholar]
- 13.Sun CL, Li BJ, Shi ZJ. Chem Rev. 2011;111:1293–1314. doi: 10.1021/cr100198w. [DOI] [PubMed] [Google Scholar]
- 14.Talsi EP, Bryliakov KP. Coord Chem Rev. 2012;256:1418–1434. [Google Scholar]
- 15.Oloo WN, Que L., Jr . Hydrocarbon Oxidations Catalyzed by Bio-Inspired Nonheme Iron and Copper Catalysts. In: Reedijk J, Poeppelmeier K, editors. Comprehensive Inorganic Chemistry II. Vol. 6. Elsevier; Oxford: 2013. pp. 763–778. [Google Scholar]
- 16.Gelalcha FG. Adv Synth Catal. 2014;356:261–299. [Google Scholar]
- 17.Oloo WN, Que L., Jr Acc Chem Res. 2015;48:2612–2621. doi: 10.1021/acs.accounts.5b00053. [DOI] [PubMed] [Google Scholar]
- 18.Cusso O, Ribas X, Costas M. Chem Commun. 2015;51:14285–98. doi: 10.1039/c5cc05576h. [DOI] [PubMed] [Google Scholar]
- 19.Wolfe MD, Lipscomb JD. J Biol Chem. 2003;278:829–835. doi: 10.1074/jbc.M209604200. [DOI] [PubMed] [Google Scholar]
- 20.Sobolev AP, Babushkin DE, Talsi EP. Mendeleev Commun. 1996:33–34. [Google Scholar]
- 21.Kim C, Chen K, Kim J, Que L., Jr J Am Chem Soc. 1997;119:5964–5965. [Google Scholar]
- 22.Chen K, Que L., Jr J Am Chem Soc. 2001;123:6327–6337. doi: 10.1021/ja010310x. [DOI] [PubMed] [Google Scholar]
- 23.Chen K, Costas M, Kim J, Tipton AK, Que L., Jr J Am Chem Soc. 2002;124:3026–3035. doi: 10.1021/ja0120025. [DOI] [PubMed] [Google Scholar]
- 24.Mairata i Payeras A, Ho RYN, Fujita M, Que L., Jr Chem Eur J. 2004;10:4944–4953. doi: 10.1002/chem.200400480. [DOI] [PubMed] [Google Scholar]
- 25.Makhlynets OV, Rybak-Akimova EV. Chem Eur J. 2010;16:13995–14006. doi: 10.1002/chem.201002577. [DOI] [PubMed] [Google Scholar]
- 26.Hitomi Y, Arakawa K, Funabiki T, Kodera M. Angew Chem Int Ed. 2012;51:3448–3452. doi: 10.1002/anie.201108933. [DOI] [PubMed] [Google Scholar]
- 27.Zang C, Liu Y, Xu ZJ, Tse CW, Guan X, Wei J, Huang JS, Che CM. Angew Chem Int Ed. 2016;55:10253–10257. doi: 10.1002/anie.201603410. [DOI] [PubMed] [Google Scholar]
- 28.Oloo WN, Fielding AJ, Que L., Jr J Am Chem Soc. 2013;135:6438–6441. doi: 10.1021/ja402759c. [DOI] [PubMed] [Google Scholar]
- 29.Wackett LP, Kwart LD, Gibson DT. Biochemistry. 1988;27:1360–1367. doi: 10.1021/bi00404a041. [DOI] [PubMed] [Google Scholar]
- 30.Wolfe MD, Lipscomb JD. J Biol Chem. 2003;278:829–835. doi: 10.1074/jbc.M209604200. [DOI] [PubMed] [Google Scholar]
- 31.Company A, Gomez L, Güell M, Ribas X, Luis JM, Que L, Jr, Costas M. J Am Chem Soc. 2007;129:15766–15767. doi: 10.1021/ja077761n. [DOI] [PubMed] [Google Scholar]
- 32.Prat I, Mathieson JS, Güell M, Ribas X, Luis JM, Cronin L, Costas M. Nature Chem. 2011;3:788–793. doi: 10.1038/nchem.1132. [DOI] [PubMed] [Google Scholar]
- 33.White MC, Doyle AG, Jacobsen EN. J Am Chem Soc. 2001;123:7194–7195. doi: 10.1021/ja015884g. [DOI] [PubMed] [Google Scholar]
- 34.Mas-Ballesté R, Que L., Jr J Am Chem Soc. 2007;129:15964–15972. doi: 10.1021/ja075115i. [DOI] [PubMed] [Google Scholar]
- 35.Chen MS, White MC. Science. 2007;318:783–787. doi: 10.1126/science.1148597. [DOI] [PubMed] [Google Scholar]
- 36.Gomez L, Garcia-Bosch I, Company A, Benet-Buchholz J, Polo A, Sala X, Ribas X, Costas M. Angew Chem Int Ed. 2009;48:5720–5723. doi: 10.1002/anie.200901865. [DOI] [PubMed] [Google Scholar]
- 37.Chen MS, White MC. Science. 2010;327:566–571. doi: 10.1126/science.1183602. [DOI] [PubMed] [Google Scholar]
- 38.White MC. Science. 2012;335:807–809. doi: 10.1126/science.1207661. [DOI] [PubMed] [Google Scholar]
- 39.Wu M, Miao CX, Wang S, Hu X, Xia C, Kühn FE, Sun W. Adv Synth Catal. 2011;353:3014–3022. [Google Scholar]
- 40.Lyakin OY, Ottenbacher RV, Bryliakov KP, Talsi EP. ACS Catal. 2012;2:1196–1202. [Google Scholar]
- 41.Cussó O, Garcia-Bosch I, Ribas X, Lloret-Fillol J, Costas M. J Am Chem Soc. 2013;135:14871–14878. doi: 10.1021/ja4078446. [DOI] [PubMed] [Google Scholar]
- 42.Wang B, Wang S, Xia C, Sun W. Chem Eur J. 2012;18:7332–7335. doi: 10.1002/chem.201200992. [DOI] [PubMed] [Google Scholar]
- 43.Cussó O, Ribas X, Lloret-Fillol J, Costas M. Angew Chem Int Ed. 2015;54:2729–2733. doi: 10.1002/anie.201410557. [DOI] [PubMed] [Google Scholar]
- 44.Lyakin OY, Bryliakov KP, Britovsek GJP, Talsi EP. J Am Chem Soc. 2009;131:10798–10799. doi: 10.1021/ja902659c. [DOI] [PubMed] [Google Scholar]
- 45.Lyakin OY, Bryliakov KP, Talsi EP. Inorg Chem. 2011;50:5526–5538. doi: 10.1021/ic200088e. [DOI] [PubMed] [Google Scholar]
- 46.Guisado-Barrios G, Zhang Y, Harkins AM, Richens DT. Inorg Chem Commun. 2012;20:81–85. [Google Scholar]
- 47.Lyakin OY, Prat I, Bryliakov KP, Costas M, Talsi EP. Cat Commun. 2012;29:105–108. [Google Scholar]
- 48.Makhlynets OV, Oloo WN, Moroz YS, Belaya IG, Palluccio TD, Filatov AS, Müller P, Cranswick MA, Que L, Jr, Rybak-Akimova EV. Chem Commun. 2014;50:645–648. doi: 10.1039/c3cc47632d. [DOI] [PubMed] [Google Scholar]
- 49.Bryliakov KP, Talsi EP. Coord Chem Rev. 2014;276:73–96. [Google Scholar]
- 50.Oloo WN, Meier KK, Wang Y, Shaik S, Münck E, Que L., Jr Nat Commun. 2014;5:4041–4049. doi: 10.1038/ncomms4046. [DOI] [PubMed] [Google Scholar]
- 51.Lyakin OY, Zima AM, Samsonenko DG, Bryliakov KP, Talsi EP. ACS Catal. 2015;5:2702–2707. [Google Scholar]
- 52.Zima AM, Lyakin OY, Ottenbacher RV, Bryliakov KP, Talsi EP. ACS Catal. 2016;6:5399–5404. [Google Scholar]
- 53.Zima AM, Lyakin OY, Ottenbacher RV, Bryliakov KP, Talsi EP. ACS Catal. 2017;7:60–69. [Google Scholar]
- 54.Serrano-Plana J, Oloo WN, Acosta-Rueda L, Meier KK, Verdejo B, Garcia-Espana E, Basallote MG, Münck E, Que L, Jr, Company A, Costas M. J Am Chem Soc. 2015;137:15833–15842. doi: 10.1021/jacs.5b09904. [DOI] [PubMed] [Google Scholar]
- 55.Harman DG, Ramachandran A, Gracanin M, Blanksby SJ. J Org Chem. 2006;71:7996–8005. doi: 10.1021/jo060730a. [DOI] [PubMed] [Google Scholar]
- 56.Luo Y-R. Comprehensive Handbook of Chemical Bond Energies. Taylor & Francis; Boca Raton: 2007. [Google Scholar]
- 57.Kaizer J, Klinker EJ, Oh NY, Rohde JU, Song WJ, Stubna A, Kim J, Münck E, Nam W, Que L., Jr J Am Chem Soc. 2004;126:472–473. doi: 10.1021/ja037288n. [DOI] [PubMed] [Google Scholar]
- 58.Mayer JM. Acc Chem Res. 2011;44:36–46. doi: 10.1021/ar100093z. [DOI] [PMC free article] [PubMed] [Google Scholar]
- 59.Biswas AN, Puri M, Meier KK, Oloo WN, Rohde GT, Bominaar EL, Münck E, Que L. J Am Chem Soc. 2015;137:2428–2431. doi: 10.1021/ja511757j. [DOI] [PubMed] [Google Scholar]
- 60.Fujita M, Que L., Jr Adv Synth Catal. 2004;346:190–194. [Google Scholar]
- 61.Van Heuvelen KM, Fiedler AT, Shan X, De Hont RF, Meier KK, Bominaar EL, Münck E, Que JL. Proc Natl Acad Sci USA. 2012;109:11933–11938. doi: 10.1073/pnas.1206457109. [DOI] [PMC free article] [PubMed] [Google Scholar]
- 62.Schulz CE, Rutter R, Sage JT, Debrunner PG, Hager LP. Biochemistry. 1984;23:4743–4754. doi: 10.1021/bi00315a033. [DOI] [PubMed] [Google Scholar]
- 63.Rittle J, Green MT. Science. 2010;330:933–937. doi: 10.1126/science.1193478. [DOI] [PubMed] [Google Scholar]
- 64.Tiago de Oliveira F, Chanda A, Banerjee D, Shan X, Mondal S, Que L, Jr, Bominaar EL, Münck E, Collins TJ. Science. 2007;315:835–838. doi: 10.1126/science.1133417. [DOI] [PubMed] [Google Scholar]
- 65.Roelfes G, Vrajmasu V, Chen K, Ho RYN, Rohde JU, Zondervan C, la Crois RM, Schudde EP, Lutz M, Spek AL, Hage R, Feringa BL, Münck E, Que L., Jr Inorg Chem. 2003;42:2639–2653. doi: 10.1021/ic034065p. [DOI] [PubMed] [Google Scholar]
- 66.Taylor CPS. BBA Protein Struct. 1977;491:137–148. [Google Scholar]
- 67.McGarvey BR. Coord Chem Rev. 1998;170:75–92. [Google Scholar]
- 68.Mas-Ballesté R, Fujita M, Que L., Jr Dalton Trans. 2008:1828–1830. doi: 10.1039/b802587h. [DOI] [PubMed] [Google Scholar]
- 69.Iyer SR, Javadi MM, Feng Y, Hyun MY, Oloo WN, Kim C, Que L., Jr Chem Commun. 2014;50:13777–13780. doi: 10.1039/c4cc06164k. [DOI] [PubMed] [Google Scholar]
- 70.Tse CW, Chow TWS, Guo Z, Lee HK, Huang JS, Che CM. Angew Chem Int Ed. 2014;53:798–803. doi: 10.1002/anie.201305153. [DOI] [PubMed] [Google Scholar]
- 71.McGown AJ, Kerber WD, Fujii H, Goldberg DP. J Am Chem Soc. 2009;131:8040–8048. doi: 10.1021/ja809183z. [DOI] [PubMed] [Google Scholar]
- 72.Rittle J, Green MT. Science. 2010;330:933–937. doi: 10.1126/science.1193478. [DOI] [PubMed] [Google Scholar]
- 73.Serrano-Plana J, Aguinaco A, Belda R, Garcia-Espana E, Basallote MG, Company A, Costas M. Angew Chem Int Ed. 2016;55:6310–6314. doi: 10.1002/anie.201601396. [DOI] [PubMed] [Google Scholar]
- 74.Wang Y, Janardanan D, Usharani D, Han K, Que L, Jr, Shaik S. ACS Catal. 2013;3:1334–1341. [Google Scholar]
- 75.Sun X, Kryatov SV, Rybak-Akimova EV. Dalton Trans. 2013;42:4427–4435. doi: 10.1039/c2dt32599c. [DOI] [PubMed] [Google Scholar]
- 76.Padamati SK, Draksharapu A, Unjaroen D, Browne WR. Inorg Chem. 2016;55:4211–4222. doi: 10.1021/acs.inorgchem.5b02976. [DOI] [PubMed] [Google Scholar]
- 77.Benzaldehyde is also formed in 90 % yield relative to 1a*
- 78.Makhlynets OV, Das P, Taktak S, Flook M, Mas-Ballesté R, Rybak-Akimova EV, Que L., Jr Chem Eur J. 2009;15:13171–13180. doi: 10.1002/chem.200901296. [DOI] [PubMed] [Google Scholar]
- 79.Das P, Que L., Jr Inorg Chem. 2010;49:9479–9485. doi: 10.1021/ic101144s. [DOI] [PubMed] [Google Scholar]
- 80.Kleespies ST, Oloo WN, Mukherjee A, Que L. Inorg Chem. 2015;54:5053–5064. doi: 10.1021/ic502786y. [DOI] [PubMed] [Google Scholar]
- 81.Yan S, Cox DD, Pearce LL, Juarez-Garcia C, Que L, Jr, Zhang JH, O’Connor CJ. Inorg Chem. 1989;28:2507–2509. [Google Scholar]
- 82.Kurtz DM., Jr Chem Rev. 1990;90:585–606. [Google Scholar]
- 83.Taktak S, Kryatov SV, Haas TE, Rybak-Akimova EV. J Mol Catal A: Chem. 2006;259:24–34. [Google Scholar]
Associated Data
This section collects any data citations, data availability statements, or supplementary materials included in this article.


