. 2017 Dec 22;6:e31101. doi: 10.7554/eLife.31101

Figure 5. Paxillin is required for endocytosis promoted by a soft surface.

(A) Paxillin knockdown suppresses the endocytic activity of neurons grown on 0.1 kPa gels. Representative time-lapse images of FM4-64 uptake in 3-DIV neurons on substrates of varying elasticity. Hippocampal neurons on 0.1 kPa gels were transduced with lentiviral particles harboring an shRNA-resistant construct (‘PXN-R’) and/or constructs harboring scrambled control or paxillin (‘PXN shRNA C + D’) shRNA at 5 hr after cell plating. Dashed circles surround the region of interest (ROI) in quantitative FM4-64 measurements. Bar: 20 μm. (B) Similar to A, except constructs encoding GFP fusions of wild-type paxillin (‘PXNWT-GFP’; B1 and B2) or the corresponding LIM domain deletion mutant (‘PXNLD1-3-GFP’; B3) were used for lentiviral transduction. Asterisk: non-transduced neighboring cells. Arrows: neurons expressing GFP-tagged paxillin proteins. Bar: 20 μm. (C–E) Quantitative measurements of cumulative FM4-64 intensity (±SEM, n > 3 independent experiments, 7–12 cells for each set of experiments; *p<0.05; **p<0.001; ***p<0.0001; compared to control groups; multiple t tests), all from experiments similar to those described in A and B. Note that ectopic expression of wild-type paxillin, but not PXNLD1-3, restored rapid endocytic FM4-64 uptake on 20 kPa stiff gels.

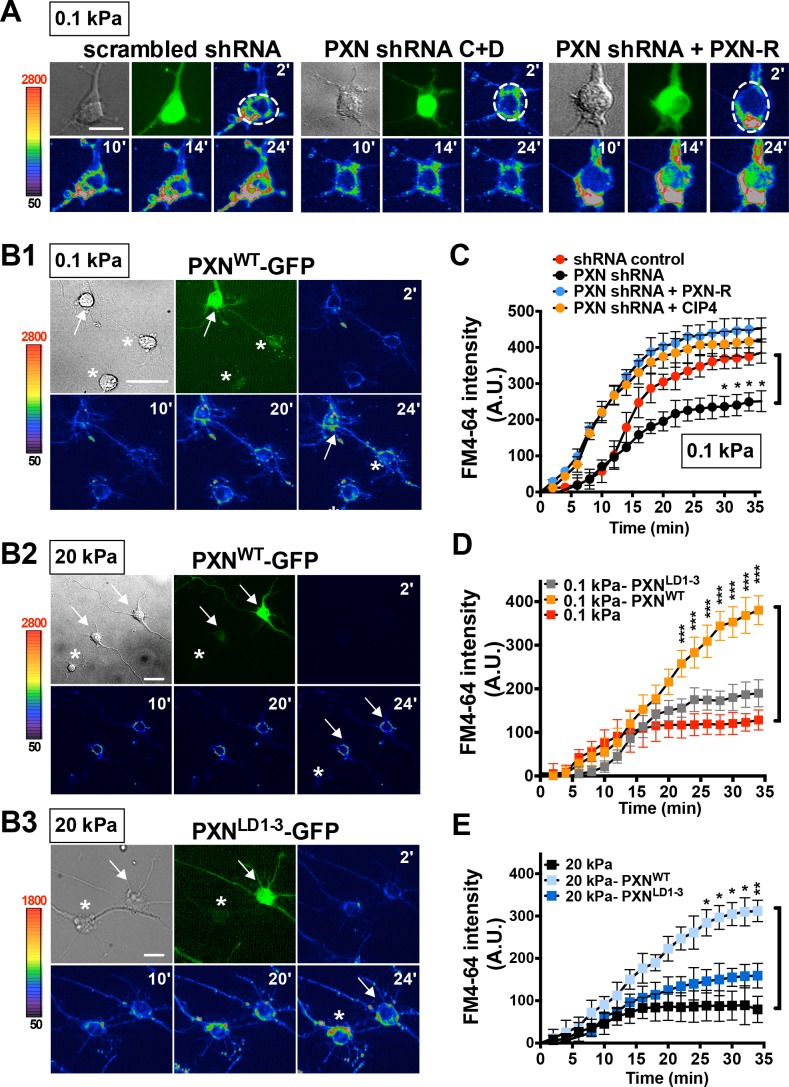
Figure 5.

Figure 5—figure supplement 1. Knockdown efficiency of PXN shRNAs.

Figure 5—figure supplement 1.

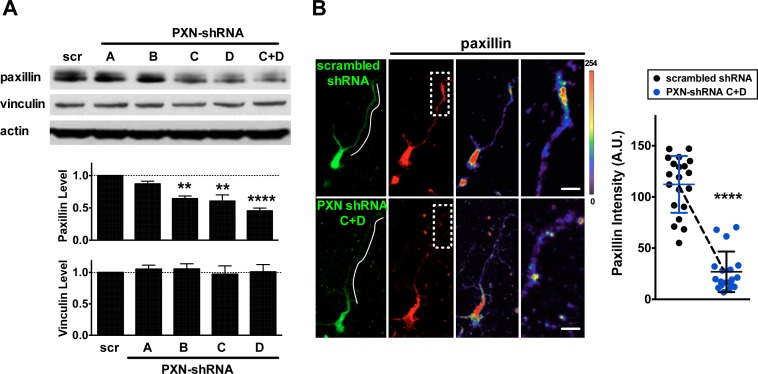
(A) Western blot showing efficiency of shRNA-mediated paxillin knockdown. Mouse neuroblastoma Neuro-2a (N2a) cells were transfected with plasmids encoding scrambled shRNA (‘scr’) or one of four paxillin shRNAs (sequence A, B, C, or D) targeting to different regions of the paxillin sequence. Summary histograms showing that shRNA D exerted a ~2-fold suppression on paxillin expression and it had no effect on vinculin expression. Data represent mean ±SEM (n = 5, normalized to control actin, compared to that of scr experiment; *p<0.05; t-test **p<0.01, ****p<0.0001; t test). (B) Images of neurons transfected with plasmids encoding scrambled shRNA or paxillin shRNAs (shRNA C + shRNA D), immunostained with antibody specific against paxillin. Right-most panels show the region of interest (ROI, dashed box) of neurite tips at a higher magnification, with the intensity of paxillin staining coded by pseudocolors in a linear scale. Bar: 5 μm. Dot plot reflects quantification of paxillin immunostaining intensity (±SEM, n = 20 cells each, normalized to EGFP intensity and relative to scramble control; ****p<0.0001; one-way ANOVA with Dunnett’s post hoc test).
Figure 5—figure supplement 2. Endocytic function and distribution patterns of CIP4 protein in 0.1 kPa neuronal cultures.

Figure 5—figure supplement 2.

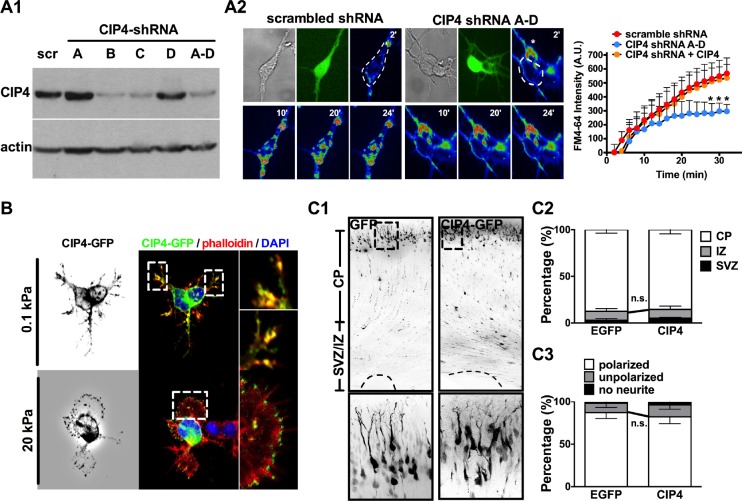
(A) CIP4 knockdown suppresses endocytic activity of neurons grown on 0.1 kPa gels. (A1) Western blot showing efficiency of shRNA-mediated CIP4 knockdown. HEK293T cells were transfected with plasmids encoding scrambled shRNA (‘scr’) or one of four CIP4 shRNAs (sequence A, B, C, or D) targeting to different regions of the CIP4 sequence. (A2) Representative time-lapse images of FM4-64 uptake in 5 hr neurons grown on 0.1 kPa gels. Time-lapse images (20 frames; 2 min intervals) of neurons isolated from E17.5 rat cortices which were transfected in utero at E16 with constructs encoding scrambled control or CIP4 (‘CIP4 shRNA A-D’) shRNA, and/or CIP4-GFP, cultured on 0.1 kPa for 5 hr, followed by endocytosis assay. Dashed circles surround the region of interest (ROI) for quantitative FM4-64 measurements. Asterisk marks non-transduced neighboring cells. Graph at right summarizes the accumulation curves of FM4-64 signal (±SEM, n > 3 independent experiments, 5–10 cells per group, normalized to t = 0 value; compared to that of scrambled control experiment *p<0.05; multiple t tests for each time point). (B) Images of neurons transfected with plasmids encoding CIP4-GFP, stained with phalloidin and DAPI. Right-most panels show the region of interest (ROI, dashed box) of neurite tips at a higher magnification. Note that CIP4-GFP was distributed along the enlarged lamella edge when neurons were cultured on 20 kPa gels. (C) Fluorescence images (C1) of P0 rat cortices transfected in utero at E16 with IRES constructs harboring GFP control or CIP4-GFP. The bottom panels show 4x magnifications of boxed regions corresponding to the P0 cortex in the top panels. Bar, 100 μm. (C2) Histograms showing the percentages (±SEM, n > 3 cortices each; ‘n.s.”, not significant, multiple t test) of neurons residing in the cortical plate (‘CP’), intermediate zone (‘IZ’), or subventricular zone (‘SVZ’) regions. (C3) Histograms showing the percentage (±SEM, n > 150 cells per cortex, >3 cortices each; ‘n.s.', not significant, multiple t test) of transfected cortical neurons exhibiting unipolar/bipolar polarized processes (‘polarized’), multiple short neurites without a long tailing process (‘unpolarized’), or no process (‘no neurite’) in cortices.