Abstract
Ultrasound-enhanced drug delivery through the cornea has considerable therapeutic potential. However, our understanding of how ultrasound enhances drug transport is poor, as is our ability to predict the increased level of transport for given ultrasound parameters. This paper describes a computational model for quantifying changes in corneal porosity during ultrasound exposure. The model is calibrated through experiments involving sodium fluorescein transport through rabbit cornea. Validation was performed using nylon filters, for which the properties are known. It was found that exposure to 800 kHz ultrasound at intensity 2 W/cm2 for 5 minutes increased the porosity of the epithelium by a factor of 5. The model can be useful for determining the extent to which ultrasound enhances the amount of drug transported through biological barriers, and the time at which therapeutic dose is achieved at a given location, for different drugs and exposure strategies.
Keywords: Ultrasound, Drug delivery, Ocular, Porous–medium model
Introduction
Drug transport through the cornea is a highly desirable mechanism for treating a variety of ocular diseases, including infection and inflammation (Ahmed et al. 1987; Doane et al. 1978; Ghate et al. 2008; Gaudana et al. 2010). Unfortunately, the cornea presents a substantial barrier to drug penetration (Davies 2000, Ke et al. 1999), making topical application of many drugs problematic.
A promising technique for enhancing the corneal permeability to ophthalmic drugs involves the use of ultrasound. In medical procedures performed in Russia with the aid of ultrasound systems operating at frequencies between 500 and 900 kHz, and intensities on the order of 0.2 W/cm2, a substantial (up to 10-fold) increase in drug delivered through the cornea was reported (Nuritdinov 1981; Panova et al. 1995; Tsok et al. 1990). Zderic et al. (2004a, 2004b) reported increases in corneal permeability with the aid of ultrasound, in both in vitro and in vivo experiments. In these experiments, an ultrasound transducer operating at 880 kHz, with intensities between 0.19 W/cm2 and 0.56 W/cm2 was employed. Ultrasound application in vitro at frequencies of 400 kHz-1 MHz, intensities of 0.3–1.0 W/cm2, and exposure duration of 5 min resulted in an increase in corneal permeability of 32–47% for Tobramycin, 46–126% for sodium fluorescein, and 32–109% for dexamethasone sodium phosphate (Nabili et al. 2013). In an in vivo study, ultrasound application at frequencies of 400 kHz and 600 kHz caused an increase in drug concentration in aqueous humor samples of 2.8 times (for 400 kHz) and 2.4 times (600 kHz), as compared to sham treated samples (Nabili et al. 2014).
The mechanisms underlying the enhancement of drug delivery with the aid of ultrasound are not well understood, and the level of enhancement for a given set of exposure parameters is difficult to quantify. One possible mechanism is acoustic streaming arising from the ultrasound energy absorbed by the fluid. Another proposed mechanism is an alteration of the corneal structure due to cavitation. In experiments with rabbit eyes, Zderic et al. (2004b) observed a strong increase in drug transport with measured increase in cavitation activity. In the eyes showing large increases in permeability (relative to the no-ultrasound case), damage in the first and second epithelial cell layers was observed. The damage appeared to be transient, with pitting disappearing within approximately 90 minutes.
Toward the goal of quantifying the relationship between corneal porosity and drug transport, mathematical models can be useful. Edwards and Prausnitz (2001) used a brick-like model of the cornea to predict the permeability of the human eye to different compounds. Cooper and Kasting (1987) modeled the cornea as a laminated membrane, with the epithelium being a lipophilic layer with aqueous pores. They proposed a diffusion coefficient with an exponential dependence upon molecular weight. In this paper, the cornea is modeled as a three-layer porous medium. Our assumptions are three-fold: 1) the physical effects of ultrasound can be adequately captured using a model of the epithelium whose porosity and thickness that are intensity dependent; 2) the porosity model can be accurately calibrated using via diffusion-cell experiments with rabbit cornea, before and after sonication; and 3) once the dependence of the porosity on intensity is known, the amount of drug transported for a given set of experimental conditions can be estimated from knowledge of the molecular diffusivity of the drug alone. The model in its present form is confined to cases where the epithelium is the layer that limits transport through the cornea, and the dominant mechanism is transport between cells (paracellular route), as opposed to transport through cells (transcellular route). As shown in previous studies (Edwards and Prausnitz 2001 Gaudana et al. 2010, Shih and Lee 1990), an important example is the transport of hydrophilic (low distribution) compounds. The extension of the model to other cases is addressed in the Discussion section. The changes in epithelial porosity and epithelial thickness arising from ultrasound exposure are determined using a mathematical inverse method in conjunction with a numerical solution to a diffusion equation. The diffusion-equation solver was used in an iterative fashion – adjusting the porosity and epithelium thickness at each iteration - to yield values that produced the best agreement between computational and experimental measures of dye concentration as a function of time. The computational model calibrated in this manner can then be used to determine the rate of transport of other drugs through the cornea, provided the molecular diffusivity is supplied.
The ability of the computational model to determine porosity was first validated using commercial filters, for which the porosity could be measured. Experiments were then performed using rabbit corneas mounted in a diffusion-cell setup. The amount of dye transported through the cornea before and after ultrasound treatment was measured using a spectrophotometer. The porosity and epithelium thickness of the cornea were determined in the pre-ultrasound and post-ultrasound phases, and it was determined how well a model based upon changes in porosity and epithelium thickness could fit experimental data. The change in porosity and epithelium thickness for different ultrasound intensities were determined.
Methods
Computational model
Flow geometry
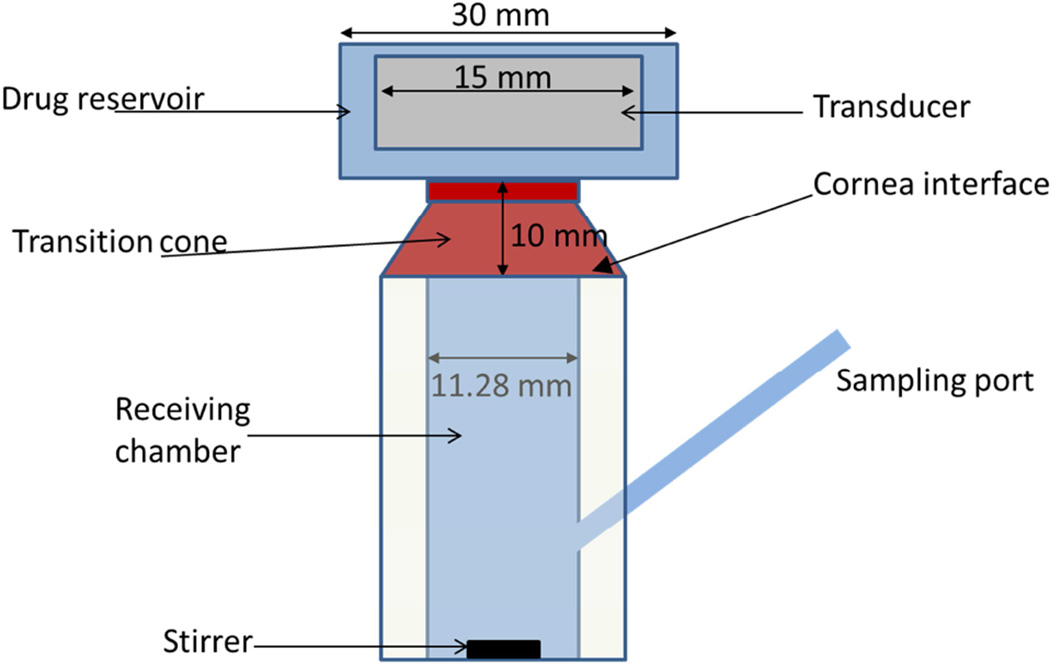
The cornea (Fig.1) was modeled as a porous medium consisting of three distinct layers i) epithelium, ii) stroma, and iii) endothelium. The thicknesses of these layers range between 30 – 48 µm, 240–400 µm, and 3–5 µm, for epithelium, stroma, and endothelium (Reiser et al. 2005; Li et al. 1997; Tsonis 2008; Kaye et al. 1962) respectively. The thickness of the stroma and endothelium were chosen to be 370 µm and 4 µm, respectively (Table 1). A sensitivity study was performed to quantify variability in the drug delivery rate caused by variations in the stroma and epithelial thickness, as well as other parameters. The outcomes of the sensitivity study are presented in the Results section. Since the epithelium had the most pronounced effect on drug transport, and because the thickness was potentially altered by the ultrasound, the thickness value was kept as an unknown variable in our iterative approach (discussed in the Inverse Algorithm section). Consequently, for each rabbit-eye specimen, a unique epithelial thickness was determined based upon the experimental data obtained from the diffusion cell measurements. Since the corneal thickness was much less than the radius of curvature of the eye, the curvature of the corneal layer was not considered in our simulations.
Figure 1.
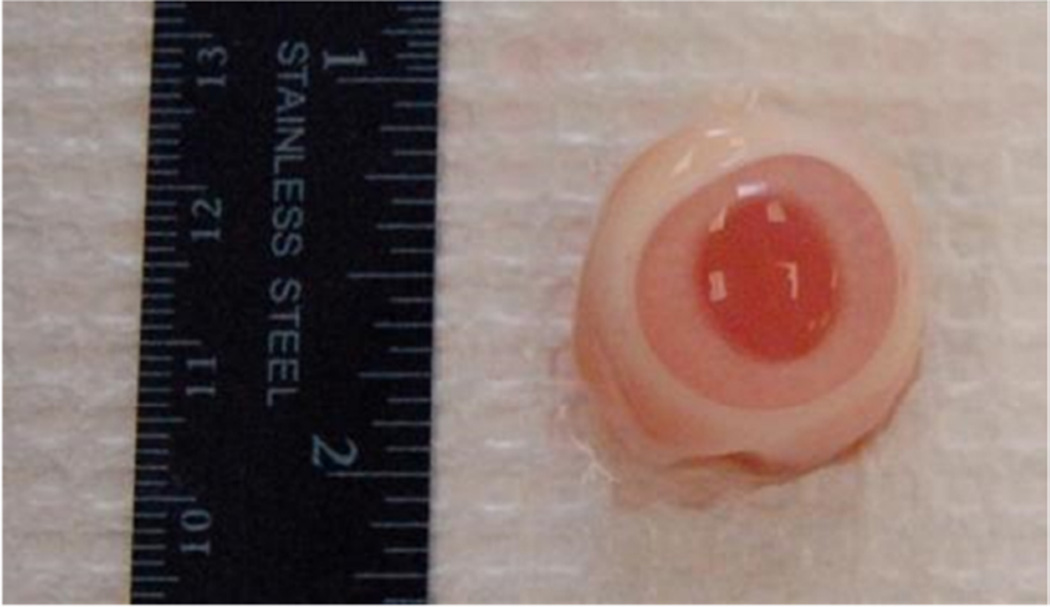
a) Schematic of diffusion cell experimental setup; b) Rabbit Cornea
Table 1.
Geometric and material properties of rabbit eye
| Material property/geometric parameter |
Range | References |
|---|---|---|
| Molecular diffusivity of sodium fluorescein in saline (m2/s) |
2.7e-10–7e-10 | [Farrell. 2009;Periasamy et al. 1998;Wang et al. 2005;Fu et al. 1998; Nugent et al. 1984;Casalini et al. 2011] |
| Thickness of stroma (microns) |
240–400 | Tsonis 2008; Kaye et al. 1962 |
| Porosity of stroma | 20–70% | Overby et al. 2001 |
| Thickness of endothelium (microns) |
3–5 | [Tsonis 2008] |
| Porosity of Endothelium |
0.018%–0.18% | [Edwards et al. 2001] |
Governing equations
The transport of drug through the porous media was modeled using the diffusion equation:
| (1a) |
Here C is the drug concentration (kg/m3) and Deff is the effective diffusivity (m2/s), which is the product of molecular diffusivity of the drug in the carrier fluid (Dmol) and the porosity (φ) of the medium, i.e.
| (1b) |
(Fidap 8.6.2, 2002) As the porosity of the membrane increases, the effective diffusivity of the drug through the membrane increases, thereby offering less resistance to drug transport through the porous membrane. At the interfaces between various corneal layers (epithelium-stroma and stroma-endothelium), continuity of drug flux and drug concentration was maintained :
| (2) |
| (3) |
Here i = 1 denotes the epithelium, i=2 the stroma, and i=3 the endothelium, and n denotes the direction normal to the interface.
A commercial meshing package (Gambit, Fluent Inc. Evanston, IL, USA) was used to discretize and obtain a finite-element representation of corneal layers. A total of 6000 quadrilateral elements of size 0.5×1 µm2 were used to construct the mesh. A mesh refinement study was conducted using element sizes of 1×2 µm2 and 0.25×0.5 µm2 to show that cumulative amount of drug delivered changed by less than 1% as the mesh was refined from coarse to fine.
The diffusion equations (Eqs. 1–3) were solved using a Galerkin finite-element technique, as implemented in the commercial finite element solver FIDAP (FIDAP 8.6.2, Fluent Inc, Evanston IL, USA). A convergence criteria of 1×10⁻⁵ was imposed for the estimating the drug concentration. An implicit time integration scheme (second-order trapezoid rule) in conjunction with an adaptive time-stepping methodology used for performing the transient analysis. The initial time step was 0.0001and the maximum allowed time step size was 1s. In addition, the time step size was controlled by a maximum rate of increase of 0.5%.
In the validation experiments with nylon filters, the porous medium consisted of a single layer. In the case of a single layer, an analytical solution to Eq. 1 exists (Carslaw & Jaeger 1992). In terms of the total quantity Q of sodium fluorescein that has exited the medium by time t, the solution is
| (4) |
where C0 is the compound concentration in the donor chamber, A the cross-sectional area of the orifice of the diffusion cell, l the thickness of the filter, and t the total time. For the validation experiments, Eq. (4) was used to verify the quantity of compound transported as predicted by the finite-element model.
Material properties and boundary conditions
Table 1 lists the material properties and geometric conditions used in the numerical simulations. The molecular diffusivity of sodium fluorescein in saline ranges between 2.7e-10 m2/s to 7e-10 m2/s (Farrell 2009; Periasamy et al. 1998; Wang et al. 2005; Fu et al. 1998; Nugent et al. 1984; Casalini et al. 2011). A value of 6.3e-10 m2/s was used in the calculations, other than the sensitivity study. The porosity of the epithelium was left as variable and determined by the computational model. The porosity range for the stroma and endothelium was obtained from literature (Table 1). The sensitivity study quantifies how variations in the different properties impact the drug transport.
A constant concentration boundary condition was maintained at the donor chamber and the receiver chamber (Figure 1). The value in the donor chamber was the full dye concentration used for the experiment, prepared as described in the next section. A value of 0 was assumed for the receiver chamber. The constant-concentration boundary condition assumes that both the donor and receiver reservoirs are large enough that the drug transported through the membrane doesn’t change the concentration appreciably in either chamber. The drug is also assumed to be well mixed in these reservoirs (no concentration gradient present in the reservoirs).
Optimization algorithm
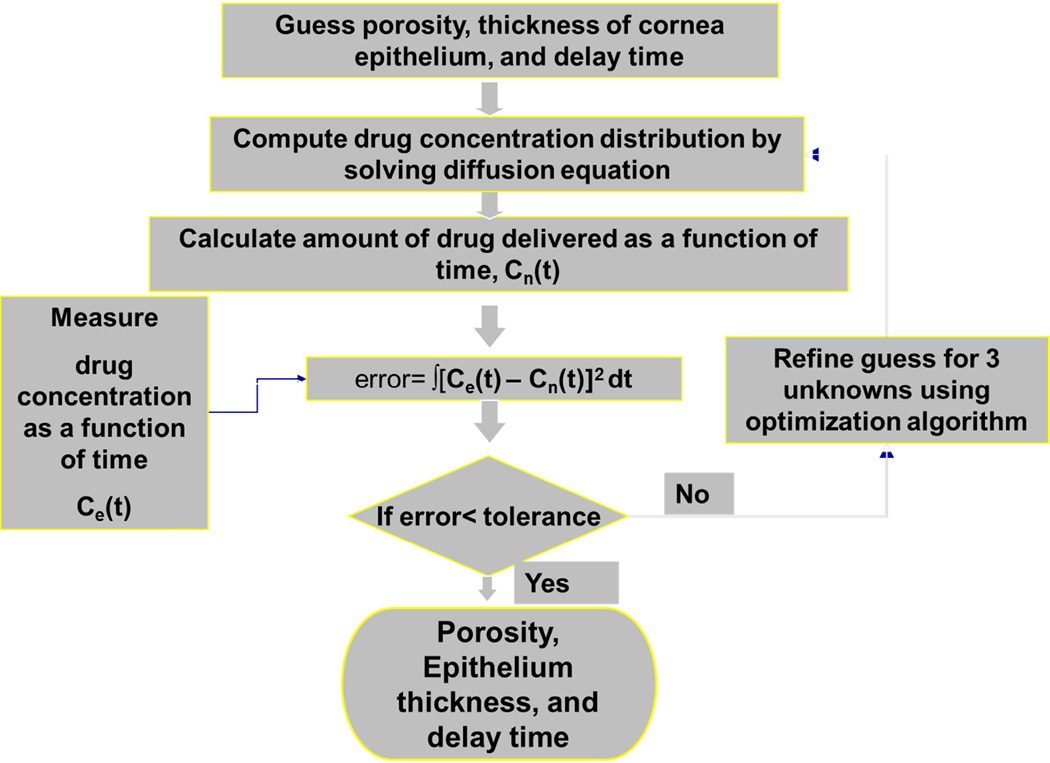
The numerical solution of the diffusion equation was combined with experimental measurements (discussed in the next section), in an inverse algorithm used to determine the porosity and thickness of the epithelium both before and after the US exposure. In addition, the same algorithm was used to determine the additional time required for re-wetting of the pores in the epithelial membrane. The re-wetting time was determined from data obtained pre-US. The inverse algorithm is depicted in the flow chart in Fig. 2.
Figure 2.
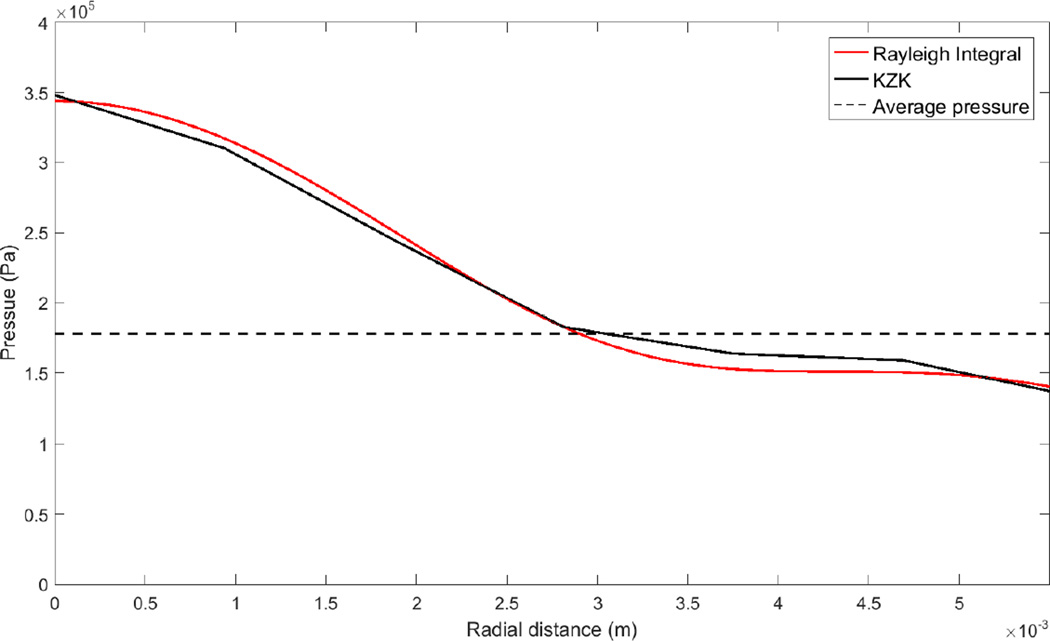
Pressure distribution across the surface of the cornea, determined from numerical simulations.
In the inverse approach, an initial guess was made for the unknown parameters of interest (thickness, porosity, and delay time). Subsequently, the transient drug transport through the corneal layers was simulated by solving the diffusion equations (Eqs. 1–3). The amount of drug transported as determined by the computations was compared with that measured in the diffusion-cell experiments. To reduce the difference between the computed and measured concentrations, the initial guess was updated using an optimization procedure.
The optimization procedure is based upon a Nelder-Mead multidimensional algorithm (Hariharan et al. 2007). In the algorithm, the difference in the amount of drug mimicking compound transported into the receiver chamber as predicted by the numerical and the experimental approaches was computed, from
| (5) |
where n is the number of time points for which the drug concentration was measured or computed. The optimization routine then modifies the guesses for the unknowns (thickness, porosity, and delay time) so that the rms error between experiment and computation is reduced. The optimization process stops if the relative step size of all the optimization variables (i.e. epithelial thickness, porosity, and delay time) is below a preset threshold (1×10⁻⁵) and the optimization function value (Errorrms) does not change beyond a preset threshold (1×10⁻⁷) for successive iterations. If the match between the temporal drug concentration profiles (in the receiver chamber) is acceptable (~10% of the mean concentration), the latest values for epithelial porosity, thickness, and delay time obtained from the inverse algorithm is accepted as the final value. The same process is repeated for post-US data to obtain the final epithelial porosity and thickness post-US. For each stage, the number of iterations required to obtain the optimized porosity and thickness values was approximately 125 and the total computation time for the optimization algorithm was around 15 hours.
Experimental set-up
A rabbit model was used in the experiments to calibrate the mathematical model. Rabbit eyes are commonly used in studies of transcorneal drug delivery (Zderic et al. 2004a, Zderic et al. 2004b, Prausnitz and Noonan 1998, Van Der Bijl et al. 2002). The rabbit eyes were purchased in-vitro from an approved supplier of animal tissues (Pel-Freez Arkansas, LLC, Rogers, AR), and mounted in a diffusion cell set-up (Figure 1). The eyes were shipped in Dulbecco’s Modified Eagle Medium (DMEM) and the experiments were performed within 24 hours after rabbit sacrifice. There were no preservatives used in the storage medium, which consisted of glucose, amino acids, pH indicator, salts, and vitamins (Nabili et al. 2013). Before the experiments, the rabbit eyes were visually examined to ensure that they were free of abrasion, and ones with observed corneal damage were not used. Each cornea was removed from the eye and placed on a flat-topped diffusion cell (PermeGear Inc., Hellertown, PA). The diameter of the orifice in the diffusion cell (Fig. 1) was 11 mm. During the dissection process, the eyeballs were exposed to open atmosphere between 10 to 45 minutes, and the possibility existed for the pores in the cornea to dry-up, resulting in voids in the porous medium. Consequently, in our computational model, we accounted for the additional time required for re-wetting of the pores in the corneal layers before the diffusion process began. The surface area of the cornea that was exposed to the concentrated drug in the donor chamber was approximately 1cm2. Sodium fluorescein, with concentration varying between 0.25% to 0.5% (0.25 to 0.5 g per 100ml of saline solution) in the donor chamber, was used as the drug for our diffusion measurements. To start the experiments, approximately 5 ml of the concentrated drug solution was placed in the donor chamber while the receiver chamber contained the pure saline solution. The size of the receiving chamber used in our experimental set-up was roughly 5 ml. A magnetic stirrer (3800 rpm) was used to ensure that the drug was uniformly mixed in the receiving chamber.
The initial phase of the transport experiment was performed without applying ultrasound to the cornea. Throughout the experiment, the concentration of the drug in the receiver chamber was measured every 30 minutes by extracting approximately 0.4ml of the drug sample through the sampling port (Figure 1). An equivalent amount of saline was added back to the receiving chamber to maintain the same fluid volume. The addition of saline diluted the drug concentration in the receiving chamber enough that a dilution correction (described in the Dilution Correction section) was used to account for any reduction in the drug concentration in the receiver due to repetitive sampling. After sampling of the receiver chamber, a spectrophotometer (UVmini 1240, Shimadzu, Columbia, MD) was used to measure the dye concentration. The maximum absorbance for sodium fluorescein occurs at a wavelength of 490 nm (Nabili et al. 2013). Prior to the diffusion-cell experiments, a calibration curve was obtained independently by varying the drug concentration and measuring the corresponding absorbance at 490 nm. The duration of the experiment before applying ultrasound was 3–4 hours. By that point, the flux through the cornea had reached steady state. From the data obtained in the pre-US phase, the baseline epithelium porosity and thickness were obtained using the procedure described in the Inverse algorithm section.
After this baseline period, the same cornea was exposed to continuous-wave US emanating from an 800KHz, unfocused, 15-mm diameter transducer (Sonic Concepts, Bothell, WA, USA) for 5 minutes. The experiments were performed for 4 different US intensities (ISATA): 0.5, 0.75, 1, and 2 W/cm2. The intensities were determined by first measuring the ultrasound power using a radiation force balance (Ohmic Instruments, Easton, MD, USA), and then dividing by the area of the transducer. The longitudinal distance between the US transducer and the cornea was 3 cm. The radial pressure distribution across the cornea at the 3-cm axial location was computed using free-field numerical simulations, using both the KZK equation, as implemented in the KZKTexas software (Lee and Hamilton 1995), and a Rayleigh-integral approach, as implemented using a Simpson’s Rule double integral function in the Matlab (Mathworks Corporation, Natick MA) software. The free-field assumption was justified on the basis that the dimensionless wavenumber 2πd/λ (d being the diameter of the orifice below the drug reservoir in Fig. 1a and λ the acoustic wavelength) is large (approximately 38). The radial pressure distribution (for the 1 W/cm2 intensity) across the cornea is plotted in Fig. 2. The average pressure across the cornea, also plotted in Fig. 2, is 0.18 MPa. For the 0.5 W/cm2, 0.75 W/cm2, and 2.0 W/cm2 intensities, the average pressures across the cornea were 0.13 MPa, 0.15 MPa, and 0.25 MPa. In the computational model, radial variations (e.g. in porosity) are not modeled; the results generated by the model represent an average over the corneal surface. The implications of radial variations are discussed further in the final section. When reporting the levels of ultrasound-enhanced transport in the figures, we provide the pressure level averaged over the corneal surface. In that way, users can estimate the level of ultrasound enhancement for an arbitrary transducer, once the average pressure across the cornea can be estimated, e.g. from computational models.
For each intensity level, a minimum of three trials and a maximum of nine trials were performed. The drug concentration in the receiving chamber post-US was obtained for another 3 hours with sampling done every 10–30 min. Since the intra-species variability in epithelial thickness and porosity was anticipated to be high, the pre-US diffusion measurements that were used to establish the baseline epithelial thickness and porosity were performed for all the trials.
Dilution correction
The volume of fluid sampled from the receiver chamber (for spectrophotometric measurements), and subsequently replaced with distilled water, was a large enough fraction of the total volume of the receiver chamber that this dilution needed to be considered in calculations of drug mimicking compound (sodium fluorescein) concentration and flux. Dilution was accounted for in the following manner.
We consider an initial dye concentration Cinitial of the compound in the receiver chamber. It is desired to know the final compound concentration Cfinal following sampling of the mixture and replacement with saline. The initial dye concentration of the compound is given by Cinitial = Vd/Vtotal, where Vd is the volume of compound in the receiver chamber and Vtotal is the total liquid volume. The amount of dye Ve extracted from the receiver chamber is given by Ve = Vs Vd/Vtotal, where Vs is the volume of the mixture sampled from the receiver chamber. The amount of dye remaining in the receiver chamber is given by Vd (1 − Vs/Vtotal). Since the total volume of fluid in the receiver chamber remains Vtotal after replacement with distilled water following sampling, the new concentration of dye after sampling is: [Vd (1 − Vs/Vtotal)]/ Vtotal. This can be rewritten as Cfinal = (1 − ε)Cinitial, where ε = Vs/Vtotal. In our procedure ε was approximately 0.1. For comparison with experimental values, the computed concentrations were diluted by the factor (1 − ε) for each sampling point.
Validation experiments using nylon filters
A validation test of the model was performed using nylon filters (GNWP02500, EMD Millipore Corporation, Darmstadt, Germany), for which the thickness and porosity could be measured. The filter width was 25 mm. The thickness (measured using a micrometer on a stack of 10 filters) was 151 (+/− 5) µm. The porosity of the filter was measured directly by placing the filter in a water volume and observing the increase in volume in the water/filter mixture. For a filter of porosity 0%, the rise in volume after a filter is added would equal the volume of the filter. For a filter of 100% porosity, no increase in volume would be observed if the fluid is able to fill the pores. To ensure that surface tension did not prohibit fluid filling of the pores (initially filled with air), a surfactant (Triton-X 100, SPI Supplies, West Chester, PA) was added to the test fluid. During the test, 10 filters were added to a graduated flask, in order to produce a measurable change in liquid level. The experiment to directly measure the porosity of the filter was performed three times, using new filters each time.
For the transport experiments involving the nylon filter, the filter was inserted into the diffusion cell and the same protocol for determining the effective diffusivity of the rabbit cornea was used to determine the effective diffusivity, and subsequently the porosity, of the filter. Three different filters were tested.
Sensitivity study
In order to assess the sensitivity of the model results to the various input parameters, the ratio of the epithelial porosity after ultrasound exposure to that prior to ultrasound exposure was determined for the minimum and maximum parameter values found in the literature. Parameters considered include the porosity of the stroma, porosity of the endothelium, volume sampled from the acceptor chamber, thickness of the stroma, and thickness of the endothelium. The ranges for the parameters are provided in Table 1. Outside of the sensitivity study, results are computed based upon the mean values of the parameters. The sensitivity study examines how the parameter extremes affect the change in epithelial porosity due to ultrasound. Epithelial porosity was used as the dependent variable because it is the variable with strongest effect on transcorneal drug transport.
Results
Validation with Filters
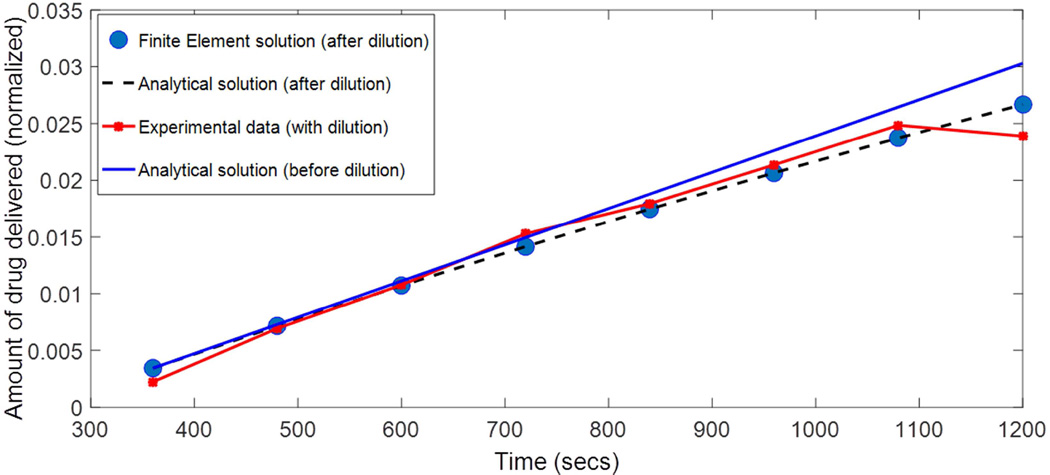
The amount of dye passing through the synthetic filter is plotted in Fig 4, for one of the three filter experiments. Concentration values are normalized by concentration in the donor chamber. Along with the experimental data, the finite-element and analytic (Eq. 4) solutions are shown. The analytic solution is shown both for the case where dilution is accounted for (detailed in Dilution correction section) and when it is not. The analytic and finite-element solutions (both accounting for dilution) overlap. The RMS average deviation between these traces and the concentration measurements was 0.00044 (2.8% of the average concentration value).
Figure 4.
Amount of dye (normalized by the concentration in the donor chamber) transported through the synthetic filter as a function of time, in the validation experiment. symbols – experimental data, line – Computational data.
As with the rabbit cornea, a delay time existed for transport through the filters. For the sodium fluorescein solution in the matrix of the nylon filter, the delay time amount to a little over 300 seconds.
It was found that the time required for the transport through the filter to reach steady state was on the order of 10 s, too short for the transient behavior to be resolved by our measurement technique (the act of just sampling the receiver chamber required on the order of 10 seconds). In the absence of information regarding the transient behavior (represented by the infinite sum in Eq. 4), the optimization algorithm could uniquely determine only 2 parameters. We chose to prescribe the filter thickness as the measured value, and solve for the delay time and the porosity. Another possibility would have been to prescribe the measured delay time and solve for the thickness and porosity. Equivalently, the 2 parameters k/l (units of velocity) and l2/k (units of time) in Eq. 5 could have been prescribed. The time shift and porosity values for the three trials with the nylon filters are shown in Table 2. The uncertainty in the porosity originates from the fact that the optimization algorithm returned the effective diffusivity (Eq. 1b), and the range of molecular diffusivities in Table 1 was used to derive the porosity and its uncertainty.
Table 2.
Results of model applied to nylon filters. The porosity of the filter based on experimental measurements is 733 0.73±0.02.
| Time shift (s) | Porosity | |
|---|---|---|
| Trial 1 | 245 | 0.88±0.14 |
| Trial 2 | 159 | 0.83±0.13 |
| Trial 3 | 295 | 0.97±0.15 |
For comparison, the porosity derived by direct measurement was 0.73±0.02. The porosity, representing a void fraction, is dimensionless. In the optimization routine it is derived from the effective diffusivity, which has dimensions of length2/time.
Experiments with rabbit cornea
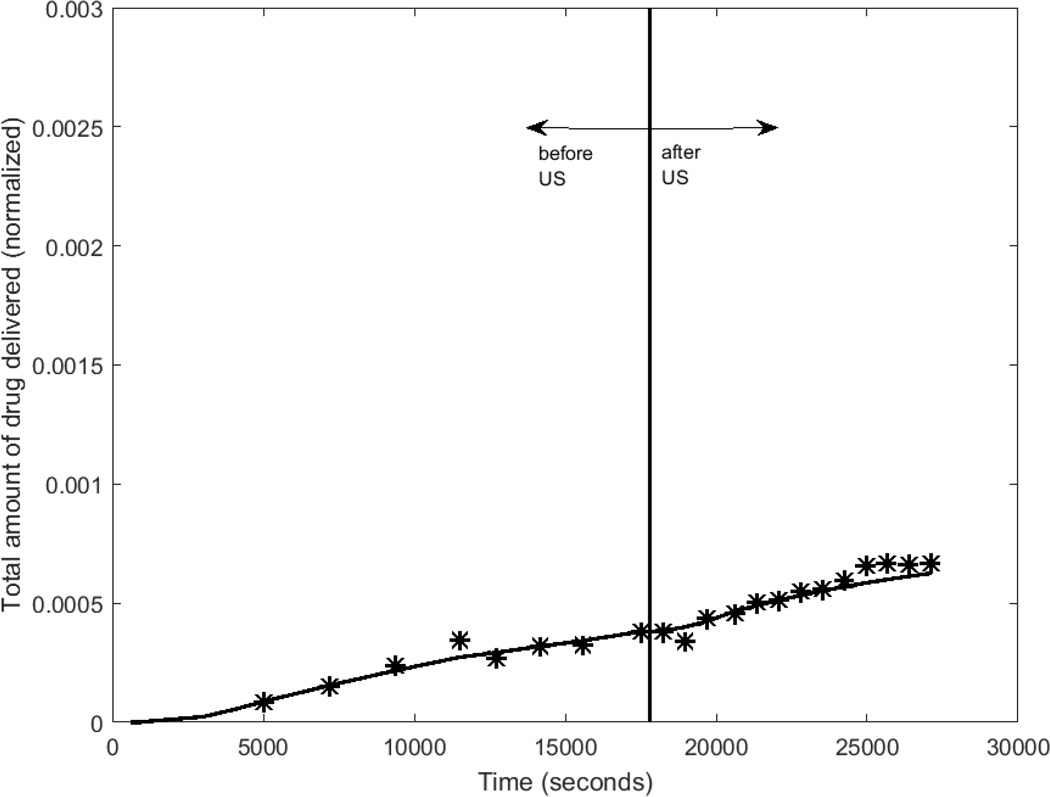
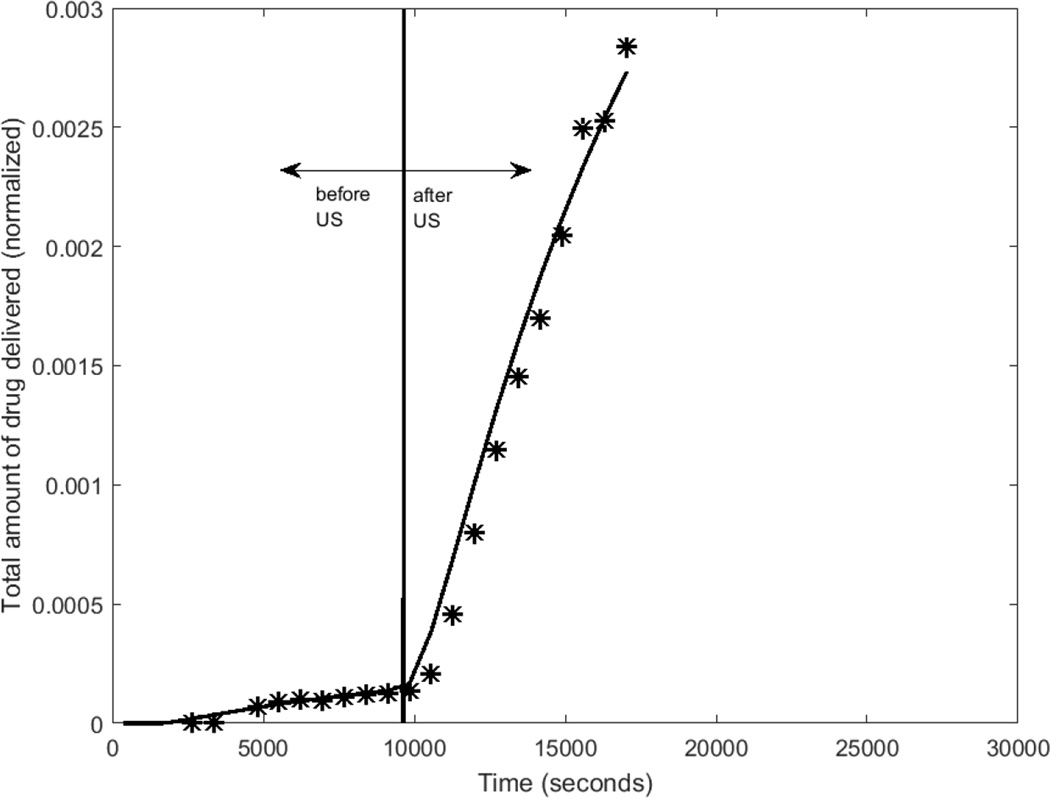
Figures 4a and 4b show the cumulative drug-mimicking compound transported into the receiver chamber for two different intensities, 0.75 W/cm2 and 2.0 W/cm2. Both the experimental data and the best-fit results from the computational model are shown. The average difference between the measured and computational normalized concentration was 2.3e-4 for an intensity of 0.75 W/cm2, and 4.2e-4 for the intensity of 2.0 W/cm2. With respect to the mean value over the pre-US period, these differences amount to 1.4% and 2.9%.
For the experiments featured in Figs. 5a,b, time delays predicted as part of the optimization routine were 360 and 700 s, respectively. The mean time delay of all of the trials, as specified by the optimization routine, was 423 s.
Figure 5.
Experimental and computational determinations of drug concentration in the receiver chamber before and after ultrasound is turned ON (5-minute application) for 2 different trials (trial 1 intensity=0.75 W/cm2, trial 2 intensity=2 W/cm2).
After the 5-minute US exposure (at a time of around t = 104 seconds), a sharp rise in the rate of drug transport was observable at the 2.0 W/cm2 intensity (Fig 4b). At the 0.75 W/cm2 intensity, there was no discernable increase in the rate of drug transport after the cessation of ultrasound (approximately 1.8 × 10⁴ seconds.)
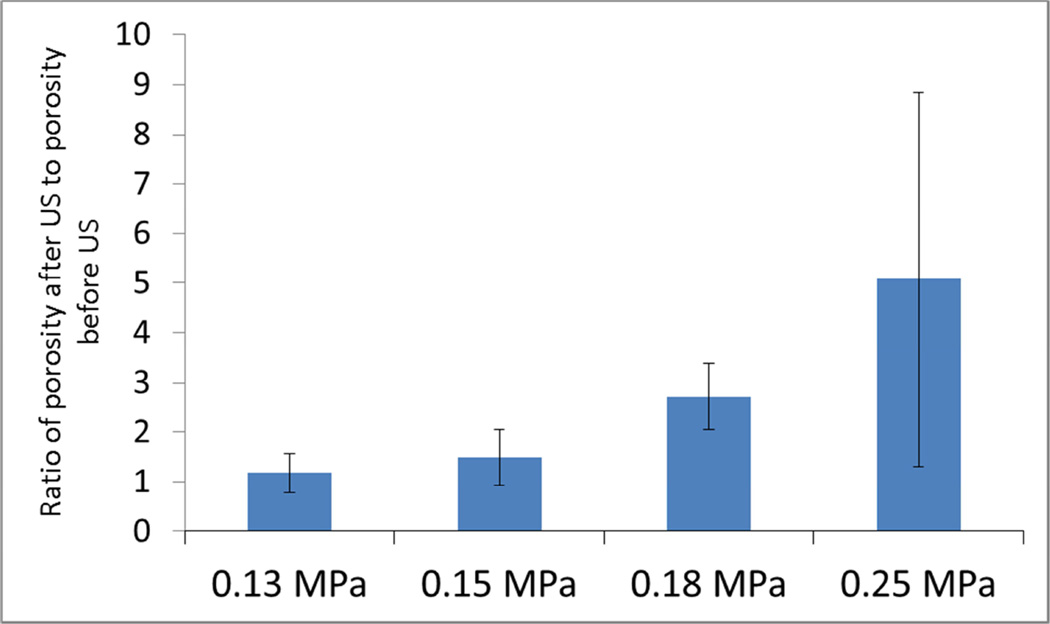
The epithelial porosity values derived by the computational model are plotted in Fig. 6, for the 4 different intensities considered in the experiments. The ratio of the porosity after US exposure compared to before US exposure was shown by a one-sample t-test to be greater than 1 for the 1.0 W/cm2 intensity (p = 0.04) and 2.0 W/cm2 intensity (p = 0.02). For the intensities of 0.5 W/cm2 and 0.75 W/cm2, the ratios were not found to be statistically different from 1.0.
Figure 6.
Effect of ultrasound – Ratio of porosities after and before 5-min ultrasound exposure (n≥3).
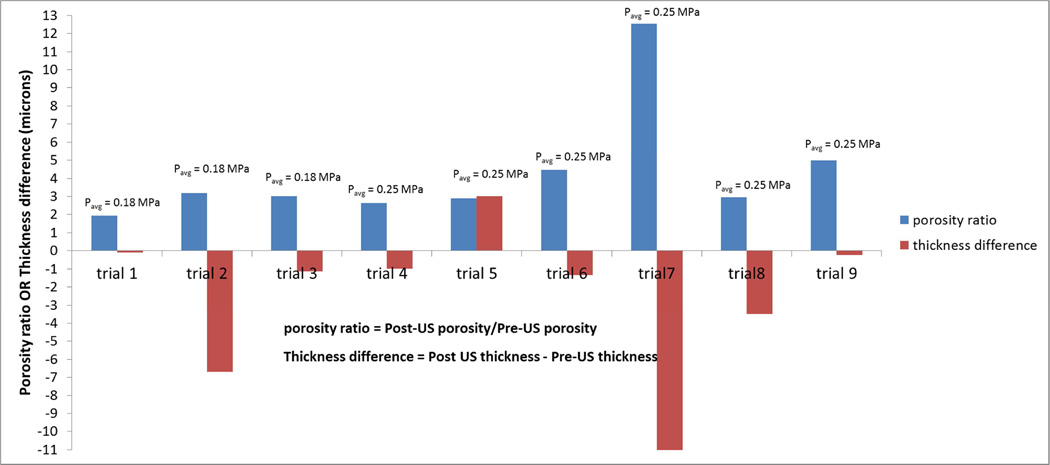
The porosity ratio (post-US/pre-US) and difference in epithelial-layer thickness (post-US ― pre-US) are plotted in Fig. 7, for all the trials involving intensities of 1 W/cm2 and 2 W/cm2. All but one of the trials showed a slight decrease in epithelial-layer thickness, with the average change being 2.7µm (out of a mean thickness of about 30 µm) A one-sample t-test was performed to determine whether the average change for the 9 trials of Figure 7 was different from zero in the negative direction. The resulting p-value for the test was 0.057.
Figure 7.
Porosity ratio and thickness difference pre-US and post-US for different trials at 1 W/cm2 and 2 W/cm2 intensities.
Sensitivity study
The sensitivity study was performed to evaluate how the uncertainties in the input parameters such as thickness and porosity of different cornea layers can influence the simulation results, especially the ratio of epithelial porosity post-US to pre-US. Table 1 lists the lower and upper bounds for each input parameter used in the sensitivity study. The corresponding lower and upper bounds for epithelial porosity ratio are given in Table 3. The porosity ratio based upon the mean parameter values is 5.37, for an ultrasound intensity of 2 W/cm2. The largest change in the porosity ratio that resulted when the parameter was varied over the entire possible range occurred for the endothelium porosity, with a change of 5.4 to 7.
Table 3.
Sensitivity study: Ratio of epithelial porosity before and after US; Table 1 lists the lower and upper bounds for each input parameter used in the sensitivity study. While varying one of the parameters, the values of other input parameters were kept constant at their mean value.
| Ratio of Post US porosity to Pre-US porosity |
% change in porosity ratio/% change in parameter |
|||
|---|---|---|---|---|
| mean properties | lower limit | upper limit | ||
| stroma-porosity | 5.37 | 5.26 | 5.68 | 0.1 |
| Endothelium porosity | 5.37 | 7.00 | 5.40 | 0.4 |
| Sampling volume | 5.37 | 5.38 | 5.16 | 0.4 |
| stroma thickness | 5.37 | 5.07 | 5.38 | 0.2 |
| endothelium thickness | 5.37 | 5.29 | 5.21 | 0.1 |
Application of Model
To illustrate the potential clinical utility of the model, simulation of drug transport in the absence and presence of ultrasound was performed. In the simulations, the dimensions of the human eye were used. These included an epithelial thickness of 53 microns and a stroma thickness of 460 microns. Simulations were performed by solving equations (1) – (3), with the ratio of porosities before and after ultrasound taken from Fig. 6. We considered a macromolecular eye drug, having a molecular weight between 4000 and 9000 Da. As reported by Edwards and Prausnitz (1998), transcorneal delivery of macromolecules poses a considerable challenge. Macromolecules in the size range of interest have a molecular diffusivity on the order of 3 × 10⁻¹⁰ m2/s (Hobbie 1978), roughly half of the value for sodium fluorescein. This difference in molecular diffusivities between sodium fluorescein and macromolecules was reflected in the computations of drug transport: simulations in the absence of ultrasound showed that the amount of sodium fluorescein transported through the cornea in 2 hours was approximately 9 times that of the macromolecule. To quantify the effect of ultrasound enhancement, we considered a procedure where a 5-minute sonication at 2 W/cm2 was performed prior to drug transport. The increase in porosity following the ultrasound procedure was taken to be five-fold (Fig. 6). Simulations revealed that the amount of the macromolecular drug transported over a 2-hour duration increased by a factor of 170. In terms of treatment time, the time required to reach the cumulative drug concentration equal to that of the 2-hour procedure in the absence of ultrasound, was 5.5 minutes for the ultrasound-enhanced procedure.
Discussion
In this study, an attempt was made to model complex phenomena, such as cavitation and changes in cellular morphology, using the simple construct of an effective diffusivity. A first-principles model would require a considerably more sophisticated, multi-scale approach. The fact that the present model is so heavily informed by experimental data makes it possible to consider the simple, effective-diffusivity (= molecular diffusivity × porosity) approach. The price paid is that the extensive experiments used to explore the changes in porosity must be performed. We add, however, that once the porosity dependence upon ultrasound characteristics (primarily intensity and frequency) have been determined using one drug (or drug surrogate), the model can be used to compute transport for other drugs with only the knowledge of the molecular diffusivity. The molecular diffusivity is often already contained in databases, or can be easily measured.
Some measure of the appropriateness of the effective-diffusivity model can be gleaned from the data in Figure 5. The close agreement between the experimental drug-concentration trace and the computational one is evidence that the complex phenomena underlying ultrasound-enhanced drug transport can be captured in the model with one critical parameter (porosity) and two less-important parameters (thickness and delay time). Presumably, if more parameters were required, or a multi-scale approach was necessary, close agreement in both the pre-ultrasound and post-ultrasound regimes would not be attained. An estimate of the agreement between the experiments and computations, and hence of the appropriateness of the model, is provided by the optimization algorithm. The algorithm yields not only a best guess for the porosity, but an estimate of the RMS error between experiments and the effective-diffusivity model.
The large uncertainty in the porosity ratio for an intensity of 2 W/cm2 is due to the single trial for which the ratio is 12.5. This ratio, along with the ratios for all of the other trials, are shown in Fig. 6. Ignoring the singularly large value, the mean porosity ratio for the 2 W/cm2 intensity is 3.2, with a standard deviation of 0.8. With or without the singularly large value, a one-tailed t-test yields the conclusion that the porosity ratio is significantly larger than one (p < 0.05). The standard deviations as a percentage of the mean, ignoring the single large value, are less than 30% for the four intensities.
At the higher pressures used in the study, ultrasound-induced cavitation potentially played a role in changing the porosity of the epithelial layer. While the peak negative pressure is likely too low to initiate cavitation (Mechanical Index < 0.5 in all cases) within the cornea, the cornea was adjacent to a liquid mixture containing tap (non-degassed) water combined with sodium fluorescein. As demonstrated by Atchley et al. (1988) the cavitation threshold in water at a frequency of 0.98 MHz is on the order of 400 kPa, comparable to the higher pressures in this study. (In the study of Atchley et al., the water was degassed but contained latex particles.) Using the same model transducer as the one from our study, and a passive cavitation detector, Castellanos et al. 2016 detected noticeable energy (about 10 dB above noise level) at frequencies equal to half and 1.5 times the fundamental frequency (800 kHz), during 1 W/cm2 exposures. The presence of energy at these frequencies is a strong indicator that inertial cavitation was present. Morphologically, the increase in porosity may be due to a transient increase in intracellular spacing within the epithelial layer, due to oscillation of cavitation-induced bubbles near the cornea surface, or to the microjets arising from the collapse of the bubbles (Paliwal and Mitragotri 2006). The small reduction in epithelial thickness is possibly due to the removal of cells from the surface layers of the epithelium (Zderic et al. 2004a).
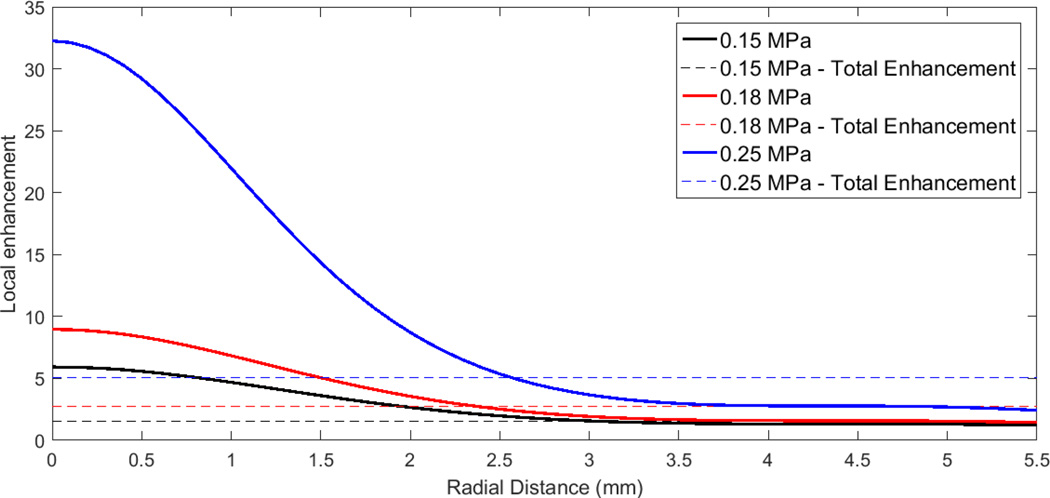
While the pressure across the corneal surface was assumed to be uniform, it was seen in Figure 2 that the pressure actually decreased by about a factor of two over the radius of the orifice. The effect of the variable pressure distribution on the variability of the porosity distribution was estimated in the following manner. Given that the pressure varies over the scale of the orifice radius, about 6 mm, and the thickness of the epithelium is less than one-hundredth of that, we assume that the pressure field is locally uniform, i.e. the epithelium at any radial location responds to the pressure of the ultrasound beam at that location. To model the increase in porosity with pressure, we hypothesized a local enhancement of porosity upon pressure of the form
| (6) |
where p0 is threshold pressure below which no porosity enhancement occurs. That pressure, and the scaling constant b, were determined by first integrating this function for LE across the entire corneal surface, to find the total enhancement TE:
| (7) |
The total porosity enhancements were then compared with the values measured in the experiments (Fig. 6). The difference (summed over all 4 pressure values) between the computed enhancements and the measured ones was minimized (using the Nelder-Mead optimization algorithm described in the Methods section, in conjunction with Eq. (5)) when the pressure p0 was 0.1 MPa and b = 9 (MPa)^(−1). The relative root mean square error in the computation of the total enhancement was approximately 7%, i.e. the exponential model was able to reproduce the 4 measured total enhancements in Fig. 6 with an accuracy of 7%.
The local enhancement as approximated by the exponential function is shown in Fig. 8. On the axis, the local porosity enhancement is large, in excess of 30 for the highest ultrasound intensity. While the integrated effect of this large local porosity is less than the local effect, due to the smaller area near the beam axis, the high porosity value illustrates the potential for large changes in porosity- and increases in drug delivery - across the cornea if a pressure value on the order of 0.25 MPa can be maintained across the entire surface. Accuracy of the local porosity enhancement values generated by the exponential model can be improved by expanding the ultrasound intensities beyond the 4 included in this study, particularly to values above the current maximum of 0.25 MPa.
Figure 8.
Local porosity ratio as a function of radial distance across cornea, generated assuming the cornea responds to the local pressure and an exponential dependence of porosity upon pressure. Parameters for the exponential fitting function were determined by curve fitting to the data in Fig. 6.
Before attributing the enhanced transport of drug through the cornea only to increased porosity, the possibility of increased fluid velocity through the cornea without a change in porosity should be considered. Acoustic streaming, i.e. the steady fluid flow arising from absorption of ultrasound energy, through the voids in the cornea could also enhance the flux of drug through the cornea. The radiation force exerted by the ultrasound beam on the drug is responsible for the motion. The Appendix describes experiments in which a steady pressure gradient significantly larger than the radiation force was exerted upon the dye in the diffusion chamber. No discernible motion was observed, reinforcing the premise that ultrasound-enhanced drug delivery was primarily, on a macroscopic level, a matter of porosity changes. Because the porosity increases markedly when the ultrasound intensity increases beyond a threshold - about 1 W/cm2 for the present conditions (ultrasound frequency, gas content in the fluid, equilibrium pressure…), a likely explanation for the porosity changes is inertial cavitation in the fluid adjacent to the epithelium (Zderic et al. 2004). Radiation force may have played a secondary role in the observed increase in dye flow, pushing the dye through enlarged passageways created by cavitation.
The time delay occurring in the transport experiments presumably represents the duration over which the transient, wetting flow fills the air-filled pores in the rabbit cornea or nylon filter. Once the surfaces of the porous media were wetted, transport occurred at a faster rate, due to diffusion through the liquid-filled pores. In retrospect, modeling the time delay may have been avoidable if efforts had been made to hydrate the cornea throughout the experimental process. Hyrdration throughout the entire preparation might prove challenging, as the surgical extraction of the cornea from the whole eye is a delicate process. In any event, it is worth trying in future experiments, such as those performed to calibrate the model at other ultrasound frequencies. The time delay determined by the model could not be compared in a precise manner with experimental observations, since the delay as defined by immeasurable drug concentration is a function of the resolution of the spectrophotometer, in addition to the wetting behavior within the cornea. The time delay, while physically interesting, would not likely be an important factor in clinical procedures involving human eyes, as a high moisture level within the cornea would likely be maintained.
The nylon filter experiments provided a measure of validation for the computational model. As noted above, the drug mimicking compound in the receiver chamber could not be sampled rapidly enough to enable the transient nature of the flux through the filter to be resolved. This loss of information precluded a unique 3-dimensional search. However, the algorithm operating as a 2-parameter optimization showed reasonable agreement with experimental porosity measurements. The agreement with the analytical expression for drug transport also provided verification that the finite-element implementation of the diffusion equation and boundary conditions was correct.
The sensitivity study revealed that the general conclusions drawn regarding the effect of ultrasound on transcorneal drug delivery were not highly sensitive to the parameter values selected. The largest change in porosity ratio, from 5.4 to 7.0, resulted from an order-of-magnitude change in the endothelial porosity. As evidenced by the small numbers in the last column of Table 3, changes in the factors affecting the porosity resulted in smaller relative changes in the porosity than those occurring in the parameters themselves.
The finite-element approach used in the computations was not necessary, given the simple geometry. The authors were familiar with the computer code from previous applications involving diffusive transport, and chose the code to leverage the extensive verification that has been previously performed. However, the large number of calls (on the order of 125) by the optimization routine to the diffusion-equation solver was not anticipated. In future studies, a simpler and faster diffusion-equation solver will be advantageous in reducing the roughly 15 hours of execution time required for the optimization routine to complete.
The simulations involving the transport of macromolecules illustrated one practical application of the model. The predicted increase in drug transported, or the predicted decrease in treatment time, carries the uncertainty associated with extrapolating the results from a rabbit to a human. With regard to this extrapolation, we can say that Ojeda et al. (2001) concluded that the microanatomy of the epithelium in the rabbit and human showed no significant differences. Differences were found in the epithelial basement layer and deeper layers. Given this similarity, if the premise of the present model that porosity changes are confined to the epithelium is correct, then the calculations involving the macromolecules may provide clinically useful estimates. However, the primary purpose of the calculations was to show how the model can compute the ultrasound-enhanced transport for a second drug if the transport for the first drug is known, knowing only the molecular diffusivity of the drugs. The molecular diffusivity is a quantity that can be easily measured.
In order for the model to reach its full predictive potential, experimental calibration at ultrasound frequencies other than 800 kHz is required. Additionally, as described above, the influence of ultrasound beam width relative to the area of the drug layer applied to the cornea must be quantified. When such data is available, the porosity data could be fit to a function having a form something like φ/φ0 = A exp(B × I), where I is the intensity and A and B are fitting parameters that are functions of frequency. It may be also possible to combine the intensity and frequency dependences into a single parameter, such as a mechanical index. Additionally, the change in thickness of the epithelial layer would need to be more broadly quantified through experiments at other frequencies, as the threshold for cavitation is a strong function of frequency. While the epithelial-layer length changes would not have a strong influence on the drug-transport computations, they could be related to the safety of the procedure, and provide useful information for risk/benefit calculations.
As noted in the Introduction section, the model presently applies only to cases in which the most important transport mechanism is diffusion of compound through the gaps between cells in the epithelium (paracellular transport). In that case, the porosity parameter is able to characterize the critical change induced by the ultrasound, namely an increase in the intracellular spacing in the epithelium. In the opposite case where transport occurs primarily by transcellular motion, e.g. for hydrophobic or lipophilic drugs (Edwards and Prausnitz 2001), the stroma becomes the layer limiting the rate of transport (Edwards and Prausnitz 2001). The computational model could be applied to this case as well, though (owing to the complicated nature of transcellular transport) the effective diffusivity determined by the algorithm might not have a simple relation to the molecular diffusivity, as in Eq. (1b). For mixtures of both paracellular transport and transcelluar transport, two parameters characterizing each type of transport would potentially be required for each of the three layers. The optimization algorithm would then have to resolve 8 parameters (including delay times and an epithelial thickness), a considerable challenge. However, many of them may prove insensitive to the effects of ultrasound. Experiments involving the transport of lipophilic or hydrophobic drugs in the presence of ultrasound are required to resolve this question.
Conclusion
The computational model developed in this study is capable of accurately modeling changes in porosity observed in rabbit cornea due to ultrasound exposure. The model utilizes a porous-medium approach to simulating the structure of the cornea, with the epithelial thickness and porosity being functions of ultrasound intensity. For the 800 kHz ultrasound frequency, a substantial increase in epithelial porosity at an ultrasound intensity of about 1 W/cm2 is contained in the model. This rapid increase is likely due to presence of cavitation occurring under the present exposure conditions. When calibrated using further experiments at other ultrasound frequencies, the model has the potential to provide valuable information for pre-treatment planning, including the amount of drug transported through the cornea relative to other drugs, and the time required to reach therapeutic dose at locations of interest.
Figure 3.
Inverse methodology used to determine the epithelial thickness and porosity of the rabbit cornea
Acknowledgments
This work was partially supported through NIH R21 grant (NIH5R21EY01873702).
Appendix
Investigation into Radiation Force as a Transport Mechanism
The computational model does not treat radiation-force as a transport mechanism, other than to the extent that radiation force alters the porosity. Radiation force on the dye could also lead to an acoustic streaming field, i.e. steady flow of dye arising due to the absorption of ultrasound energy. Since it is difficult to separate the effect of radiation force and cavitation during ultrasound exposure, we mimicked the effect of radiation force with a static pressure gradient, in the following sense. Acoustic streaming is produced by an attenuated sound wave, for which the driving force on the fluid varies continuously with axial distance. This continuous variation cannot be modeled with a static pressure gradient. However, the average driving pressure generated by the attenuated sound wave, over the thickness of the cornea, can be measured and simulated with a static pressure, just to determine whether pressures of that magnitude produce measureable fluid motion. So a pressure gradient equal to and greater than that generated by the radiation force was imposed on the cornea.
The effective pressure gradient established in a liquid due to absorption of ultrasound energy is α I/c0 (Lighthill 1978), where α is the acoustic absorption in the liquid, I the ultrasound intensity, and c0 the speed of sound in the liquid. Assuming an absorption in sodium fluorescein solution comparable to that of water, 0.02 m−1, an intensity of 1 W/cm2, and a sound speed of 1500 m/sec, we obtain a pressure gradient of approximately 0.2 Pa/m. In the static-pressure experiments, a range of pressure gradients beginning at this value and extending orders of magnitude higher were considered. The donor chamber (Fig.1) was connected to a 2m long glass tube, and the tube was filled with the sodium fluorescein solution (of 0.25–0.5% concentration) to various heights. The top of the glass tube and the receiver chamber of apparatus were open to atmosphere, making the pressure across the cornea equal to that due to the weight of the column of sodium fluorescein solution. The pressure gradient was this pressure divided by the thickness of the cornea, 0.5 mm. At the maximum compound solution-column height of 60 cm, the pressure gradient across the cornea was on the order of 107 Pa/m. For each of the column heights considered, the compound concentration in the receiver chamber was recorded as a function of time.
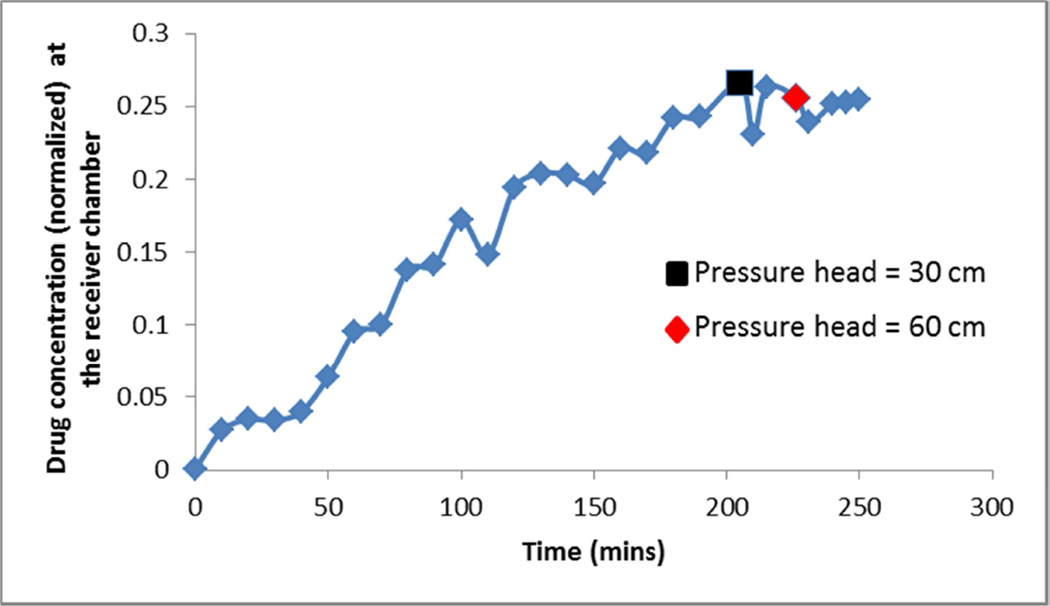
In Fig. 9, the amount of sodium fluorescein measured in the receiver chamber is plotted for 3 different pressure differentials. For the majority of the 4-hour recording period, the driving pressure was simply the slight pressure due to the height of the liquid in the donor chamber of the diffusion cell. After 200 minutes, a column of 30 cm of the sodium fluorescein mixture was imposed. For the subsequent 30 minutes, no change was measured in the amount of compound transported to the receiver chamber. After 230 minutes, a driving pressure due to 60 cm of sodium fluorescein mixture was imposed. Measurements for 40 minutes at this highest pressure showed no change in the concentration trace relative to that for the baseline pressure head.
Figure 9.
Normalized drug concentration in the receiver chamber at a function of time, in an experiment using a static pressure to mimic radiation force.
Footnotes
Publisher's Disclaimer: This is a PDF file of an unedited manuscript that has been accepted for publication. As a service to our customers we are providing this early version of the manuscript. The manuscript will undergo copyediting, typesetting, and review of the resulting proof before it is published in its final citable form. Please note that during the production process errors may be discovered which could affect the content, and all legal disclaimers that apply to the journal pertain.
References
- Ahmed I, Patton TF. Disposition of Timolol and Inulin in the Rabbit Eye Following Corneal Versus Non-Corneal Absorption. International Journal of Pharmaceutics. 1987;38:9–21. [Google Scholar]
- Atchley AA, Frizzell LA, Apfel RE, Holland CK, Madanshetty S, Roy RA. Thresholds for cavitation produced in water by pulsed ultrasound. Ultrasonic. 1988;26(5):280–285. doi: 10.1016/0041-624x(88)90018-2. [DOI] [PubMed] [Google Scholar]
- Carslaw HS, Jaeger JC. Conduction of Heat in Solids. Clarendon Press; 1986. [Google Scholar]
- Casalini T, Salvalaglio M, Perale G, Masi M, Cavallotti C. Diffusion and aggregation of sodium fluorescein in aqueous solutions. J Phys Chem B. 2011;115:12896–12904. doi: 10.1021/jp207459k. [DOI] [PubMed] [Google Scholar]
- Castellanos IMS, Jeremic A, Zderic V. Ultrasound stimulation of insulin release from pancreatic beta cells as a potential novel treatment for type 2 diabetes. Revised manuscript submitted to Ultrasound in Medicine and Biology. 2016 doi: 10.1016/j.ultrasmedbio.2017.01.007. [DOI] [PMC free article] [PubMed] [Google Scholar]
- Cooper ER, Kasting G. Transport across epithelial membranes. Journal of Controlled Release. 1987;6:23–35. [Google Scholar]
- Davies NM. Biopharmaceutical considerations in topical ocular drug delivery. Clin Exp Pharmacol Physiol. 2000;27:558–562. doi: 10.1046/j.1440-1681.2000.03288.x. [DOI] [PubMed] [Google Scholar]
- Doane MG, Jensen AD, Dohlman CH. Penetration routes of topically applied eye medications. Am J Ophthalmol. 1978;85:383–386. doi: 10.1016/s0002-9394(14)77735-9. [DOI] [PubMed] [Google Scholar]
- Edwards A, Prausnitz MR. Fiber Matrix Model of Sclera and Corneal Stroma for Drug Delivery to the Eye. Am. Inst of Chem. Eng. Journal. 1998;44:214–225. [Google Scholar]
- Edwards A, Prausnitz MR. Predicted permeability of the cornea to topical drugs. Pharmaceutical Research. 2001;18:1497–1508. doi: 10.1023/a:1013061926851. [DOI] [PubMed] [Google Scholar]
- Farrell, editor. One-Dimensional radial diffusion of small molecules (376 Da) in bone tissue. 2009 [Google Scholar]
- FIDAP Theory Manual ver. 8.6.2. Fluent Inc; 2002. [Google Scholar]
- Fu BM, Adamson RH, Curry FE. Test of a two-pathway model for small-solute exchange across the capillary wall. Am J Physiol. 1998;274:H2062–H2073. doi: 10.1152/ajpheart.1998.274.6.H2062. [DOI] [PubMed] [Google Scholar]
- Gaudana R, Ananthula HK, Parenky A, Mitra AK. Ocular drug delivery. AAPS J. 2010;12:348–360. doi: 10.1208/s12248-010-9183-3. [DOI] [PMC free article] [PubMed] [Google Scholar]
- Ghate D, Edelhauser HF. Barriers to glaucoma drug delivery. J Glaucoma. 2008;17:147–156. doi: 10.1097/IJG.0b013e31814b990d. [DOI] [PubMed] [Google Scholar]
- Gwon A. Chapter 13 - The Rabbit in Cataract/IOL Surgery. In: Tsonis PA, editor. Animal Models Eye Research. London: Academic Press; 2008. pp. 184–204. [Google Scholar]
- Hariharan P, Myers MR, Robinson RA, Maruvada SH, Sliwa J, Banerjee RK. Characterization of high intensity focused ultrasound transducers using acoustic streaming. J Acoust Soc Am. 2008;123:1706–1719. doi: 10.1121/1.2835662. [DOI] [PubMed] [Google Scholar]
- Hobbie RK. Wiley Press; 1978. Intermediate Physics for Advanced Biology. [Google Scholar]
- Kaye GI, Pappas GD. Studies on the cornea. I. The fine structure of the rabbit cornea and the uptake and transport of colloidal particles by the cornea in vivo. J Cell Biol. 1962;12:457–479. doi: 10.1083/jcb.12.3.457. [DOI] [PMC free article] [PubMed] [Google Scholar]
- Ke TL, Clark AF, Gracy RW. Age-related permeability changes in rabbit corneas. J Ocul Pharmacol Ther. 1999;15:513–523. doi: 10.1089/jop.1999.15.513. [DOI] [PubMed] [Google Scholar]
- Lee Y-S, Hamilton MF. "Time-domain modeling of pulsed finite-amplitude sound beams". J. Acoust. Soc. Am. 1995;97:906–917. [Google Scholar]
- Li HF, Petroll WM, MollerPedersen T, Maurer JK, Cavanagh HD, Jester JV. Epithelial and corneal thickness measurements by in vivo confocal microscopy through focusing (CMTF) Current Eye Research. 1997;16:214–221. doi: 10.1076/ceyr.16.3.214.15412. [DOI] [PubMed] [Google Scholar]
- Lighthill J. Acoustic Streaming. Journal of Sound and Vibration. 1978;61:391–418. [Google Scholar]
- Nabili M. Ph.D. dissertation. George Washington University; 2013. Ultrasound-enhanced Delivery of Antibiotics and Anti-inflammatory Drugs into the Eye. [DOI] [PMC free article] [PubMed] [Google Scholar]
- Nabili M, Patel H, Mahesh SP, Liu J, Geist C, Zderic V. Ultrasound-Enhanced Delivery of Antibiotics and Anti-Inflammatory Drugs into the Eye. Ultrasound in Medicine and Biology. 2013;39:638–646. doi: 10.1016/j.ultrasmedbio.2012.11.010. [DOI] [PMC free article] [PubMed] [Google Scholar]
- Nabili M, Shenoy A, Chawla S, Mahesh S, Liu J, Geist C, Zderic V. Ultrasound-enhanced ocular delivery of dexamethasone sodium phosphate: an in vivo study. J Ther Ultrasound. 2014;2:6. doi: 10.1186/2050-5736-2-6. [DOI] [PMC free article] [PubMed] [Google Scholar]
- Nugent LJ, Jain RK. Extravascular diffusion in normal and neoplastic tissues. Cancer Res. 1984;44:238–244. [PubMed] [Google Scholar]
- Nuritdinov VA. Phonophoresis and cavitation. Vestn Oftalmol. 1981:56–58. [PubMed] [Google Scholar]
- Ojeda JL, Ventosa JA, Piedra S. The three-dimensional microanatomy of the rabbit and human cornea. A chemical and mechanical microdissection-SEM approach. J. Anat. 2001;199:567–576. doi: 10.1046/j.1469-7580.2001.19950567.x. [DOI] [PMC free article] [PubMed] [Google Scholar]
- Overby D, Ruberti J, Gong HY, Freddo TF, Johnson M. Specific hydraulic conductivity of corneal stroma as seen by quick-freeze/deep-etch. Journal of Biomechanical Engineering-Transactions of the Asme. 2001;123:154–161. doi: 10.1115/1.1351888. [DOI] [PubMed] [Google Scholar]
- Paliwal S, Mitragotri S. Ultrasound-induced cavitation: applications in drug and gene delivery. Expert Opin Drug Deliv. 2006;3:713–726. doi: 10.1517/17425247.3.6.713. [DOI] [PubMed] [Google Scholar]
- Panova IGFV, Petrishcheva TS, Fridman FE. A pharmacokinetic study of para-aminobenzoic acid administered into the rabbit eye by phonophoresis. Izv Akad Nauk Ser Biol. 1995;4:487–489. [PubMed] [Google Scholar]
- Periasamy N, Verkman AS. Analysis of fluorophore diffusion by continuous distributions of diffusion coefficients: application to photobleaching measurements of multicomponent and anomalous diffusion. Biophys J. 1998;75:557–567. doi: 10.1016/S0006-3495(98)77545-9. [DOI] [PMC free article] [PubMed] [Google Scholar]
- Prausnitz MR, Noonan JS. Permeability of cornea, sclera, and conjunctiva: a literature analysis for drug delivery to the eye. J Pharm Sci. 1998;87:1479–1488. doi: 10.1021/js9802594. [DOI] [PubMed] [Google Scholar]
- Reiser BJ, Ignacio TS, Wang YM, Taban M, Graff JM, Sweet P, Chen ZP, Chuck RS. In vitro measurement of rabbit corneal epithelial thickness using ultrahigh resolution optical coherence tomography. Veterinary Ophthalmology. 2005;8:85–88. doi: 10.1111/j.1463-5224.2005.00345.x. [DOI] [PubMed] [Google Scholar]
- Tsok RM. Phonophoresis in various diseases of the anterior segment of the eye. Oftalmol Zh. 1979;34:73–76. [PubMed] [Google Scholar]
- Tsonis PA. Animal models in eye research. Elsevier. 2008 [Google Scholar]
- Shih RL, Lee VH. Rate limiting barrier to the penetration of ocular hypotensive beta blockers across the corneal epithelium in the pigmented rabbit. J Ocul Pharmacol. 1990;6:329–336. doi: 10.1089/jop.1990.6.329. [DOI] [PubMed] [Google Scholar]
- Van Der Bijl P, Engelbrecht AH, Van Eyk AD, Meyer D. Comparative permeability of human and rabbit corneas to cyclosporin and tritiated water. J Ocul Pharmacol Ther. 2002;18:419–427. doi: 10.1089/10807680260362704. [DOI] [PubMed] [Google Scholar]
- Wang L, Wang Y, Han Y, Henderson SC, Majeska RJ, Weinbaum S, Schaffler MB. In situ measurement of solute transport in the bone lacunar-canalicular system. Proc Natl Acad Sci U S A. 2005;102:11911–11916. doi: 10.1073/pnas.0505193102. [DOI] [PMC free article] [PubMed] [Google Scholar]
- Zderic V, Clark JI, Martin RW, Vaezy S. Ultrasound-enhanced transcorneal drug delivery. Cornea. 2004;23:804–811. doi: 10.1097/01.ico.0000134189.33549.cc. [DOI] [PubMed] [Google Scholar]
- Zderic V, Clark JI, Vaezy S. Drug delivery into the eye with the use of ultrasound. J Ultras Med. 2004;23:1349–1359. doi: 10.7863/jum.2004.23.10.1349. [DOI] [PubMed] [Google Scholar]


