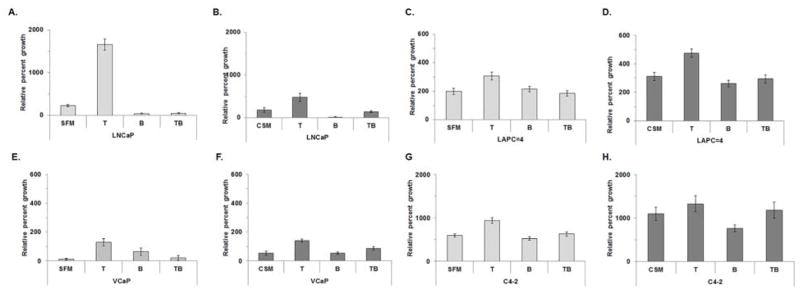
Figure 3. Bicalutamide treatment using SFM or CSM blunted T-stimulated growth in LNCaP, LAPC-4, VCaP or C4-2 cells.
LNCaP (A and B), LAPC-4 (C and D), VCaP (E and F) or C4-2 (H and I) cells were cultured in SFM or CSM alone or SFM or CSM with 1 nM T, SFM or CSM with 10 μM bicalutamide (B) or SFM or CSM with 1 nM T and 10 μM B. Cell growth was measured on days 0 and 6 using MTT assay read at OD590. Data were presented as mean +/− SEM. P-values for statistical comparisons of cell growth between Day 0 and Day 6 were listed in Supplemental Table S4. Cell growth comparisons among T and B and SFM vs. CSM treatments were listed in Supplemental Table S4.

