

Summary
Here, we show that HEMATOLOGICAL AND NEUROLOGICAL EXPRESSED 1-LIKE (HN1L) is a targetable breast cancer stem cell (BCSC) gene that is altered in 25% of whole breast cancer and significantly correlated with shorter overall or relapse-free survival in triple-negative breast cancer (TNBC) patients. HN1L silencing reduced the population of BCSCs, inhibited tumor initiation, resensitized chemoresistant tumors to docetaxel, and hindered cancer progression in multiple TNBC cell line-derived xenografts. Additionally, gene signatures associated with HN1L correlated with shorter disease-free survival of TNBC patients. We defined HN1L as a BCSC transcription regulator for genes involved in the LEPR-STAT3 signaling axis as HN1L binds to a putative consensus upstream sequence of STAT3, LEPTIN RECEPTOR, and MIR-150. Our data reveal that BCSCs in TNBC depend on the transcription regulator HN1L for the sustained activation of the LEPR-STAT3 pathway, which makes it a potentially important target for both prognosis and BCSC therapy.
Keywords: HN1L, LEPR, STAT3, TNBC, cancer stem cells
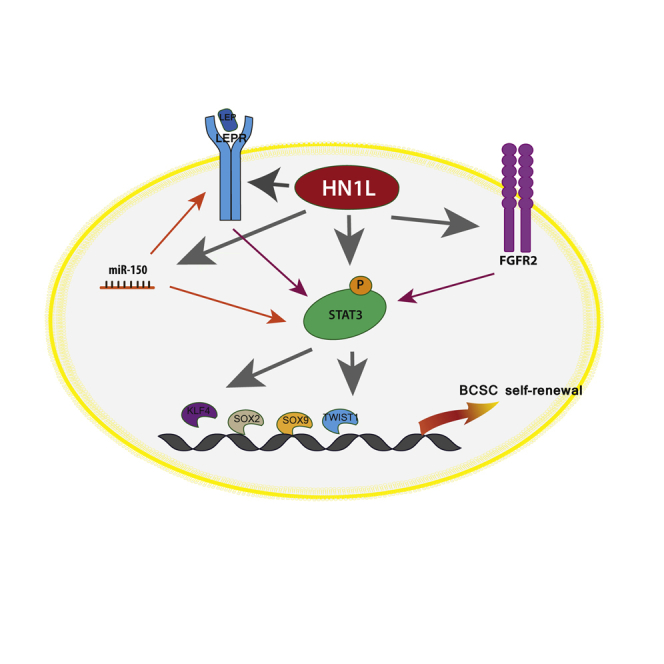
Graphical Abstract
Highlights
-
•
HN1L expression is correlated with shorter survival of TNBC patients
-
•
HN1L regulates BCSCs by promoting the STAT3 signaling pathway
-
•
HN1L: novel transcription regulator of LEPR and miR-150, upstream regulators of STAT3
-
•
HN1L-regulated gene signatures can predict clinical outcomes in TNBC patients
Yi et al. describe HN1L as a novel transcription regulator for breast cancer stem cells (BCSCs) in triple-negative breast cancer (TNBC), promoting LEPR and miR-150 expression and activating the STAT3 pathway. Since BCSCs contribute to chemoresistance and metastasis in TNBC, further investigation of HN1L will offer new therapeutic strategies.
Introduction
Triple-negative breast cancer (TNBC), which accounts for 15%–20% of breast cancer cases, is a challenging disease to treat because of tumor heterogeneity, intrinsic resistance to conventional chemotherapy, and lack of targeted therapies (Arnedos et al., 2012, Metzger-Filho et al., 2012). Although optimization of currently available chemotherapeutic agents for TNBC patients has improved patient outcome, novel targeted therapies are urgently needed to improve patient survival (Liedtke and Rody, 2015). Since their discovery through genetic “lineage retracing” in squamous skin tumors, glioblastomas (GBM), and intestinal adenomas, cancer stem cells (CSCs) within the bulk tumor have been associated with multiple phenotypes including chemoresistance, clonogenic potential, and hierarchical tumor growth (Driessens et al., 2012, Chen et al., 2012, Schepers et al., 2012). In this study, we investigated a breast cancer stem cell (BCSC) gene signature, focusing on genes responsible for cancer stem cell self-renewal, and identified HN1L as a gene critical for BCSC maintenance.
We have previously published a BCSC gene signature by comparing CSCs and non-CSCs isolated from patient biopsies (Creighton et al., 2009, Dave et al., 2014). This approach narrowed down the number of genes that may influence CSC growth from a genome-wide level to only 493 genes. We then identified 13 genes to be CSC-regulating genes, by screening the effects of short hairpin RNA (shRNA) gene silencing on the mammosphere-forming ability of TNBC cell lines. We recently reported the CSC-regulating roles of RPL39 and MLF2, two candidate genes among the 13 CSC genes (Dave et al., 2014).
HN1L is one of the top 13 CSCs genes whose functions have not been well characterized (Mitchell et al., 2015). Previously, HN1L, also known as L11, was reported with another 18 uncharacterized genes to be overexpressed in non-small-cell lung cancer (Petroziello et al., 2004). In the report, L11 overexpression was identified in various cancer types, but the highest expression was found in breast and uterine cancer. While HN1L also contributes to embryonic development (Zhou et al., 2004), not much is known about its cellular function since it has no homology with existing protein domain sequences (Mitchell et al., 2015). Here, we describe the essential role of HN1L in BCSC maintenance and explore its mechanism of action in this context. A comprehensive evaluation of HN1L function in patient-derived xenograft (PDX) tumors reveals that multiple pathways are regulated by HN1L, in which STAT3 signaling is the key mediator. Taken as a whole, our data reveal the crucial upstream role that HN1L plays in promoting multiple cellular survival pathways via influence on the BCSC transcriptome.
Results
High HN1L Expression Correlates with Poor Prognosis in TNBC
HN1L is one of the top candidate genes among the selected 13 genes (Table S1), whose gene silencing significantly reduced the mammosphere-forming ability of MDA-MB-231 cells (Figure S1). Thus, we decided to investigate the expression patterns of HN1L in TCGA breast cancer patient database with RNA sequencing (RNA-seq) information. Among the 960 breast cancer patients, approximately 25% of patients have alterations in the HN1L gene, consisting of mostly mRNA upregulation or gene copy number amplifications (Figure 1A). We also found that breast tumors express significantly higher levels of HN1L mRNA compared with normal breast tissue (Figure 1B). Interestingly, we found, using the TCGA dataset, that the overexpression of HN1L was correlated with shorter patient survival (p = 0.0368) only in TNBC (Figure 1C), while no survival difference was seen in non-TNBC (Figure S2A). We confirmed the similar survival correlation between HN1L expression and the shorter survival trend in TNBC patients using the Curtis patient dataset (Figures S2B and S2C). Additionally, using the previously reported TNBC cohorts (Chen et al., 2014), we confirmed that TNBC patients with high levels of HN1L had shorter relapse-free survival than patients with low HN1L levels (p < 0.01) (Figure 1D). These results demonstrate that HN1L is upregulated in breast cancer and that its enhanced expression correlates with poor clinical outcomes in TNBC patients. Moreover, we recently identified two missense mutations in HN1L (P20L and A106V; Table S2) from previously published RNA-seq data (Dave et al., 2014). Based on these findings, we recognized HN1L as a potential therapeutic target and chose to study its role in TNBC in greater detail.
Figure 1.

Enhanced Expression of HN1L Correlates with Poor Clinical Outcome in TNBC Patients
(A) Data acquired from cBioPortal for Cancer Genomics showed HN1L alteration in 960 breast cancer patients.
(B) The expression of HN1L mRNA is higher in breast tumors than in normal samples (p < 0.0001) in both TCGA and Curtis breast cancer gene expression databases.
(C and D) Higher HN1L expression portends significantly poorer overall survival in TCGA TNBC patients (C) and relapse-free survival of previously published TNBC patients (D) (Rody et al., 2011, Chen et al., 2014).
Error bars represent the SD.
Silencing HN1L Reduces the CSC Population in TNBC Cell Lines
We then confirmed that protein levels of HN1L were higher in CSC-enriched populations, compared with non-CSCs. CD44+/CD24−/low population in sorted SUM159 cells only, but not in MDA-MB-231, as more than 90% cells in the MDA-MB-231 cell line are CD44+/CD24−/low (Figure 2A). Also, TNBC cell lines with stable HN1L gene silencing showed reduced CD44+/CD24−/low population and impaired mammosphere-forming ability (MSFE), implying that HN1L may play a significant role in maintaining CSCs (Figures 2B–2D). Knockdown of HN1L also impaired cell migration as analyzed by a transwell assay (Figure 2E). To better represent the 3D tumor microenvironment, we first allowed MDA-MB-231 cells to form spheroids and then embedded them in Matrigel, permitting only invasive cells to invade. Stable HN1L knockdown cells remained as cell aggregates without invasion into the surrounding matrix, while control cells were more invasive and formed spindle-like protrusions (Figure 2F). No invasion was observed in either control or HN1L gene knockdown SUM159 cells (data not shown). In addition, we further confirmed the gene silencing effect (of HN1L) on the CD44+/CD24−/low population and MSFE of three TNBC cell lines using small interfering RNAs (siRNAs) targeting two different regions of HN1L (Figures S3A–S3C). These results suggest that HN1L may have an important role in multiple CSC functions, including cell migration and invasion.
Figure 2.

HN1L Is Overexpressed and Required for BCSCs
(A) BCSCs were enriched by either flow sorting (CD44+/CD24−/low) or forming mammospheres. Increased HN1L levels were detected in the BCSC-enriched population by immunoblotting. Others, all other cell populations except the CD44+/CD24−/low BCSC population; MS, mammosphere; PT, prantel cells. β-Actin served as a loading control. n = 3 independent experiments.
(B) Western blot showing HN1L knockdown by shRNA in TNBC cell lines. n = 3 independent experiments.
(C) HN1L shRNA transduction decreased CD44+/CD24−/low population upon flow-cytometry analysis. n = 3 independent experiments with 3 technical replicates; ∗p < 0.05.
(D) HN1L shRNA transduction reduced MSFE. n = 3 independent experiments with 6 technical replicates; ∗p < 0.05.
(E and F) HN1L shRNA transduction reduced cell migration (E) and 3D cancer invasion (F). n = 3 independent experiments with 3 technical replicates; ∗p < 0.05.
Error bars represent the SD.
Increase in the Cancer Stem Cell Population with HN1L Overexpression In Vitro
Because depletion of HN1L reduced CSC function, we hypothesized that HN1L overexpression in SUM159 and MDA-MB-468 cells would also increase CSCs. Indeed, overexpression of FLAG-tagged HN1L significantly increased the CD44+/CD24−/low population from 66% to 87% in SUM159 cells (p < 0.0001) and from 2.3% to 7.6% in MDA-MB-468 cells (p < 0.0001), when compared with the respective control cells transfected with empty vector. The MDA-MB-231 cell line was not used because more than 90% of cells are CD44+/CD24−/low (Figure 3A). The increased BCSC population, via HN1L overexpression, was positively correlated with increased MSFE (Figure 3B) and decreased sensitivity to docetaxel (Figure 3C). MDA-MB-468 cells were equally sensitive to docetaxel regardless of the overexpression of HN1L. Additionally, we observed enhanced cell migration and invasion with HN1L overexpression, which was subsequently decreased to control levels by the co-transfection of siRNAs against HN1L in three different cell lines (Figure 3D). Immunoblotting confirmed the overexpression of FLAG-HN1L and also its siRNA-mediated knockdown (Figure 3E) over the 72 hr of experimental duration. Cells transfected with the overexpression plasmid and the scrambled siRNAs served as a control for overexpressed HN1L at 72 hr and were compared with cells co-transfected with the overexpression plasmid and the silencing siRNAs for HN1L (Figure 3E). These results indicate that increased HN1L expression induced the CD44+/CD24−/low population, increased MSFE and invasive potential, and generated chemoresistance in the cancer cells.
Figure 3.

HN1L Overexpression Increases the BCSC Population In Vitro
TNBC cells were transfected with a plasmid to overexpress Myc-DDK tagged HN1L.
(A) Flow analysis revealed that the CD44+/CD24−/low population increased with HN1L overexpression (OE) after 48 hr. n = 3 independent experiments with 3 technical replicates. ∗∗∗p < 0.001. The data present average results of three biological repeats with SD.
(B) Secondary MSFE increased with HN1L overexpression. n = 3 independent experiments with 12 technical replicates.
(C) Cells with or without HN1L overexpression were treated with varying doses of docetaxel for 48 hr. MTT assays showed decreased sensitivity of HN1L-overexpressed cells to docetaxel treatment. ∗p < 0.05, ∗∗p < 0.01, ∗∗∗p < 0.001. n = 3 independent experiments with 8 technical replicates.
(D) HN1L overexpression increased cell motility, which was inhibited by the simultaneous HN1L gene silencing (∗p < 0.05). n = 3 independent experiments with 3 technical replicates.
(E) Both endogenous HN1L and overexpressed Myc-DDK(FLAG)-tagged HN1L levels were detected after overexpression and then were reduced with HN1L siRNA treatment by 48 hr. β-Actin served as a loading control. Cell migration/invasion in BME-coated Boyden chambers was examined. EV, empty mock plasmid; OE-HN1L, HN1L overexpression plasmid; siScr, scrambled siRNA; HN1L siRNA, siRNA against HN1L.
Error bars represent the SD.
HN1L Depletion Reduces the Cancer Stem Cell Population and Lung Metastasis In Vivo
We examined the treatment efficacy of HN1L siRNA in MDA-MB-231 and SUM159 TNBC cell line xenograft tumor models. Neutral 1,2-dioleoyl-sn-glycero-3-phosphatidylcholine (DOPC) nanoliposomes were used for efficient in vivo siRNA delivery (Tanaka et al., 2010, Tekedereli et al., 2012). We initially treated MDA-MB-231 tumor-bearing mice with HN1L liposomal siRNA for a short-term study of 21 days. We confirmed the in vivo gene silencing effects using immunohistochemistry (Figure S3D). Significant reductions in tumor volume, CD44+/CD24−/low population, and secondary MSFE were observed with HN1L knockdown (Figures 4A–4C), and a statistically non-significant decrease in ALDF+ cells was also apparent (Figure S3E). Similar results were observed in the SUM159 xenograft model (Figures S3F–S3H). We confirmed with a limiting dilution assay (LDA) that HN1L is critical for maintenance of BCSCs in TNBC. The gene silencing by HN1L siRNA-DOPC decreased the BCSC frequencies in MDA-MB-231 cells about 2- to 3-fold compared with the scrambled siRNA-DOPC as measured by these LDAs(Figure 4D).
Figure 4.

HN1L siRNA Treatment in MDA-MB-231 Xenografts and BCM2665 Patient-Derived Xenografts Decreases BCSC Function
MDA-MB-231 cells were injected, and BCM2665 tumor pieces were orthotopically transplanted into SCID-Beige mice. Mice (n = 10 per group) were injected with the respective DOPC liposomal siRNA (scrambled siRNA or HN1L siRNA) by intraperitoneal injection at 5 μg/injection twice a week (A and E). Tumor volumes were measured twice per week for 3 weeks, and tumors were collected after euthanizing animals for fluorescence-activated cell sorting analysis of CD44+/CD24−/low (B) or ALDF + CSCs (F). The remaining tumor cells were used to assess mammosphere-forming ability (C and G). Another set of animals with BCM2665 tumors were randomized into three groups (n = 15): docetaxel + vehicle (PBS), docetaxel + scrambled siRNA, docetaxel + HN1L siRNA (H). siRNAs were delivered by intraperitoneal injection at 5 μg/injection twice a week for 6 weeks. All animals received docetaxel (33.3 mg/kg at days 1, 15, and 30). At the end of the study, tumors were collected from euthanized mice and subjected to limiting dilution assays (D and I).
Error bars in (B), (C), (F), and (G) represent the SD. Error bars in (A), (E), and (H) represent the SEM. ∗p < 0.05.
We further evaluated the effects of silencing HN1L on BCSCs using a patient-derived TNBC xenograft model, BCM2665, with known drug resistance to docetaxel up to 20 mg/kg (Zhang et al., 2013, Dave et al., 2014). Unlike the cell line tumor models, HN1L siRNA-DOPC as a single agent did not affect tumor volume in a 21-day study (Figure 4E), although we confirmed the gene silencing effect by western blot analysis of tumors from each treatment group (Figure S4A). This result is likely due to the fact that the proportion of BCSCs in primary PDX tumors is low compared with cell lines such as MDA-MB-231. Previously, CSC in BCM2665 was defined by the ALDF and MSFE due to lack of CD44+/CD24−/low subpopulation (Dave et al., 2014). Despite there being no effect on tumor growth, we observed a reduction of the ALDF+ population and a significant decrease in MSFE at the end of HN1L siRNA treatment (Figures 4F and 4G), suggesting an effect on BCSC self-renewal function. Based on these results, we examined whether silencing HN1L would increase the sensitivity of drug-resistant BCM2665 to docetaxel (33.3 mg/kg) by targeting the BCSC subpopulation. As expected, the combination of HN1L siRNA-DOPC and docetaxel significantly inhibited tumor growth compared with docetaxel treatment alone (Figure 4H). Using an LDA, we confirmed that the synergistic effect of the combination treatment with a reduction in BCSC subpopulation. Tumors transplanted after the combination treatment showed a significant decline in BCSCs as indicated by decreased rates of tumor initiation and BCSC frequency by these assays (Figure 4I). Additionally, combination treatment with a lower docetaxel dose schedule (20 mg/kg) sensitized MDA-MB-231 cells to chemotherapy. While docetaxel alone did not significantly affect tumor growth, the combination treatment caused a statistically significant tumor growth delay (Figure S4B).
BCSCs have been found to drive metastasis (Liu et al., 2010, Liu et al., 2014). We investigated whether suppression of HN1L was able to impair lung metastasis in TNBC xenografts using a luciferase-tagged MDA-MB-231 cell line that develops spontaneous lung metastases from the orthotopically transplanted primary tumor (Choi et al., 2014). HN1L siRNA-DOPC was administered as either a single agent or in combination with docetaxel. The results indicated that delivery of HN1L siRNA-DOPC alone (or in combination with docetaxel) reduced tumor burden in lungs compared with scrambled siRNA (or scrambled siRNA with docetaxel) and significant reduction was seen only for the combination treatment (Figure S4C). These results suggest that HN1L inhibition not only decreased the BCSC population and increased chemosensitivity, but also reduced metastasis from primary tumors to lungs in vivo. Altogether, these data indicate that HN1L is a promising target for patients with TNBC for whom chemotherapy is the only option.
Inhibition of HN1L Is Associated with Better TNBC Patient Prognosis
Since HN1L depletion reduces cancer burden in our models, we sought to determine genes that may be influenced by the absence of HN1L. The corresponding gene signature could then be correlated with patient survival to determine whether the altered gene set can predict prognosis. To explore gene expression profiles when HN1L expression is silenced, we performed microarray analysis on BCM2665 tumor samples from scrambled siRNA- and HN1L siRNA-treated xenografts (n = 10). This analysis identified 74 upregulated and 62 downregulated genes under HN1L knockdown conditions (fold change > 1.5, p < 0.05) (Figure 5A). This altered gene set was defined as the HN1L knockdown gene signature. On applying this gene signature to the 383-patient cohort, we found that patients with an activated HN1L knockdown gene signature demonstrated a significantly longer relapse-free survival (log-rank test, p = 0.00583) (Figure 5B). These findings reaffirm the effectiveness of HN1L inhibition on TNBC progression and indicate that HN1L-mediated signaling pathways correlate with TNBC patient survival. With further validation, this signature may be a useful prognostic marker in the future.
Figure 5.

Genes Regulated by HN1L Are Enriched for the JAK-STAT3 Pathway
(A) Five tumor samples from scrambled siRNA-treated mice and HN1L siRNA-treated mice were used for microarray analysis. Genes significantly changed (p < 0.05, fold change > 1.5) were identified as the HN1L knockdown gene signature and are shown in the heatmap.
(B) The HN1L knockdown gene signature correlated with significantly improved relapse-free survival in a cohort of 383 TNBC patients.
(C) Top canonical pathways identified by IPA based on microarray analysis of siRNA-treated BCM2665 xenograft tumors. The red box indicates the most significantly altered signaling pathway.
(D) Broad Institute GSEA analysis of JAK2-STAT3 pathway in BCM2665 xenografts treated with siRNA against HN1L, showing that the pathway was significantly downregulated.
(E) Mutual exclusivity analysis of HN1L, LEPR, and STAT3 in the TCGA breast cancer database demonstrated a significant tendency toward co-occurrence for HN1L with LEPR and STAT3. mRNA expression (microarray) and protein/phosphoprotein level (RPPA) data profiles were selected in all 1,104 tumor samples from cBioPortal for Cancer Genomics to generate the table.
HN1L Regulates an LEPR-STAT3 Signaling Pathway
We performed a pathway enrichment analysis using Ingenuity Pathway Analysis (IPA) on the identified gene signature to identify the top signaling pathways. Using this method, the most significantly altered gene set identified was leptin signaling (Figure 5C). Leptin receptor (LEPR) is well known to be upregulated and essential in maintaining BCSCs in TNBC (Feldman et al., 2012, Zheng et al., 2013). STAT3 signaling is a key downstream mediator of LEPR pathways (Ohba et al., 2010, Park and Scherer, 2011, Chang et al., 2015). We then examined JAK-STAT pathway activity with gene set enrichment analysis (GSEA), whereby a significant reduction of JAK-STAT signaling was observed in HN1L knockdown tumors (Figure 5D). These results led us to investigate the correlation between HN1L, LEPR, and STAT3. A mutual exclusivity analysis using microarray and reverse-phase protein assay (RPPA) data on 1,104 breast cancer patients from TCGA revealed that HN1L was highly statistically likely to act through the same signaling pathway with LEPR and STAT3 (Figure 5E).
HN1L Is a BCSC Transcription Regulator of the LEPR-STAT3 Signaling Pathway
To confirm the relevance of this pathway in vitro, HN1L silencing experiments using siRNA were performed in SUM159, MDA-MB-231, and MDA-MB-468 cells. LEPR and phospho-STAT3, but not leptin, were reduced at the protein level upon HN1L silencing (Figure 6A). Consistently, transfection with a HN1L overexpression plasmid for 48 hr increased the expression of phospho-STAT3, STAT3, LEPR, and leptin (Figures 6B and S5A). Also, LEPR depletion inhibited STAT3 activation while not affecting HN1L levels (Figure 6C), suggesting that HN1L may work upstream of LEPR. Similar results were seen in vivo, in which PDX tumors depleted of HN1L had decreased LEPR and STAT3 signaling (Figure S4A). Together, these data support the existence of an HN1L-LEPR-STAT3 pathway.
Figure 6.

HN1L Activates the STAT3 Pathway by Regulating LEPR Expression
(A–C) Western blot data assessing HN1L, LEPR, and STAT3 signaling in TNBC cell lines under different treatment conditions; siScr, scrambled siRNA; siHN1L, silencing RNA against HN1L. β-Actin served as a loading control. i, HN1L-Myc-DDK; ii, endogenous HN1L.
(D) Real-time PCR results demonstrating silencing effects of HN1L on STAT3 and LEPR. n = 3 independent experiments with 3 technical replicates.
(E) STAT3 transcriptional activity was determined by Cignal luciferase reporter assay using STAT3 reporter in SUM159 cells transfected with the indicated amounts of the HN1L overexpression plasmid. EV, empty vector. n = 3 independent experiments with 3 technical replicates.
(F) Real-time PCR on transcription factors that are downstream of STAT3 and are essential for stem cell function was performed in HN1L knockdown SUM159 cells. n = 3 independent experiments with 3 technical replicates.
(G and H) Silencing LEPR decreased cell migration/invasion and MSFE in SUM159 cells. n = 3 independent experiments with 3 technical replicates in migration/invasion assay. n = 3 independent experiments with 12 technical replicates in MSFE assay.
Error bars represent the SD. ∗p < 0.05, ∗∗p < 0.01, ∗∗∗p < 0.001.
To determine whether HN1L influences the transcription of STAT3 and LEPR, we performed qRT-PCR in MDA-MB-231 cells after silencing or overexpressing HN1L. We limited our investigation to STAT3 and LEPR because these two genes were commonly affected by the HN1L gene silencing and overexpression. We found that silencing HN1L reduced the mRNA levels by half for both STAT3 and LEPR (Figures 6D and S5B) while the overexpression caused a 2.5-fold increase in the transcription of the two genes compared with the respective controls (Figure S5C). We further confirmed the transcriptional activity of HN1L using a STAT3 luciferase reporter system. STAT3-dependent transcription was strongly stimulated by HN1L overexpression in a dose-dependent manner (Figure 6E). We confirmed the regulatory roles of HN1L on the STAT3 signaling pathway through a rescue experiment by co-transfecting SUM159 cells with HN1L siRNAs and a plasmid carrying the constitutively active STAT3-GFP gene. Cells co-transfected with scrambled siRNA and GFP plasmid or siRNA and STAT3-GFP plasmid served as controls. HN1L gene silencing reduced both the CD44+/CD24−/low CSCs and the MSFE in SUM159 cells while the co-transfection with STAT3-GFP rescued the cells from the gene silencing, as indicated by the recovered CSC population and the increased MSFE (Figures S5D and S5E). We further examined the activity of HN1L on STAT3 by assessing the stem cell-regulating transcription factors, KLF4, Sox2, Sox9, and Twist1, regulated by STAT3 in an HN1L knockdown stable cell line (Zhang et al., 2010, Yu et al., 2011, Guo et al., 2012, Li et al., 2012, Yang et al., 2012, Sarkar and Hochedlinger, 2013), whose levels were significantly reduced when HN1L levels were depleted by shRNA (Figure 6F). Furthermore, knocking down LEPR was sufficient to reduce TNBC cell migration and MSFE (Figures 6G and 6H). Altogether, the data support our hypothesis that HN1L is an essential regulator of BCSCs as an upstream regulator of the LEPR-STAT3 signaling pathway.
STAT3 Is the Key Mediator in HN1L Function
Since HN1L is a gene whose gene product has no predictable conserved domains (Mitchell et al., 2015), the mechanism of action of HN1L is enigmatic. The subcellular localization database, COMPARTMENTS, indicated nuclear localization of HN1L with high confidence (Binder et al., 2014). Also, nuclear localization of GFP-tagged HN1L (called L11 in their paper) has been observed (Petroziello et al., 2004). Based on this, we hypothesized that HN1L may play a regulatory role in gene expression by acting as a transcription factor or co-factor. Hence, chromatin immunoprecipitation coupled with ultra-high-throughput DNA sequencing (ChIP-seq) was performed to identify DNA sequences to which it may bind (Figure S6A). Due to the unavailability of a ChIP-grade HN1L antibody, we overexpressed FLAG-tagged HN1L in SUM159 cells and performed ChIP using anti-FLAG antibodies. HN1L showed 2,249 binding peaks from 10,000 bp upstream to 5,000 bp downstream of the transcription start site, among which 35 genes overlapped with a previously published BCSC gene signature (Creighton et al., 2009), 10 genes overlapped with the HN1L knockdown gene signature, and 8 genes are well established CSC transcription factors (Kim and Orkin, 2011, Ell and Kang, 2013) (Figure 7A). When applying overlapped genes in the STRING10 pathway analysis database (Szklarczyk et al., 2015), a protein interaction network centered with STAT3 was obtained (Figure 7B). STAT3 and FGFR2 peaks were validated by qPCR (Figure 7C). Model-based analysis of ChIP-seq (MACS) (Zhang et al., 2008, Liu, 2014) was then used to confirm the peaks found by Hypergeometric Optimization of Motif EnRichment (HOMER) (Heinz et al., 2010). Besides the binding peaks found in HOMER, another peak was called by MACS within LEPR (Figure S6B) and was also validated by qPCR (Figure S6C). These findings indicate that HN1L may act as a transcription factor through binding to enhancer regions of STAT3 and other STAT3 regulators.
Figure 7.

STAT3 Is a Hub in HN1L Function
(A) Venn diagrams showing the overlaps between HN1L targets in SUM159 cells and either the BCSC gene signature, the HN1L knockdown gene signature, or known CSC transcription factors. Upstream is defined as HN1L enrichment 10 kb upstream from the open reading frames of the identified genes.
(B) Protein-protein interactions of the overlapped genes from (A) and their association with STAT3 is presented by STRING10. Thicker lines indicate the stronger confidence of associations.
(C) ChIP-seq analysis suggested that HN1L binds to upstream sequences of STAT3 and FGFR2. Validation was performed by qPCR, and the y axis represents the relative abundance of DNA fragments in FLAG-ChIP (HN1L) samples over the control IgG-ChIP. n = 3 independent experiments with 3 technical replicates.
Error bars represent the SD.
Notably, a pathway analysis on the overlapped genes showed that RNA polymerase II-dependent transcription was a significant biological process involved (p = 0.0000575) (Figure S6D). RNA polymerase II synthesizes not only mRNA but also other RNA molecules including microRNA (miRNA) (Lee et al., 2004). This finding directed us to further investigate the role of HN1L in regulating miRNA. After comparing miRNA expression profiles from PDX BCM2665 xenograft tumors with or without HN1L knockdown, we found that miR-150, an important miRNA known to be overexpressed in BCSCsm, was significantly downregulated (Figures S7A–S7C) (Huang et al., 2013, Isobe et al., 2014). To understand the role of miR-150 in the HN1L-LEPR-STAT3 network, we analyzed all experiment-validated-targets of miR-150 (Hsu et al., 2014), together with LEPR and STAT3, in STRING10. Surprisingly, the miR-150 target genes were clustered with STAT3 through protein-protein interactions (Figure S7D). Overall, our data indicate that HN1L is able to regulate multiple pathways including LEPR signaling and miR-150, which eventually converge into STAT3 to execute its function in maintaining BCSCs.
Discussion
Here, we demonstrate that HN1L expression is increased in breast cancer and that its amplification is associated with poor patient prognosis in TNBC. Knockdown of HN1L in TNBC cell lines and PDX models significantly reduced BCSC population, lung metastasis, and tumor volume when combined with chemotherapy. The gene signature obtained from patient tumors with HN1L knockdown correlated with better survival in TNBC patients. In particular, patients with copy number gains of HN1L have a higher rate of relapse and metastasis and lower survival rate. Mechanistically, HN1L works through multiple pathways regulating downstream STAT3 signaling, which is an established BCSC regulatory pathway (Marotta et al., 2011, Dave et al., 2012, Carpenter and Lo, 2014, Yu et al., 2014).
Adipose tissue is a major component of breast and is an active endocrine organ secreting cytokines such as leptin to influence the mammary gland microenvironment (Park and Scherer, 2011). The important role of LEPR in breast cancer has been addressed in multiple studies (Ishikawa et al., 2004, Rene Gonzalez et al., 2009), not only in supporting tumor cell proliferation (Yin et al., 2004) and angiogenesis (Rene Gonzalez et al., 2009), but also in maintaining CSC self-renewal properties (Park and Scherer, 2011, Feldman et al., 2012, Zheng et al., 2013). Our data showed that the LEPR pathway is the top canonical pathway associated with HN1L knockdown, and depleting LEPR levels sufficiently reduced the BCSC population. Although LEPR is a promising drug target, drugs that block LEPR are currently unavailable. As HN1L is an important regulator of LEPR, targeting HN1L might provide another angle to impair overactive LEPR pathways in cancer.
HN1L has multiple cellular functions, including binding to DNA sequences of many BCSC-related genes. Although the details of how HN1L works as a transcription regulator are still unclear, the important role of HN1L in BCSC function necessitates further study on its specific mechanisms. It is noteworthy that among the HN1L-associated genes detected by ChIP-seq, FGFR2 has been reported to be indispensable for BCSC self-renewal (Kim et al., 2013), suggesting another possible mechanism of HN1L through regulation of FGFR2 expression.
A common downstream pathway activated by LEPR, miR-150, and FGFR2 is STAT3 (Fletcher et al., 2013), which has been confirmed here. Although the importance of STAT3 signaling in BCSCs has been established, and the development of STAT3 inhibitors is being pursued, no STAT3 antagonist is available to-date. Therefore, our findings are crucial since we have identified HN1L as an upstream regulator of STAT3 and LEPR signaling. Therapies targeting HN1L have the potential to interfere with multiple downstream effectors and exert more potent effects on this signaling cascade. Also, upstream inhibition may avoid the activation of compensatory signaling from other downstream effectors causing drug resistance (Toyoshima et al., 2012). Moreover, STAT3 activation by HN1L is not through a single pathway, as both transcriptional and translational levels of STAT3 are affected by multiple mechanisms. HN1L inhibition may therefore have a more deleterious impact on STAT3 action than targeting single pathways. These findings support HN1L as an important therapeutic target in TNBC.
In conclusion, our study describes the functions of the gene HN1L in BCSC self-renewal. Inhibition of HN1L reduces tumor cell proliferation, CSC self-renewal and migration, tumor growth, and metastasis and is associated with improved patient survival. We demonstrate that HN1L depletion deactivates STAT3-regulated gene networks and reduces BCSC self-renewal. Importantly, HN1L overexpression has also been observed in lung, colon, ovarian, pancreatic, prostate, and uterine cancer (Petroziello et al., 2004). Further studies are required to prove the clinical significance of HN1L as a therapeutic target.
Experimental Procedures
Study Design
The objectives of this study were to elucidate unidentified functions and clinical significance of HN1L, as a BCSC gene, in in vitro and in vivo models. First, public breast cancer patient datasets were analyzed to compare the expression of HN1L gene and patient outcomes. To investigate the functions of HN1L in BCSCs, we utilized two cell line models and one PDX TNBC orthotopic tumor model, in vivo limiting dilution, flow-cytometric analysis, gene silencing or overexpression, gene expression microarrays, ChIP-seq analysis, western blot assays, and qRT-PCR. Each experiment was repeated at least two or three times using biological or technical repeats and confirmed by two or three different co-authors. Animals bearing tumors (150–200 mm3) were randomly selected into groups, treated, and measured as indicated in Supplemental Experimental Procedures. The endpoints of animal experiments were determined prior to each experiment to mimic clinical treatment schedules. Animals with ulcerated tumors or >10% body weight loss were excluded from the randomization. We performed blinded bioinformatics or statistical analyses.
Materials and Cell Culture
TNBC cell lines (SUM159, MDA-MB-231, and MDA-MB-468) were purchased from ATCC (Manassas, VA, USA). Cells were cultured in DMEM (Invitrogen, Grand Island, NY) with 10% fetal bovine serum (Thermos Scientific Hyclone, Rockford, IL) in a humidified 5% CO2 incubator at 37°C. Mammospheres were grown in MammoCult Human Medium with 0.5% MethoCult, both of which were purchased from STEMCELL Technologies (Vancouver, Canada). All CD marker antibodies and mouse immunoglobulin G (IgG) isotype antibodies (APC mouse anti-human CD44, #559942; CD24 PE-CY7, #561646; mouse anti-human CD2, #555327; mouse anti-human CD31, #555446; mouse anti-human CD18, #555924; mouse anti-human CD16, #555407; mouse anti-human CD19, #555413; mouse anti-human CD45, #555483; CD140b, #558821; CD3, #555333; BD CompBead negative control, #552843) used in flow-cytometry analysis were purchased from BD Biosciences (San Jose, California). SYTOX Blue Nucleic Acid Stain for dead cell staining was purchased from Invitrogen (catalog #S34857). Antibodies used for immunoblotting, including anti-STAT3 (catalog #9132) and anti-pSTAT3-Tyr705 (catalog #9131), were purchased from Cell Signaling Technology (Danvers, MA). Anti-HN1L (catalog #HPA041908) and anti-FLAG (catalog #F3165-1MG) were obtained from Sigma (St. Louis, MO). Anti-leptin receptor antibody (catalog #AB177469) and anti-leptin antibody (catalog #AB3583) were purchased from Abcam (Cambridge, MA).
siRNA and shRNA Knockdown
The shRNA lentiviral plasmid against HN1L was transduced as previously described (Dave et al., 2014). All siRNAs were purchased from Ambion (Austin, TX). Sequences of shRNA and siRNAs are available in Supplemental Experimental Procedures.
Mammosphere Formation Assays
MSFE was evaluated by mammosphere assay as previously described (Choi et al., 2014, Dave et al., 2014). Mammospheres were grown in MammoCult medium with 0.5% methylcellulose. Secondary mammospheres formed in SUM159 cells were counted on day 10 and those in MDA-MB-231 cells were counted on day 14. Detailed methods for these assays are available in Supplemental Experimental Procedures.
Fluorescence-Activated Cell Sorting Analysis
CD44+/CD24−/low population and ALDH activity in cell lines and xenograft tumors were measured by flow cytometry as described previously (Choi et al., 2014) (see Supplemental Experimental Procedures)
Cell Migration and Invasion Assays
Cell migration, cell invasion, and 3D invasion assays were carried out using Cultrex 96-well cell-migration assay (Trevigen, #3465-096-K), Cultrex 96-well BME cell-invasion assay kit (Trevigen, #3455-096-K), and Cultrex 3D spheroid cell-invasion assay (Trevigen, #3500-096-K), respectively, following the manufacturer's instructions. Further details can be found in Supplemental Experimental Procedures.
Overexpression
Cancer cells were transfected with a HN1L plasmid tagged with Myc-DDK (with DDK encoding a FLAG sequence) (Origene #RC209294) using TurboFectin transfection reagent (Origene). An empty pCMV6 vector was used as a control. One to two micrograms of plasmid was used for each transfection in 6-well plates. For a 100-mm dish, we used 20 μg of plasmid and selected cells using 3 mg/mL G418 (Invitrogen) for 3 days. For western blot assay, MDA-MB-231 and MDA-MB-468 cells were serum-starved for 24 hr before harvest.
In Vivo Studies
The Houston Methodist Hospital Research Institute Animal Care and Use Review Office approved this study. All tumor models were developed orthotopically in the mammary fat pad of SCID-Beige mice and handled as described previously (Tanaka et al., 2010, Choi et al., 2014, Dave et al., 2014). In brief, after tumors were grown orthotopically to 150–300 mm3 in volume, mice were randomized into groups of (i) scrambled siRNA-DOPC, (ii) HN1L siRNA-DOPC, (iii) docetaxel + PBS, (iv) docetaxel + scrambled siRNA-DOPC, or (v) docetaxel + HN1L siRNA-DOPC. Groups (i), (ii), (iv), and (v) were treated with 5 μg/mouse DOPC nanoliposomal siRNA injection intraperitoneally twice a week for 3 weeks. Groups (iii) to (v) were given 20 mg/kg docetaxel injection intraperitoneally every 2 weeks with the same respective 5 μg/mouse DOPC liposomal siRNAs. DOPC nanoliposomal siRNA was prepared as previously described (Landen et al., 2005, Tanaka et al., 2010). In brief, Scrambled or HN1L siRNA was incorporated into DOPC at a ratio of 1:10 (w/w) in the presence of excess tertiary butanol. Liposomal siRNA powder was reconstituted with PBS immediately before in vivo administration. More information is available in Supplemental Experimental Procedures.
Western Blot Assay
Western blot assay was performed as previously described (Choi et al., 2014, Dave et al., 2014). In brief, all primary antibodies were diluted to 1:1,000 in 5% BSA in a washing buffer (PBS with 1% Tween 20 [PBST]), and the secondary antibodies conjugated with horseradish peroxidase to 1:3,000 in 5% skim milk in PBST. Each protein was detected using Western Blotting Luminol Reagent (Santa Cruz Biotechnology). More information is available in Supplemental Experimental Procedures.
Immunohistochemistry
IHC staining for HN1L target engagement in vivo was performed using a protocol similar to one previously published (Dave et al., 2014). In each treatment group, 10 FFPE tumor samples were stained, only 3 of which were randomly chosen to show images due to space limitations.
Gene Expression Microarray Analysis
Microarrays were performed on 10 snap-frozen tumor samples from scrambled siRNA-treated and HN1L siRNA-treated BCM2665 xenografts (5 samples from each treatment group), as described in Supplemental Experimental Procedures.
HN1L Expression and Patient Survival Analysis
We downloaded level-3 RNA-seq V2 data from the TCGA and Curtis dataset for HN1L from Oncomine (Rhodes et al., 2004). We normalized the gene expression levels of HN1L to the normal breast. Overall survival was estimated for each HN1L expression cohort (high versus low) within each database (TCGA and Curtis) by means of the Kaplan-Meier method. Survival was truncated at 10 years. Cohort survival differences were assessed by means of the log-rank test. A low expresser were defined as HN1L < 1.85 and HN1L < 2.0 for the TCGA and the Curtis data, respectively. Additionally, relapse-free survival analysis either with HN1L expression or with the HN1L knockdown gene signature was performed according to a previously published method and in the same 383-patient TNBC cohort (Chen et al., 2014).
ChIP and ChIP-Seq
FLAG-tagged HN1L was overexpressed in SUM159 cells. ChIP was carried out using the EZ-ChIP kit (EMD Millipore, #17-371) following the manufacturer's protocol. Further details are available in Supplemental Experimental Procedures.
Real-Time PCR
Real-time PCR analysis of HN1L, STAT3, LEPR, LEP, and STAT3 downstream regulators was performed using TaqMan Gene Expression Assays. Validation of ChIP peaks was done in triplicate with the SYBR Green method (Life Technologies, #4309155). Primer sequences are available in Supplemental Experimental Procedures. Validation of miR-150 in BCM2665 tumors was performed with TaqMan MicroRNA assays following the manufacturer's instructions (primer #000473).
Statistics
All in vitro data are presented as means ± SD and statistical significance was analyzed by two-tailed Student's t test. All experiments had at least 3 replicates and were repeated twice. In vivo data are presented as mean ± SEM. Different treatment groups were compared by one-way ANOVA. Patient survival was derived by the Kaplan-Meier method and the log-rank test was used to assess the statistical significance of survival between groups. Cox regression was also used to assess the impact of gene expression values on survival probabilities when analyzing the HN1L knockdown gene signature. A p value of less than 0.05 was considered statistically significant.
Author Contributions
Conceptualization, Y.L., D.S.C., and J.C.C.; Methodology, Y.L., D.S.C., M.D.L., and J.C.C.; Investigation, Y.L., D.S.C., J.E.E., J.S., B.D., S.G-P., C.R.-A., H.W., W.Q., and Z.L.; Formal Analysis, Y.L., D.S.C., J.E.E., J.S., S.B., A.P., O.E., A.V., Y.C., and S.W.; Resources, D.S.C., B.D., M.D.L., A.K.S., S.W., G.L.-B., and J.C.C.; Writing – Original Draft, Y.L. and D.S.C.; Writing – Review & Editing, D.S.C., D.H.L., J.E.E., J.S., R.R.R., B.D., D.M., and J.C.C.; Supervision, J.C.C.; Funding Acquisition, J.C.C.
Acknowledgments
We thank the Flow Cytometry Core of Houston Methodist Research Institute for assisting with flow-cytometry analysis. We also thank the Epigenomics Core of Weill Cornell Medical College for assisting with sequencing of ChIP samples. We thank Dr. Gary Deyter for critical reading and editing of the manuscript. This work was supported by NIH/NCI grants R01 CA138197 and U54 CA149196, the Breast Cancer Research Foundation, the Chan Soon-Shiong Institute for Advanced Health, and Golfers against Cancer.
Published: December 14, 2017
Footnotes
Supplemental Information includes Supplemental Experimental Procedures, seven figures, and three tables and can be found with this article online at https://doi.org/10.1016/j.stemcr.2017.11.010.
Accession Numbers
The GEO SuperSeries accession number for this microarray and microRNA array data is GEO: GSE106200. The GEO accession number for this ChIP-seq data is GEO: GSE105446.
Supplemental Information
References
- Arnedos M., Bihan C., Delaloge S., Andre F. Triple-negative breast cancer: are we making headway at least? Ther. Adv. Med. Oncol. 2012;4:195–210. doi: 10.1177/1758834012444711. [DOI] [PMC free article] [PubMed] [Google Scholar]
- Binder J.X., Pletscher-Frankild S., Tsafou K., Stolte C., O'Donoghue S.I., Schneider R., Jensen L.J. COMPARTMENTS: unification and visualization of protein subcellular localization evidence. Database (Oxford) 2014;2014:bau012. doi: 10.1093/database/bau012. [DOI] [PMC free article] [PubMed] [Google Scholar]
- Carpenter R.L., Lo H.W. STAT3 target genes relevant to human cancers. Cancers (Basel) 2014;6:897–925. doi: 10.3390/cancers6020897. [DOI] [PMC free article] [PubMed] [Google Scholar]
- Chang C.C., Wu M.J., Yang J.Y., Camarillo I.G., Chang C.J. Leptin-STAT3-G9a signaling promotes obesity-mediated breast cancer progression. Cancer Res. 2015;75:2375–2386. doi: 10.1158/0008-5472.CAN-14-3076. [DOI] [PMC free article] [PubMed] [Google Scholar] [Research Misconduct Found]
- Chen J., Li Y., Yu T.S., McKay R.M., Burns D.K., Kernie S.G., Parada L.F. A restricted cell population propagates glioblastoma growth after chemotherapy. Nature. 2012;488:522–526. doi: 10.1038/nature11287. [DOI] [PMC free article] [PubMed] [Google Scholar]
- Chen X., Iliopoulos D., Zhang Q., Tang Q., Greenblatt M.B., Hatziapostolou M., Lim E., Tam W.L., Ni M., Chen Y. XBP1 promotes triple-negative breast cancer by controlling the HIF1alpha pathway. Nature. 2014;508:103–107. doi: 10.1038/nature13119. [DOI] [PMC free article] [PubMed] [Google Scholar]
- Choi D.S., Blanco E., Kim Y.S., Rodriguez A.A., Zhao H., Huang T.H., Chen C.L., Jin G., Landis M.D., Burey L.A. Chloroquine eliminates cancer stem cells through deregulation of Jak2 and DNMT1. Stem Cells. 2014;32:2309–2323. doi: 10.1002/stem.1746. [DOI] [PMC free article] [PubMed] [Google Scholar]
- Creighton C.J., Li X., Landis M., Dixon J.M., Neumeister V.M., Sjolund A., Rimm D.L., Wong H., Rodriguez A., Herschkowitz J.I. Residual breast cancers after conventional therapy display mesenchymal as well as tumor-initiating features. Proc. Natl. Acad. Sci. USA. 2009;106:13820–13825. doi: 10.1073/pnas.0905718106. [DOI] [PMC free article] [PubMed] [Google Scholar]
- Dave B., Granados-Principal S., Zhu R., Benz S., Rabizadeh S., Soon-Shiong P., Yu K.D., Shao Z., Li X., Gilcrease M. Targeting RPL39 and MLF2 reduces tumor initiation and metastasis in breast cancer by inhibiting nitric oxide synthase signaling. Proc. Natl. Acad. Sci. USA. 2014;111:8838–8843. doi: 10.1073/pnas.1320769111. [DOI] [PMC free article] [PubMed] [Google Scholar]
- Dave B., Landis M.D., Tweardy D.J., Chang J.C., Dobrolecki L.E., Wu M.F., Zhang X., Westbrook T.F., Hilsenbeck S.G., Liu D., Lewis M.T. Selective small molecule Stat3 inhibitor reduces breast cancer tumor-initiating cells and improves recurrence free survival in a human-xenograft model. PLoS One. 2012;7:e30207. doi: 10.1371/journal.pone.0030207. [DOI] [PMC free article] [PubMed] [Google Scholar]
- Driessens G., Beck B., Caauwe A., Simons B.D., Blanpain C. Defining the mode of tumour growth by clonal analysis. Nature. 2012;488:527–530. doi: 10.1038/nature11344. [DOI] [PMC free article] [PubMed] [Google Scholar]
- Ell B., Kang Y. Transcriptional control of cancer metastasis. Trends Cell Biol. 2013;23:603–611. doi: 10.1016/j.tcb.2013.06.001. [DOI] [PMC free article] [PubMed] [Google Scholar]
- Feldman D.E., Chen C., Punj V., Tsukamoto H., Machida K. Pluripotency factor-mediated expression of the leptin receptor (OB-R) links obesity to oncogenesis through tumor-initiating stem cells. Proc. Natl. Acad. Sci. USA. 2012;109:829–834. doi: 10.1073/pnas.1114438109. [DOI] [PMC free article] [PubMed] [Google Scholar]
- Fletcher M.N., Castro M.A., Wang X., de Santiago I., O'Reilly M., Chin S.F., Rueda O.M., Caldas C., Ponder B.A., Markowetz F., Meyer K.B. Master regulators of FGFR2 signalling and breast cancer risk. Nat. Commun. 2013;4:2464. doi: 10.1038/ncomms3464. [DOI] [PMC free article] [PubMed] [Google Scholar]
- Guo W., Keckesova Z., Donaher J.L., Shibue T., Tischler V., Reinhardt F., Itzkovitz S., Noske A., Zurrer-Hardi U., Bell G. Slug and Sox9 cooperatively determine the mammary stem cell state. Cell. 2012;148:1015–1028. doi: 10.1016/j.cell.2012.02.008. [DOI] [PMC free article] [PubMed] [Google Scholar]
- Heinz S., Benner C., Spann N., Bertolino E., Lin Y.C., Laslo P., Cheng J.X., Murre C., Singh H., Glass C.K. Simple combinations of lineage-determining transcription factors prime cis-regulatory elements required for macrophage and B cell identities. Mol. Cell. 2010;38:576–589. doi: 10.1016/j.molcel.2010.05.004. [DOI] [PMC free article] [PubMed] [Google Scholar]
- Hsu S.D., Tseng Y.T., Shrestha S., Lin Y.L., Khaleel A., Chou C.H., Chu C.F., Huang H.Y., Lin C.M., Ho S.Y. miRTarBase update 2014: an information resource for experimentally validated miRNA-target interactions. Nucleic Acids Res. 2014;42(Database issue):D78–D85. doi: 10.1093/nar/gkt1266. [DOI] [PMC free article] [PubMed] [Google Scholar]
- Huang S., Chen Y., Wu W., Ouyang N., Chen J., Li H., Liu X., Su F., Lin L., Yao Y. miR-150 promotes human breast cancer growth and malignant behavior by targeting the pro-apoptotic purinergic P2X7 receptor. PLoS One. 2013;8:e80707. doi: 10.1371/journal.pone.0080707. [DOI] [PMC free article] [PubMed] [Google Scholar]
- Ishikawa M., Kitayama J., Nagawa H. Enhanced expression of leptin and leptin receptor (OB-R) in human breast cancer. Clin. Cancer Res. 2004;10:4325–4331. doi: 10.1158/1078-0432.CCR-03-0749. [DOI] [PubMed] [Google Scholar]
- Isobe T., Hisamori S., Hogan D.J., Zabala M., Hendrickson D.G., Dalerba P., Cai S., Scheeren F., Kuo A.H., Sikandar S.S. miR-142 regulates the tumorigenicity of human breast cancer stem cells through the canonical WNT signaling pathway. Elife. 2014;3:e01977. doi: 10.7554/eLife.01977. [DOI] [PMC free article] [PubMed] [Google Scholar]
- Kim J., Orkin S.H. Embryonic stem cell-specific signatures in cancer: insights into genomic regulatory networks and implications for medicine. Genome Med. 2011;3:75. doi: 10.1186/gm291. [DOI] [PMC free article] [PubMed] [Google Scholar]
- Kim S., Dubrovska A., Salamone R.J., Walker J.R., Grandinetti K.B., Bonamy G.M., Orth A.P., Elliott J., Porta D.G., Garcia-Echeverria C., Reddy V.A. FGFR2 promotes breast tumorigenicity through maintenance of breast tumor-initiating cells. PLoS One. 2013;8:e51671. doi: 10.1371/journal.pone.0051671. [DOI] [PMC free article] [PubMed] [Google Scholar]
- Landen C.N., Jr., Chavez-Reyes A., Bucana C., Schmandt R., Deavers M.T., Lopez-Berestein G., Sood A.K. Therapeutic EphA2 gene targeting in vivo using neutral liposomal small interfering RNA delivery. Cancer Res. 2005;65:6910–6918. doi: 10.1158/0008-5472.CAN-05-0530. [DOI] [PubMed] [Google Scholar]
- Lee Y., Kim M., Han J., Yeom K.H., Lee S., Baek S.H., Kim V.N. MicroRNA genes are transcribed by RNA polymerase II. EMBO J. 2004;23:4051–4060. doi: 10.1038/sj.emboj.7600385. [DOI] [PMC free article] [PubMed] [Google Scholar]
- Li C.W., Xia W., Huo L., Lim S.O., Wu Y., Hsu J.L., Chao C.H., Yamaguchi H., Yang N.K., Ding Q. Epithelial-mesenchymal transition induced by TNF-alpha requires NF-kappaB-mediated transcriptional upregulation of Twist1. Cancer Res. 2012;72:1290–1300. doi: 10.1158/0008-5472.CAN-11-3123. [DOI] [PMC free article] [PubMed] [Google Scholar]
- Liedtke C., Rody A. New treatment strategies for patients with triple-negative breast cancer. Curr. Opin. Obstet. Gynecol. 2015;27:77–84. doi: 10.1097/GCO.0000000000000137. [DOI] [PubMed] [Google Scholar]
- Liu H., Patel M.R., Prescher J.A., Patsialou A., Qian D., Lin J., Wen S., Chang Y.F., Bachmann M.H., Shimono Y. Cancer stem cells from human breast tumors are involved in spontaneous metastases in orthotopic mouse models. Proc. Natl. Acad. Sci. USA. 2010;107:18115–18120. doi: 10.1073/pnas.1006732107. [DOI] [PMC free article] [PubMed] [Google Scholar]
- Liu S., Cong Y., Wang D., Sun Y., Deng L., Liu Y., Martin-Trevino R., Shang L., McDermott S.P., Landis M.D. Breast cancer stem cells transition between epithelial and mesenchymal states reflective of their normal counterparts. Stem Cell Reports. 2014;2:78–91. doi: 10.1016/j.stemcr.2013.11.009. [DOI] [PMC free article] [PubMed] [Google Scholar]
- Liu T. Use model-based Analysis of ChIP-Seq (MACS) to analyze short reads generated by sequencing protein-DNA interactions in embryonic stem cells. Methods Mol. Biol. 2014;1150:81–95. doi: 10.1007/978-1-4939-0512-6_4. [DOI] [PubMed] [Google Scholar]
- Marotta L.L., Almendro V., Marusyk A., Shipitsin M., Schemme J., Walker S.R., Bloushtain-Qimron N., Kim J.J., Choudhury S.A., Maruyama R. The JAK2/STAT3 signaling pathway is required for growth of CD44(+)CD24(-) stem cell-like breast cancer cells in human tumors. J. Clin. Invest. 2011;121:2723–2735. doi: 10.1172/JCI44745. [DOI] [PMC free article] [PubMed] [Google Scholar]
- Metzger-Filho O., Tutt A., de Azambuja E., Saini K.S., Viale G., Loi S., Bradbury I., Bliss J.M., Azim H.A., Jr., Ellis P. Dissecting the heterogeneity of triple-negative breast cancer. J. Clin. Oncol. 2012;30:1879–1887. doi: 10.1200/JCO.2011.38.2010. [DOI] [PubMed] [Google Scholar]
- Mitchell A., Chang H.Y., Daugherty L., Fraser M., Hunter S., Lopez R., McAnulla C., McMenamin C., Nuka G., Pesseat S. The InterPro protein families database: the classification resource after 15 years. Nucleic Acids Res. 2015;43(Database issue):D213–D221. doi: 10.1093/nar/gku1243. [DOI] [PMC free article] [PubMed] [Google Scholar]
- Ohba S., Lanigan T.M., Roessler B.J. Leptin receptor JAK2/STAT3 signaling modulates expression of Frizzled receptors in articular chondrocytes. Osteoarthritis Cartilage. 2010;18:1620–1629. doi: 10.1016/j.joca.2010.09.006. [DOI] [PMC free article] [PubMed] [Google Scholar]
- Park J., Scherer P.E. Leptin and cancer: from cancer stem cells to metastasis. Endocr. Relat. Cancer. 2011;18:C25–C29. doi: 10.1530/ERC-11-0163. [DOI] [PMC free article] [PubMed] [Google Scholar]
- Petroziello J., Yamane A., Westendorf L., Thompson M., McDonagh C., Cerveny C., Law C.L., Wahl A., Carter P. Suppression subtractive hybridization and expression profiling identifies a unique set of genes overexpressed in non-small-cell lung cancer. Oncogene. 2004;23:7734–7745. doi: 10.1038/sj.onc.1207921. [DOI] [PubMed] [Google Scholar]
- Rene Gonzalez R., Watters A., Xu Y., Singh U.P., Mann D.R., Rueda B.R., Penichet M.L. Leptin-signaling inhibition results in efficient anti-tumor activity in estrogen receptor positive or negative breast cancer. Breast Cancer Res. 2009;11:R36. doi: 10.1186/bcr2321. [DOI] [PMC free article] [PubMed] [Google Scholar]
- Rhodes D.R., Yu J., Shanker K., Deshpande N., Varambally R., Ghosh D., Barrette T., Pandey A., Chinnaiyan A.M. ONCOMINE: a cancer microarray database and integrated data-mining platform. Neoplasia. 2004;6:1–6. doi: 10.1016/s1476-5586(04)80047-2. [DOI] [PMC free article] [PubMed] [Google Scholar]
- Rody A., Karn T., Liedtke C., Pusztai L., Ruckhaeberle E., Hanker L., Gaetje R., Solbach C., Ahr A., Metzler D. A clinically relevant gene signature in triple negative and basal-like breast cancer. Breast Cancer Res. 2011;13:R97. doi: 10.1186/bcr3035. [DOI] [PMC free article] [PubMed] [Google Scholar]
- Sarkar A., Hochedlinger K. The sox family of transcription factors: versatile regulators of stem and progenitor cell fate. Cell Stem Cell. 2013;12:15–30. doi: 10.1016/j.stem.2012.12.007. [DOI] [PMC free article] [PubMed] [Google Scholar]
- Schepers A.G., Snippert H.J., Stange D.E., van den Born M., van Es J.H., van de Wetering M., Clevers H. Lineage tracing reveals Lgr5+ stem cell activity in mouse intestinal adenomas. Science. 2012;337:730–735. doi: 10.1126/science.1224676. [DOI] [PubMed] [Google Scholar]
- Szklarczyk D., Franceschini A., Wyder S., Forslund K., Heller D., Huerta-Cepas J., Simonovic M., Roth A., Santos A., Tsafou K.P. STRING v10: protein-protein interaction networks, integrated over the tree of life. Nucleic Acids Res. 2015;43(Database issue):D447–D452. doi: 10.1093/nar/gku1003. [DOI] [PMC free article] [PubMed] [Google Scholar]
- Tanaka T., Mangala L.S., Vivas-Mejia P.E., Nieves-Alicea R., Mann A.P., Mora E., Han H.D., Shahzad M.M., Liu X., Bhavane R. Sustained small interfering RNA delivery by mesoporous silicon particles. Cancer Res. 2010;70:3687–3696. doi: 10.1158/0008-5472.CAN-09-3931. [DOI] [PMC free article] [PubMed] [Google Scholar]
- Tekedereli I., Alpay S.N., Tavares C.D., Cobanoglu Z.E., Kaoud T.S., Sahin I., Sood A.K., Lopez-Berestein G., Dalby K.N., Ozpolat B. Targeted silencing of elongation factor 2 kinase suppresses growth and sensitizes tumors to doxorubicin in an orthotopic model of breast cancer. PLoS One. 2012;7:e41171. doi: 10.1371/journal.pone.0041171. [DOI] [PMC free article] [PubMed] [Google Scholar]
- Toyoshima Y., Kakuda H., Fujita K.A., Uda S., Kuroda S. Sensitivity control through attenuation of signal transfer efficiency by negative regulation of cellular signalling. Nat. Commun. 2012;3:743. doi: 10.1038/ncomms1745. [DOI] [PubMed] [Google Scholar]
- Yang C.M., Chiba T., Groner B. Expression of reprogramming factors in breast cancer cell lines and the regulation by activated Stat3. Horm. Mol. Biol. Clin. Investig. 2012;10:241–248. doi: 10.1515/hmbci-2012-0003. [DOI] [PubMed] [Google Scholar]
- Yin N., Wang D., Zhang H., Yi X., Sun X., Shi B., Wu H., Wu G., Wang X., Shang Y. Molecular mechanisms involved in the growth stimulation of breast cancer cells by leptin. Cancer Res. 2004;64:5870–5875. doi: 10.1158/0008-5472.CAN-04-0655. [DOI] [PubMed] [Google Scholar]
- Yu F., Li J., Chen H., Fu J., Ray S., Huang S., Zheng H., Ai W. Kruppel-like factor 4 (KLF4) is required for maintenance of breast cancer stem cells and for cell migration and invasion. Oncogene. 2011;30:2161–2172. doi: 10.1038/onc.2010.591. [DOI] [PMC free article] [PubMed] [Google Scholar]
- Yu H., Lee H., Herrmann A., Buettner R., Jove R. Revisiting STAT3 signalling in cancer: new and unexpected biological functions. Nat. Rev. Cancer. 2014;14:736–746. doi: 10.1038/nrc3818. [DOI] [PubMed] [Google Scholar]
- Zhang P., Andrianakos R., Yang Y., Liu C., Lu W. Kruppel-like factor 4 (Klf4) prevents embryonic stem (ES) cell differentiation by regulating Nanog gene expression. J. Biol. Chem. 2010;285:9180–9189. doi: 10.1074/jbc.M109.077958. [DOI] [PMC free article] [PubMed] [Google Scholar]
- Zhang X., Claerhout S., Prat A., Dobrolecki L.E., Petrovic I., Lai Q., Landis M.D., Wiechmann L., Schiff R., Giuliano M. A renewable tissue resource of phenotypically stable, biologically and ethnically diverse, patient-derived human breast cancer xenograft models. Cancer Res. 2013;73:4885–4897. doi: 10.1158/0008-5472.CAN-12-4081. [DOI] [PMC free article] [PubMed] [Google Scholar]
- Zhang Y., Liu T., Meyer C.A., Eeckhoute J., Johnson D.S., Bernstein B.E., Nusbaum C., Myers R.M., Brown M., Li W., Liu X.S. Model-based analysis of ChIP-seq (MACS) Genome Biol. 2008;9:R137. doi: 10.1186/gb-2008-9-9-r137. [DOI] [PMC free article] [PubMed] [Google Scholar]
- Zheng Q., Banaszak L., Fracci S., Basali D., Dunlap S.M., Hursting S.D., Rich J.N., Hjlemeland A.B., Vasanji A., Berger N.A. Leptin receptor maintains cancer stem-like properties in triple negative breast cancer cells. Endocr. Relat. Cancer. 2013;20:797–808. doi: 10.1530/ERC-13-0329. [DOI] [PMC free article] [PubMed] [Google Scholar]
- Zhou G., Wang J., Zhang Y., Zhong C., Ni J., Wang L., Guo J., Zhang K., Yu L., Zhao S. Cloning, expression and subcellular localization of HN1 and HN1L genes, as well as characterization of their orthologs, defining an evolutionarily conserved gene family. Gene. 2004;331:115–123. doi: 10.1016/j.gene.2004.02.025. [DOI] [PubMed] [Google Scholar]
Associated Data
This section collects any data citations, data availability statements, or supplementary materials included in this article.