Abstract
The aim of this study on dopamine transporter binding by [18F]FE-PE2I and PET was to describe an image-derived approach using reference tissue models: the Logan DVR approach and simplified reference tissue model (SRTM), the features of which were simple to operate and precise in the measurements. Using the approach, the authors sought to obtain binding images and parameters. [18F]FE-PE2I and dynamic PET as well as an MRI was performed on three rhesus monkeys, and metabolite corrected arterial plasma inputs were obtained. After co-registering of PET to MR images, both image sets were resliced. The time-activity curve of the cerebellum was used as indirect input, and binding parametric images were computed voxel-by-voxel. Voxel-wise linear calculations were used for the Logan DVR approach, and nonlinear least squares fittings for the SRTM. To determine the best linear regression in the Logan DVR approach, the distribution volume ratio was obtained using the optimal starting frame analysis. The obtained binding parameters were compared with those obtained by the other independent ROI-based numerical approaches: two-tissue compartment model (2TCM), Logan DVR approach and SRTM using PMOD software. Binding potentials (BP) obtained by the present approach agreed well with those obtained by ROI-based numerical approaches, although reference tissue models tended to underestimate the BP value than 2TCM. Image-derived Logan approach provided a low-noise image, the computation time was short, and the error in the optimal starting frame analysis was small. The present approach provides a high-quality binding parametric image and reliable parameter value easily.
Keywords: Dopamine transporter (DAT), [18F]FE-PE2I, parametric image, simplified reference tissue model, linear graphical analysis, image-derived approach
Introduction
Dopamine transporter (DAT) imaging using positron emission tomography (PET) is a well established tool to evaluate dopaminergic function in disorders such as Parkinson disease (PD) using [18F]beta-CFT [1] and attention-deficit/hyperactivity disorder using [11C]PE2I [2]. Recently, we proposed a new reversible radioligand for PET, [18F]FE-PE2I, which has high affinity and selectivity for the dopamine transporters [3,4]. More recently, dopaminergic function in non-human primate and in patients with PD has been evaluated using [18F]FE-PE2I and PET [5,6]. The amount of radiometabolites of [18F]FE-PE2I crossing the blood-brain barrier is sufficiently low in the kinetic analysis with compartment model [7,8], and non-specific binding of [18F]FE-PE2I was also low enough to be applied to reference tissue models without arterial blood sampling.
PET images showing binding parameters are an extended component in the analyses of neuroreceptor binding studies. Initially, quantitative analyses must be performed to estimate the radioligand binding parameters. Therefore, the conventional tissue compartment models using an arterial input function and reference tissue models have been applied. Among those models, linear-graphical analysis, such as Logan DVR algorithm [9], and simplified reference tissue model (SRTM) [10] are widely used in quantitative analysis for reversible radioligands and PET studies, because these algorithms do not only require arterial blood sampling, but also are easy to use and simple to be implemented. In these approaches, numerical data, time-activity curves (TACs), obtained by drawing regions of interest (ROIs) on dynamic PET images are conventionally used.
However, the accuracy of quantitative approaches based on general parametric images of binding potential can be affected by the noise distribution in emission images reconstructed by iterative methods [11,12]. To reduce noise dependence for linear-graphic analysis several approaches have been proposed such as the unbiased parametric imaging algorithm [13], the modified regression model [14] and the linear regression analysis [15]. Recently, to obtain binding parameters and images of the brain by reducing noise several methods based on voxel-wise parametric mapping approaches have been attempted. The basis function model was proposed robustly to obtain binding information for [11C]raclopride, [11C]SCH23390 and [11C]CFT uses the simplified reference tissue model [16] and [11C]PE2I [17]. The wavelet-based approach was proposed in the studies for [11C]FLB457 and [11C]WAY100635 [18], [18F]F-FEDAA1106 [19,20], and [11C]WIN35428 and [11C]MDL100907 [21]. Although these approaches are useful, they require special skill and programming technique, or even relatively long time for computation.
The aim of this study was to describe an image-derived and voxel-wise approach using reference tissue models for reversible radioligands and PET specialized to the convenience of simple operation to obtain binding information. Using this approach, the authors sought to obtain binding images and parameters for non-human primate of DAT binding with [18F]FE-PE2I and PET. The obtained binding potential values were compared with those obtained by other independent ROI-based numerical approaches and evaluated.
Materials and methods
Theory and algorithm
Two algorithmic approaches of the reference tissue model, noninvasive linear graphic analysis [9] and simplified reference tissue model (SRTM) [10,22] were prepared and implemented as one package software.
In the noninvasive linear graphical analysis, the Logan DVR approach, the cerebellum, which seems to have no specific binding sites, was used as a reference region in this study on [18F]FE-PE2I. A TAC for the target region, C t(t), was integrated over time and normalized to the last frame for the tissue radioactivity, C t(T), where T<t. The integrated value was plotted vs. integrated and normalized radioactivity for the cerebellum, C cbll(t). Since [18F]FE-PE2I is a reversible radioligand, this plot becomes linear and the asymptote of the slope becomes equal to the distribution volume ratio, DVR, as follows (Equation 1):
 |
and the binding potential, BP Logan, is estimated as follows (Equation 2):
T1-weighted MR images and dynamic PET images of the same subject were prepared. The image sets were co-registered and re-sliced using SPM2 software [23]. As the MATlab (Math Works, Natick, MA, USA) had been ported in the software, it was no longer required. The re-sliced MRI was used as a guide for precisely drawing regions of interest (ROIs). An ROI was manually drawn on a representative slice of the cerebellum by referring the MR image, the TAC of that ROI was obtained from the dynamic PET data set, and it was used as an indirect input function, C cbll(t). An ellipse shaped mask was drawn on the whole brain to eliminate exterior voxels and to reduce time for voxel-based computation.
Since the DVR is the asymptote of the slope, it depends on accurate linear regression. To determine the best regression based on the equation 1, DVR was computed voxel-by-voxel using a continuous frame set composed of the starting frame to the penultimate frame, increasing the number of starting frame by one with each iteration. Then, DVR was plotted against the starting frame number. When a frame set gave the maximum value of DVR, the starting frame of the set was assumed to be optimal to obtain reliable DVR in this study. Then parametric images of BP Logan were obtained. Finally, using the co-registered MR images, new ROIs, in this study, for the putamen, the caudate nucleus, the thalamus and the midbrain were drawn directly on these parametric images of BP Logan, and the mean value and standard deviation (s.d.) of regional BP Logan were obtained.
For the SRTM, binding potential, BP SRTM, is obtained by using the following equation (Equation 3):
 |
where, R 1 is the target to the reference tissue influx ratio rate constant, and k 2 is rate constant for transfer from tissue to plasma compartment. C t(t) and C cbll(t) are TACs for the target tissue and the cerebellum, respectively. The symbol ⊗ denotes the convolution integral. The C cbll(t) was manually obtained in the same way as described above. After that, parametric images of R 1, k 2 and BP SRTM were computed voxel-by-voxel by using nonlinear least squares fitting. New ROIs were set on these parametric images, and the average values of binding parameters and s.d. were obtained. Blood volume correction was not performed in those two approaches.
Validation studies
Determination of the best linear regression reliability
To test the reliability of the above method of determining optimum DVR, the average percentage errors were calculated. The maximum DVR was assumed to be calculated using a frame set. The frame set and starting frame were optimized for this study. When the starting frame number was not the optimal starting frame, the DVR value was calculated for each frame set and an average percent error of DVR was obtained.
ROI-based numerical approach
In order to verify the binding parameters obtained by the present image-derived approaches, we compared the same binding parameters obtained by three independent ROI-based numerical approaches: the conventional kinetic analysis, the Logan DVR approach and the SRTM, all of which were installed in the PMOD software (ver. 2.7; PMOD Technologies Swiss). To ensure accuracy in size and shape, the ROIs of the target tissue and the cerebellum used in the image-derived approaches were saved beforehand, and those ROIs were used for the ROI-based numerical approaches. Each TAC for the ROI, C t(t) and C cbll(t), was obtained from the original dynamic PET data set, and binding parameters were numerically calculated.
Kinetic analysis
A conventional two-tissue compartment model (2TCM) was used to validate binding parameters. The kinetics of [18F]FE-PE2I were described using an arterial input function with 4 rate constants-K 1 (mL/mL/min of brain tissue), k 2 (min-1), k 3 (min-1), and k 4 (min-1). In this study, simple metabolite-corrected parent input, Cp p, was used, because a better fit for regional time-activity curves could be achieved using Cp p than using a parent and metabolite combined input function [7]. The binding potential, BP ND, was estimated as the k 3/k 4 ratio. Blood volume correction estimated to be 0.04 was performed in the kinetic analysis.
Non-human primate
Three rhesus monkeys were examined. The study was approved by the Animal Ethics Committee of the Swedish Animal Welfare Agency and was performed according to the reported guidelines [24]. Animals were anesthetized and vital signs were monitored. Then a tracer dose of [18F]FE-PE2I was injected intravenously, and arterial blood was continually collected from a catheter inserted into a lower limb artery as previously described [7]. Radiometabolites in arterial blood were analyzed using an HPLC system [4] to obtain metabolite corrected arterial plasma input.
Preparation of [18F]FE-PE2I and PET measurement
[18F]FE-PE2I was prepared from its acid precursor through a reaction with 18F-2-bromo-1-fluoroethane in dimethylformamide and sodium hydroxide in N,N-dimethylformamide, as previously described [3]. The specific radioactivities were 113 GBq/mmol or greater at the time of injection, corresponding to a maximum injected mass of 0.3 nmol/kg. PET measurements were conducted using the HRRT system (Siemens Molecular Imaging) as previously described [7]. The resolution of the reconstructed images was 1.5 mm in FWHM.
Results
Original fused images of summed [18F]FE-PE2I PET and MRI of a representative non-human primate brain are shown in Figure 1. DAT rich regions, the putamen and the caudate nucleus, and a moderately DAT dense region, the midbrain, were easily visualized. Regional TACs obtained from the original dynamic PET data on the subject are shown in Figure 2. Although all those TACs were used for the ROI-based numerical approach, only the TAC for the cerebellum was used as indirect input in the present image-derived approach, and TACs of others were not used but computed with voxel-by-voxel levels.
Figure 1.
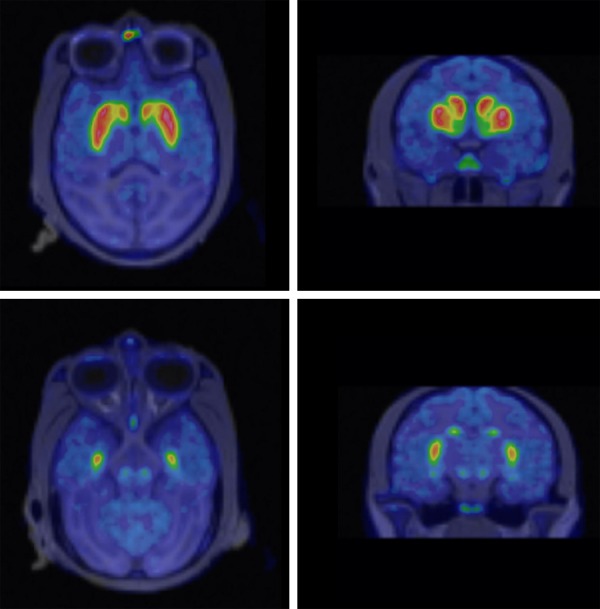
Original fused images of summed [18F]FE-PE2I PET and MRI of a representative non-human primate brain.
Figure 2.
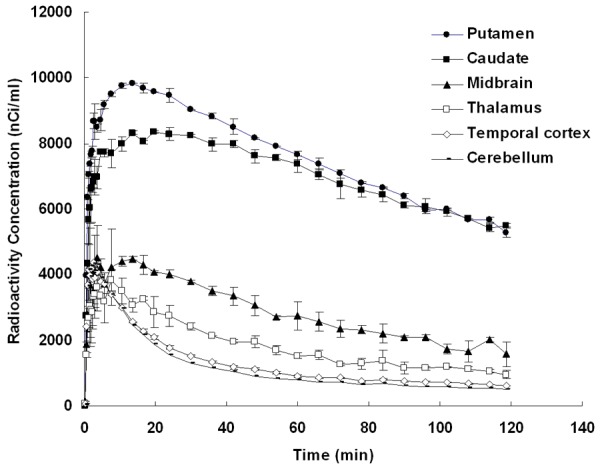
Average values and standard deviation of radioactivity vs. time in the putamen, the caudate nucleus, the midbrain, the thalamus, the temporal cortex and the cerebellum of the representative non-human primate after i.v. injection of [18F]FE-PE2I are shown. In the present image-derived approach, only the TAC of the cerebellum was obtained by manually drawing ROI of original dynamic PET data set and used as an indirect input function, and TACs of others were computed with voxel-by-voxel levels according to Eq. (1), (2) and (3).
Parametric images of DVR and BP Logan obtained by the image-derived Logan DVR approach are shown in Figure 3. Relatively low-noise images were obtained. The results of the optimum starting frame analysis of the Logan DVR approach are shown in Figure 4A and 4B. The representative non-human primate was analyzed and shown as an example. When the frame set beginning with frame number 21 was used, the maximum DVR value was provided. This frame set and the starting frame were determined to be optimal. When the starting frame number differed from the optimal starting frame number, within ± 3 frames, the average percentage error of the DVR was lower than 1%.
Figure 3.
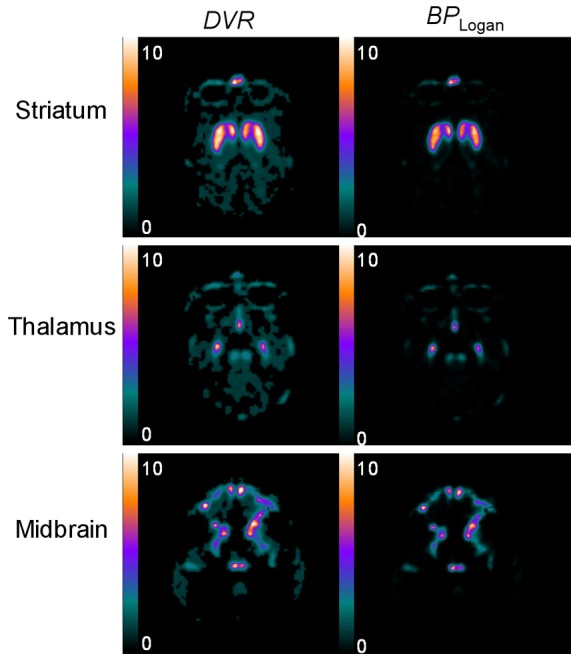
Parametric images of the representative non-human primate: DVR and BP Logan of [18F]FE-PE2I PET at level of the striatum, the thalamus and the midbrain, the images of which were obtained by the image-derived Logan DVR approach. BP Logan is equal to DVR-1.
Figure 4.
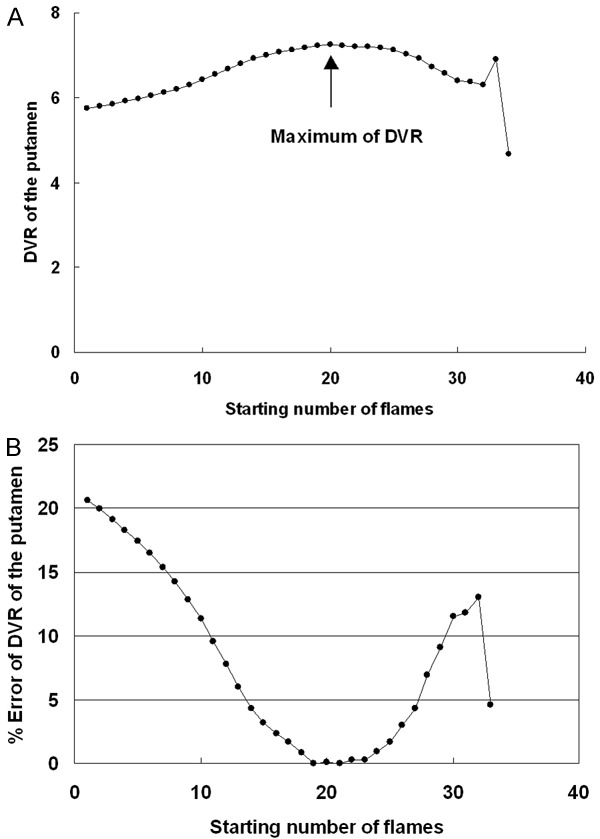
A. DVR values of the putamen of the representative non-human primate obtained by the image-derived Logan DVR approach, as starting number of flame was changed from the beginning to the last -1 one by one. The maximum of DVR was obtained at 21 flame, the flame of which was determined for the optimal starting flame. B. Percent errors of DVR were shown when starting number of flame was changed from the beginning to the last -1. When the starting flame was deviated ± 3 from the optimal flame, the percent error was within 1%, showing the reliability of the present approach.
Parametric images of BP SRTM, R 1 and k 2 obtained by the image-derived SRTM are shown in Figure 5. The approach produced noisier binding potential images, in the column labeled BP SRTM, than the image-derived Logan DVR approach. Regions of interest were directly drawn on those parametric images referring to the same slice of the MRI, and BP Logan and BP SRTM values and standard deviation were calculated.
Figure 5.
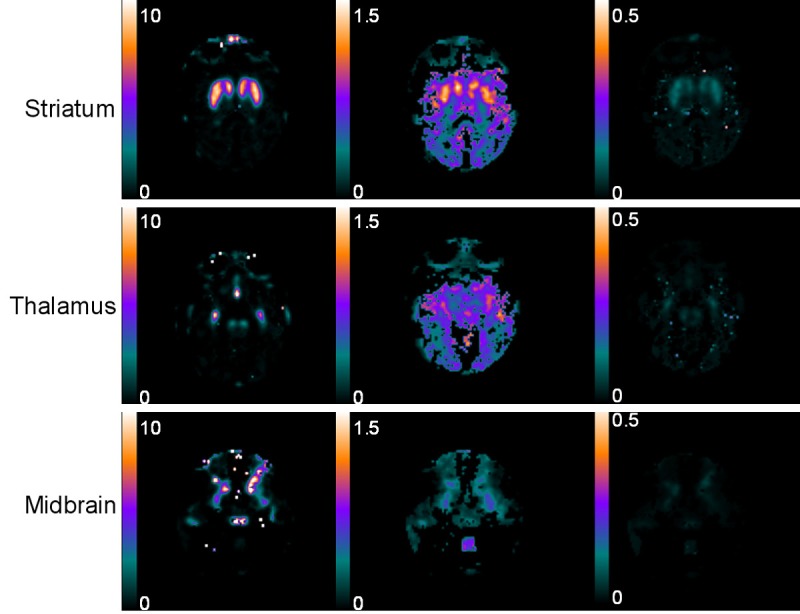
Parametric images of the representative non-human primate: BP SRTM, R 1 and k 2 of [18F]FE-PE2I PET at the level of the striatum, the thalamus and the midbrain, the images of which were obtained by the image-derived SRTM approach.
Comparisons of BP ND that was k 3/k 4 ratio obtained by the 2TCM analysis and BP Logan and BP SRTM obtained from all reference tissue models for the three non-human primates are presented in Table 1. BP Logan and BP SRTM were lower than BP ND, and all reference tissue models tended to underestimate binding potential values.
Table 1.
Comparisons of regional BP values, BP ND (k 3/k 4) obtained by kinetic analysis, and BP Logan and BP SRTM obtained by the ROI-based numerical approach and the image-derived approach, respectively. BP values obtained by reference tissue models were underestimated from BP ND, but both Logan DVR approach and SRTM provided similar values with less error
| 2TCM | BP Logan | BP SRTM | |||
|---|---|---|---|---|---|
|
|
|
|
|||
| BP ND (k 3/k 4) | ROI-based numerical approach | Image-derived approach presented | ROI-based numerical approach | Image-derived approach presented | |
| Putamen | 7.6 ± 0.37 | 6.7 ± 0.22 | 6.3 ± 0.29 | 6.4 ± 0.12 | 6.5 ± 0.16 |
| %COV | 4.9 | 3.3 | 4.6 | 1.9 | 2.5 |
| Caudate | 7.9 ± 0.49 | 6.8 ± 0.25 | 6.4 ± 0.18 | 6.5 ± 0.16 | 6.6 ± 0.16 |
| %COV | 6.2 | 3.7 | 2.8 | 2.5 | 2.4 |
| Midbrain | 1.8 ± 0.14 | 1.5 ± 0.11 | 1.4 ± 0.13 | 1.5 ± 0.13 | 1.6 ± 0.16 |
| %COV | 7.8 | 74.0 | 9.3 | 8.7 | 10.0 |
| Thalamus | 0.87 ± 0.09 | 0.60 ± 0.07 | 0.60 ± 0.06 | 0.50 ± 0.15 | 0.60 ± 0.10 |
| %COV | 10.3 | 11.7 | 10.0 | 30.0 | 16.7 |
| Temporal | 0.63 ± 0.14 | 0.14 ± 0.07 | 0.13 ± 0.07 | 0.12 ± 0.03 | 0.14 ± 0.04 |
| %COV | 22.2 | 50.0 | 53.8 | 25.0 | 28.6 |
2TCM: two-tissue compartment model; BP ND: binding potential (k 3/k 4) obtained by kinetic analysis of the 2TCM using arterial plasma input; BP Logan: binding potential obtained by the Logan DVR approach; BP SRTM: binding potential obtained by the simplified reference tissue model; %COV: percent coefficient of variance; Values are mean ± s.d.
Binding potential obtained by the image-derived approaches were almost the same as those obtained by the ROI-based numerical approaches. Percent COV values for all approaches were low in DAT rich regions, and increased with decreasing DAT density, i.e. in the midbrain, the thalamus, and the temporal cortex. In the midbrain, however, percent COV determined by the image-derived Logan DVR approach was less than 10%, which is relatively low and acceptable.
Relationships of binding potential in all regions obtained by the Logan DVR approach and SRTM using the image-derived approaches and ROI-based numerical approaches are shown in Figure 6A and 6B, respectively, demonstrating good agreement. However, the image-derived Logan DVR approach underestimated the binding potential in DAT rich regions. Relationships of binding potential in the moderately dense DAT region, the midbrain, are shown in Figure 7. Although there was also good agreement between the Logan DVR approach and the SRTM, the image-derived Logan DVR approach produced less noise.
Figure 6.
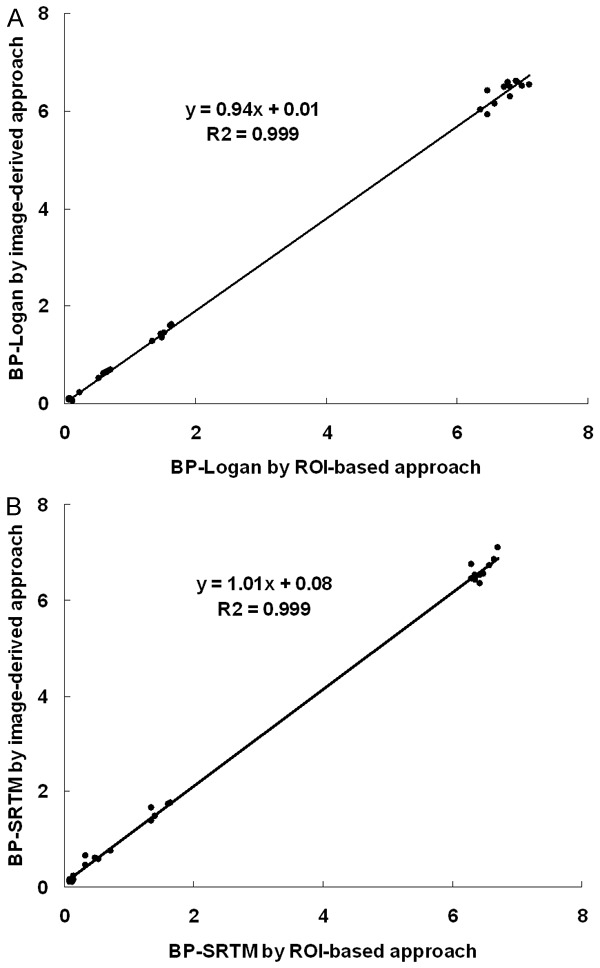
A. Relationship of BP Logan values of the striatum, the temporal cortex, the thalamus and the midbrain (n=30) obtained by the Logan DVR using ROI-based numerical approach and using image-derived approach. B. Relationship of BP SRTM values of the same regions obtained by these approaches. There were good relationships between them in both the Logan DVR and SRTM, respectively.
Figure 7.
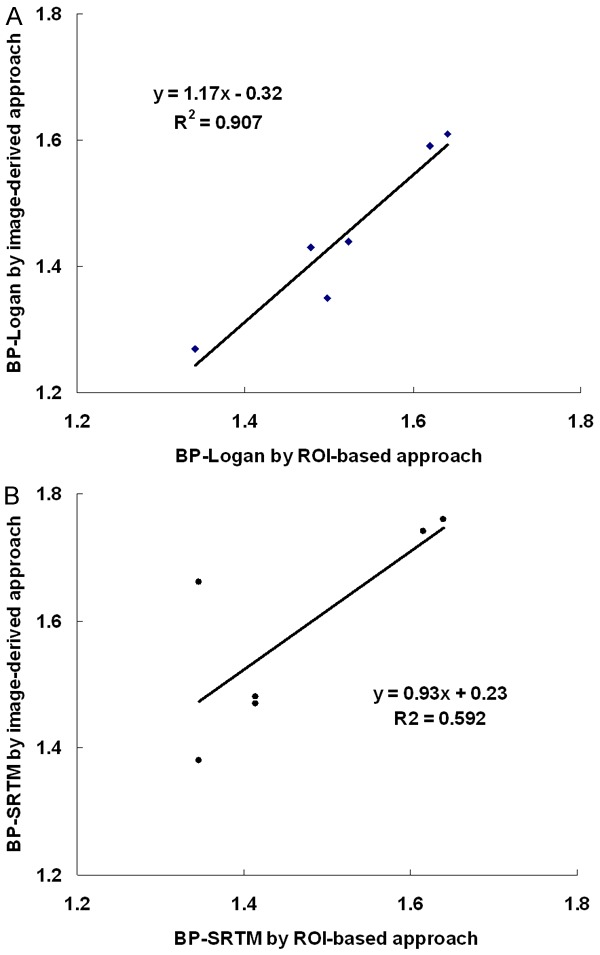
A. Relationship of BP Logan values of the midbrain (n=6) obtained by the ROI-based numerical approach and the image-derived approach. B. Relationship of BP SRTM values obtained by those approaches. There were good relationships between them, however, the Logan DVR approach showed a better co-relation than the SRTM.
Discussion
The present image-derived and voxel-wise reference tissue approaches easily provides high quality binding parametric images and reliable parameter values in the study with [18F]FE-PE2I and PET. Since the procedure is specialized in a series of operations, it is simple and the computation time is relatively short.
This analysis uses SPM2 and MATlab, both of which are installed in a single software package, Matlab is no longer required and it is convenient.
Binding potentials obtained by the present approaches were in good agreement with those obtained by the independent ROI-based numerical approaches, demonstrating that they were precise in the measurement and useful for transporter binding studies. However, it was based on small numbers of non-human primate and must be verified by a large number and even in the human brain. The reference tissue models underestimated the binding potential not only in the image-derived referral tissue approaches, but also in the ROI-based numerical approaches, as compared with 2TCM that is one of the ROI-base numerical approaches. This is generally a fundamental issue in kinetic modeling.
The image-derived Logan DVR approach is preferable to the image-derived SRTM, because it produced less noisy parametric images and the computation is fast, usually taking for a couple of minutes. The small noise and fast computation are due to Equation 1 and 2 for the Logan DVR approach being linear, whereas Equation 3 for the SRTM is non-linear and the limit of values may approach positive infinity in some voxels. The infinity limit is prominent in regions with low DAT density, such as in the midbrain and cortex. Moreover, the image-derived SRTM required approximately several hours to calculate parametric images with nonlinear least squares fitting. To reduce noise and for fast computation the basis function method [16] may be useful. Although the Logan DVR approach underestimated binding potential values in DAT rich regions, which has been previously reported [11], the underestimation can be corrected using several methods. The optimal starting frame analysis line for the image-derived Logan DVR approach was less error and useful to determine the best regression. The time for the analysis was short and binding potential values obtained were almost similar to those obtained by other independent approaches.
Conclusion
The present image-derived and voxel-wise reference tissue approaches provided high-quality binding parametric images and reliable parameter values easily. The image-derived Logan approach provided a low-noise image, the computation time was short, and the error in the optimal starting frame analysis was small, and it was preferable to transporter binding studies with [18F]FE-PE2I and PET.
Acknowledgements
We thank Professor Lars Farde, M.D. and Ph.D. for his helpful advice on the study design, methodology and discussion.
Disclosure of conflict of interest
None.
References
- 1.Rinne JO, Ruottinen H, Bergman J, Haaparanta M, Sonninen P, Solin O. Usefulness of a dopamine transporter PET ligand [18F] beta-CFT in assessing disability in Parkinson’s disease. J Neurol Neurosurg Psychiatry. 1999;67:737–741. doi: 10.1136/jnnp.67.6.737. [DOI] [PMC free article] [PubMed] [Google Scholar]
- 2.Jucaite A, Odano I, Olsson H, Pauli S, Halldin C, Farde L. Quantitative analyses of regional [11C] PE2I binding to the dopamine transporter in the human brain: a PET study. Eur J Nucl Med Mol Imaging. 2006;33:657–668. doi: 10.1007/s00259-005-0027-9. [DOI] [PubMed] [Google Scholar]
- 3.Schou M, Steiger C, Varrone A, Guilloteau D, Halldin C. Synthesis, radiolabeling and preliminary in vivo evaluation of [18F] FE-PE2I, a new probe for the dopamine transporter. Bioorg Med Chem Lett. 2009;19:4843–4845. doi: 10.1016/j.bmcl.2009.06.032. [DOI] [PubMed] [Google Scholar]
- 4.Varrone A, Steiger C, Schou M, Takano A, Finnema SJ, Guilloteau D, Gulyás B, Halldin C. In vitro autoradiography and in vivo evaluation in cynomolgus monkey of [18F] FE-PE2I, a new dopamine transporter PET radioligand. Synapse. 2009;63:871–880. doi: 10.1002/syn.20670. [DOI] [PubMed] [Google Scholar]
- 5.Varrone A, Gulyás B, Takano A, Stabin MG, Jonsson C, Halldin C. Simplified quantification and whole-body distribution of [18F] FEPE2I in nonhuman primates: prediction for human studies. Nucl Med Biol. 2012;39:295–303. doi: 10.1016/j.nucmedbio.2011.08.004. [DOI] [PubMed] [Google Scholar]
- 6.Fazio P, Svenningsson P, Forsberg A, Jönsson EG, Amini N, Nakao R, Nag S, Halldin C, Farde L, Varrone A. Quantitative analysis of 18F-(E)-N-(3-Iodoprop-2-Enyl)-2β-Carbofluoroethoxy-3β-(4’-Methyl-Phenyl) nortropane binding to the dopamine transporter in Parkinson disease. J Nucl Med. 2015;56:714–720. doi: 10.2967/jnumed.114.152421. [DOI] [PubMed] [Google Scholar]
- 7.Varrone A, Tóth M, Steiger C, Takano A, Guilloteau D, Ichise M, Gulyás B, Halldin C. 2011. Kinetic analysis and quantification of the dopamine transporter in the nonhuman primate brain with 11C-PE2I and 18F-FE-PE2I. J Nucl Med. 2011;52:132–139. doi: 10.2967/jnumed.110.077651. [DOI] [PubMed] [Google Scholar]
- 8.Sasaki T, Ito H, Kimura Y, Arakawa R, Takano H, Seki C, Kodaka F, Fujie S, Takahata K, Nogami T, Suzuki M, Fujiwara H, Takahashi H, Nakao R, Fukumura T, Varrone A, Halldin C, Nishikawa T, Suhara T. Quantification of dopamine transporter in human brain using PET with 18F-FE-PE2I. J Nucl Med. 2012;53:1065–1073. doi: 10.2967/jnumed.111.101626. [DOI] [PubMed] [Google Scholar]
- 9.Logan J, Fowler J, Volkow ND, Wang G, Ding Y, Alexoff DL. Distribution volume ratio without blood sampling from graphical analysis of PET data. J Cereb Blood Flow Metab. 1996;16:834–840. doi: 10.1097/00004647-199609000-00008. [DOI] [PubMed] [Google Scholar]
- 10.Lammertsma AA, Hume SP. Simplified reference tissue model for PET receptor studies. Neuroimage. 1996;4:153–158. doi: 10.1006/nimg.1996.0066. [DOI] [PubMed] [Google Scholar]
- 11.Slifstein M, Laruelle M. Effects of statistical noise on graphical analysis of PET neuroreceptor studies. J Nucl Med. 2000;41:2083–2088. [PubMed] [Google Scholar]
- 12.Wang G, Qi J. Generalized algorithms for direct reconstruction of parametric images from dynamic PET data. IEEE Trans Med Imaging. 2009;28:1717–1726. doi: 10.1109/TMI.2009.2021851. [DOI] [PMC free article] [PubMed] [Google Scholar]
- 13.Feng D, Huang SC, Wang ZZ, Ho D. An unbiased parametric imaging algorithm for nonuniformly sampled biomedical system parameter estimation. IEEE Trans Med Imaging. 1996;15:512–518. doi: 10.1109/42.511754. [DOI] [PubMed] [Google Scholar]
- 14.Varga J, Szabo Z. Modified regression model for the Logan plot. J Cereb Blood Flow Metab. 2002;22:240–244. doi: 10.1097/00004647-200202000-00012. [DOI] [PMC free article] [PubMed] [Google Scholar]
- 15.Ichise M, Fujita M, Seibyl JP, Verhoeff NP, Baldwin RM, Zoghbi SS, Rajeevan N, Charney DS, Innis RB. Graphical analysis and simplified quantification of striatal and extrastriatal dopamine D2 receptor binding with [123I] epidepride SPECT. J Nucl Med. 1999;40:1902–1912. [PubMed] [Google Scholar]
- 16.Gunn RN, Lammertsma AA, Hume SP, Cunningham VJ. Parametric imaging of ligand-receptor binding in PET using a simplified reference region model. NeuroImage. 1997;6:279–287. doi: 10.1006/nimg.1997.0303. [DOI] [PubMed] [Google Scholar]
- 17.Jonasson M, Appel L, Engman J, Frick A, Nyholm D, Askmark H, Danfors T, Sörensen J, Furmark T, Lubberink M. Validation of parametric methods for [¹¹C] PE2I positron emission tomography. Neuroimage. 2013;74:172–178. doi: 10.1016/j.neuroimage.2013.02.022. [DOI] [PubMed] [Google Scholar]
- 18.Cselényi Z, Olsson H, Halldin C, Gulyás B, Farde L. A comparison of recent parametric neuroreceptor mapping approaches based on measurements with the high affinity PET radioligands [11C] FLB 457 and [11C] WAY 100635. Neuroimage. 2006;32:1690–1708. doi: 10.1016/j.neuroimage.2006.02.053. [DOI] [PubMed] [Google Scholar]
- 19.Shidahara M, Ikoma Y, Seki C, Fujimura Y, Naganawa M, Ito H, Suhara T, Kanno I, Kimura Y. Wavelet denoising for voxel-based compartmental analysis of peripheral benzodiazepine receptors with 18F-FEDAA1106. Eur J Nucl Med Mol Imaging. 2008;35:416–423. doi: 10.1007/s00259-007-0623-y. [DOI] [PubMed] [Google Scholar]
- 20.Ikoma Y, Takano A, Varrone A, Halldin C. Graphic plot analysis for estimating binding potential of translocator protein (TSPO) in positron emission tomography studies with [18F] FEDAA1106. Neuroimage. 2013;69:78–86. doi: 10.1016/j.neuroimage.2012.12.009. [DOI] [PubMed] [Google Scholar]
- 21.Zhou Y, Ye W, Brašić JR, Wong DF. Multigraphical analysis of dynamic PET. Neuroimage. 2010;49:2947–2957. doi: 10.1016/j.neuroimage.2009.11.028. [DOI] [PMC free article] [PubMed] [Google Scholar]
- 22.Gunn RN, Sargent PA, Bench CJ, Rabiner EA, Osman S, Pike VW, Hume SP, Grasby PM, Lammertsma AA. Tracer kinetic modeling of the 5-HT1A receptor ligand [carbonyl-11C] WAY-100635 for PET. NeuroImage. 1998;8:426–440. doi: 10.1006/nimg.1998.0379. [DOI] [PubMed] [Google Scholar]
- 23.Friston KJ. Statistical parametric mapping. In: Thatcher RW, Hallett M, Zeffiro T, John ER, Huerta M, editors. Functional Neuroimaging. 1994. pp. 79–93. [Google Scholar]
- 24.Clark JD, Gebhart GF, Gonder JC, Keeling ME, Kohn DF. Special report: the 1996 guide for the care and use of laboratory animals. ILAR J. 1997;38:41–48. doi: 10.1093/ilar.38.1.41. [DOI] [PubMed] [Google Scholar]


