Abstract
Transcriptome analysis has been widely used to make biomarker panels to diagnose cancers. In breast cancer, the age of the patient has been known to be associated with clinical features. As clinical transcriptome data have accumulated significantly, we classified all human genes based on age-specific differential expression between normal and breast cancer cells using public data. We retrieved the values for gene expression levels in breast cancer and matched normal cells from The Cancer Genome Atlas. We divided genes into two classes by paired t test without considering age in the first classification. We carried out a secondary classification of genes for each class into eight groups, based on the patterns of the p-values, which were calculated for each of the three age groups we defined. Through this two-step classification, gene expression was eventually grouped into 16 classes. We showed that this classification method could be applied to establish a more accurate prediction model to diagnose breast cancer by comparing the performance of prediction models with different combinations of genes. We expect that our scheme of classification could be used for other types of cancer data.
Keywords: biomarkers, breast cancer, differentially expressed genes, gene classification
Introduction
Breast cancer is known to one of the leading causes of cancer death among females [1]. A massive number of research studies on the genomic characterization of breast cancer, particularly the discovery of differentially expressed genes (DEGs), have revealed clinically relevant molecular subtypes [2], which has increased the accuracy of the prognosis [3–5] and has resulted in successful targeted therapy [6, 7]. During recent decades, resources based on high-throughput sequencing technologies, such as The Cancer Genome Atlas (TCGA) [8] and International Cancer Genome Consortium (ICGC) [9], have facilitated more accurate detection of DEGs and cancer driver genes. The identification of DEGs is prominent, in that it leads to more accurate subtyping and more precise treatment for various types of cancers.
In transcriptome analysis based on microarray [10] or RNA sequencing [11] by next-generation sequencing, DEGs are usually identified by statistical tests, such as t test, nonparametric test, and Bayesian models [12]. Subsequent analysis of pathways and functional enrichment tests for DEGs are performed to increase the understanding of molecular mechanisms [13].
In the case of breast cancer, it is well known that molecular subtype and patient age are strongly associated with clinical features, such as survival rate. Fredholm et al. [14] reported that the 5-year survival rate was lowest in the of 25–34-year-old age group and decreased with increasing age. Likewise, Gnerlich et al. [15] reported that younger women were more likely to die from breast cancer than older ones, based on the statistics of 243,012 breast cancer patients. Recently, Azim et al. [16] studied genomic aberrations in young and elderly breast cancer patients based on TCGA data. They found that older patients had more somatic mutations and copy number variations (CNVs) and that 11 mutations and two CNVs were independently associated with age at diagnosis.
In this work, we aimed to classify human genes based on age-specific differential expression between normal and breast cancer cells. DEGs were identified based on their p-values for differential gene expression between tumor and matched normal cells. DEGs and non-DEGs were then classified based on age-specific differential expression by the three age groups we defined. To show an application of the classification, we compared the accuracy of prediction models that distinguish normal and tumor cells, constructed by support vector machine (SVM) using various combinations of genes by class. The performance of SVM was measured by the average area under the receiver operating characteristics curve value after 1,000 times bootstrap.
Methods
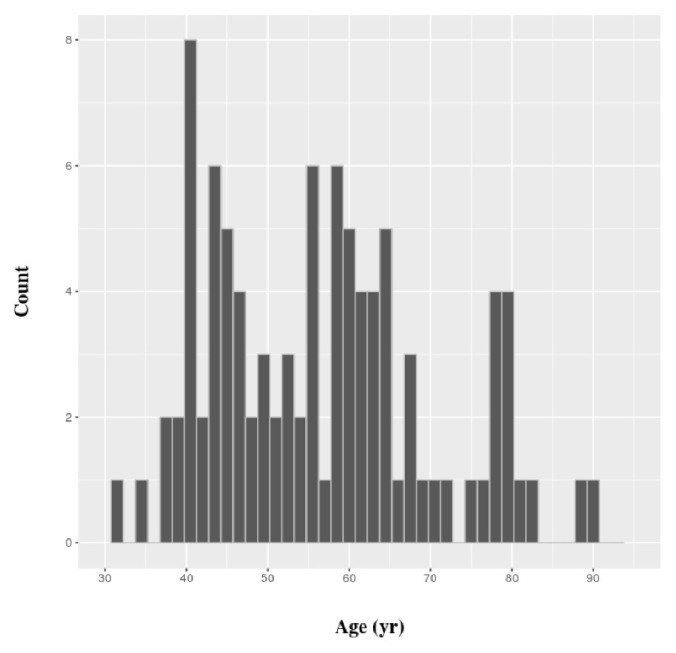
All gene expression values in this work were gathered from TCGA. Eligible patients had complete clinical data and a gene expression dataset of breast cancer cells and matched normal cells. Eventually, we retrieved the gene expression values of tumor and matched normal cells of 96 patients. The distribution of their ages is shown in Fig. 1. The values for gene expression level that we used were generated by the Illumina Hi-Seq platform (Illumina, Inc., San Diego, CA, USA) and normalized by root square error methods [17]. All subsequent statistical analyses were carried out using R, version 3.2.3. SVM classifiers were constructed using the e1071 package of R, and a simple linear kernel was used. Functional enrichment analysis of gene classes was performed in ToppGene Suite [18].
Fig. 1.
Distribution of age of breast cancer patients analyzed in this work.
Young patients were defined as ≤45 years of age, and elderly patients were defined as those ≥60 years of age (Fig. 1). The rest of the patients were defined as “intermediate.” The statistical significance of differential expression between tumor and matched normal cells was determined by paired t test, based on a p-value threshold of 8.48 × 10⁻⁷. The threshold value was set based on the Bonferroni correction, because a test was performed for each age group, and three age groups were defined for each of the 19,646 genes.
Results and Discussion
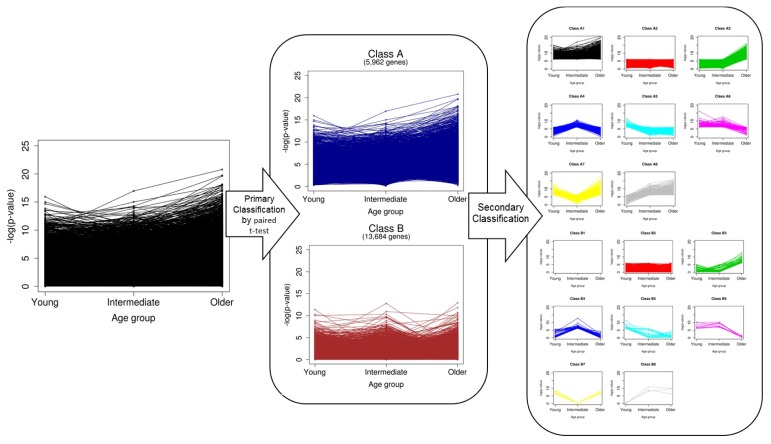
The overall scheme of our classification is depicted in Fig. 2. We first divided genes into two classes (A and B) by paired t test without considering age. A total of 5,962 genes in class A were defined as significant DEGs in breast cancer, and 13,684 in class B were nonsignificant. Ones who want to find biomarkers or driver genes are likely to investigate only genes in class A. However, we classified the genes of each class once again into eight groups, based on the pattern of p-values, which were calculated separately for every age group (secondary classification in Fig. 2). After a second round of classification, the genes were eventually divided into 16 classes (A1–B8) (Supplementary Table 1). The numbers of genes of the classes are shown in Table 1.
Fig. 2.
Schematic view of overall procedures of the two-step classification.
Table 1.
Definition of classification of genes based on age-specific significance and the corresponding number of genes
| Secondary class | Young | Intermediate | Older | Primary class | |
|---|---|---|---|---|---|
| A | B | ||||
| 1 | Significant | Significant | Significant | 377 | 0 |
| 2 | Nonsignificant | Nonsignificant | Nonsignificant | 4,495 | 13,548 |
| 3 | Nonsignificant | Nonsignificant | Significant | 781 | 69 |
| 4 | Nonsignificant | Significant | Nonsignificant | 56 | 29 |
| 5 | Significant | Nonsignificant | Nonsignificant | 44 | 18 |
| 6 | Significant | Significant | Nonsignificant | 28 | 9 |
| 7 | Significant | Nonsignificant | Nonsignificant | 71 | 8 |
| 8 | Nonsignificant | Significant | Significant | 110 | 3 |
Significances were defined based on the p-value of paired t test.
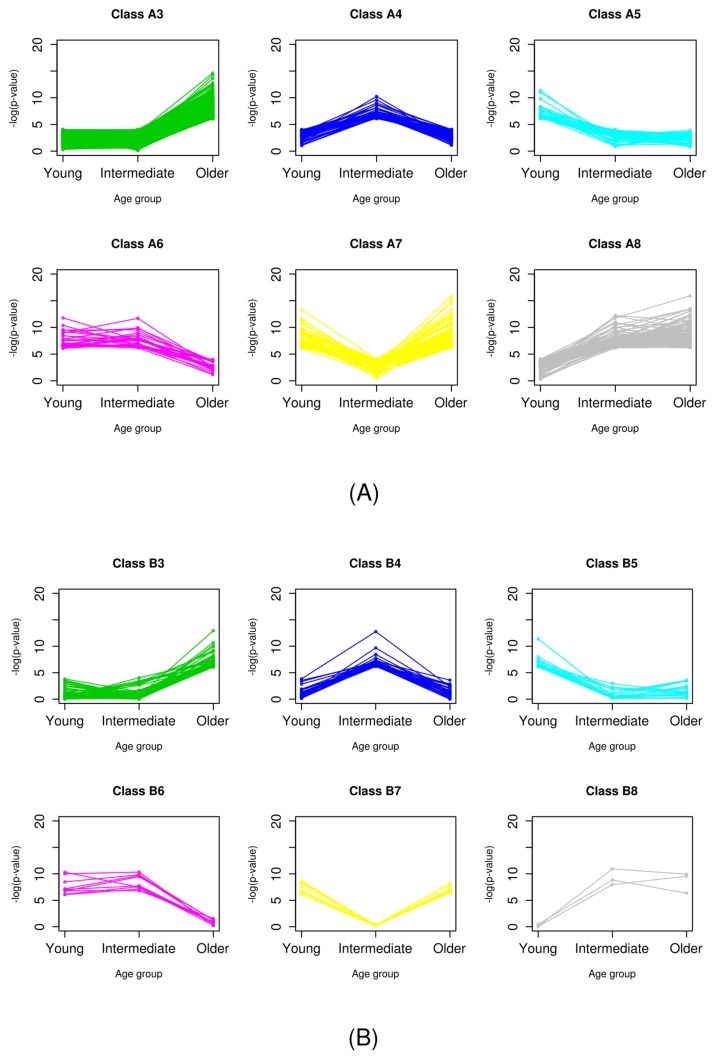
It was easily observed that there was no gene classified as class B1. Probably, this was because the significance of genes in class B was already tested in the primary classification step, and no genes showed significance over all age groups. The 377 genes in class A1 exhibited differential expression for every age group and all samples. These genes are the most powerful DEGs between normal and breast cancer cells. Genes of class 2, which did not have significantly different expression in any age group, accounted for the majority in both classes A and B. Indeed, classes 1 and 2 did not have any age-specific significance. Thus, we focused on the genes of classes 3–8, which showed age-specific differential expression (Fig. 3).
Fig. 3.
Patterns of significance of age-specific differential expression of class A (A) and class B (B).
Functional enrichment analysis for each class was performed, but we could not find any relevant or intriguing biological implications or pathways related to breast cancer. Hence, we decided to provide the results of the analysis as raw data (Supplementary Table 2) rather than trying an unfeasible deduction.
To show an example of how the classification can be applied, we constructed prediction models that aimed to distinguish normal and breast cancer cells, using the expression values of various combinations of genes. We defined two types of combinations comprising gene lists. For type I combinations, genes were chosen evenly from each class. By contrast, genes were chosen randomly for type II combinations without considering gene class. For example, if we make a list composed of three genes from classes 3, 4, and 5, the type I combination should consist of a gene from class 3, another from class 4, and the other one from class 5, but a type II combination could be composed of any genes randomly chosen from the pool of the three classes.
We compared the accuracies of the SVM of type I and II combinations for three subsets each for classes A and B (Table 2). The performance of type I was significantly better than that of type II, except in two cases (classes 6–8 in both classes A and B), the genes of which were significantly differentially expressed in the two age groups.
Table 2.
Comparison of performance of SVM models of different combinations of genes to distinguish breast cancer and normal cells
| Input genes (N) | Sampling pool | Type I (one gene per class) | Type II (n random genes from the pool) | p-value |
|---|---|---|---|---|
| 3 | Classes A3–A5 | 0.9351 | 0.9215 | 4.732e-16 |
| 3 | Classes A6–A8 | 0.9660 | 0.9662 | 0.8391 |
| 6 | Classes A3–A8 | 0.9842 | 0.9743 | 2.2e-16 |
| 3 | Classes B3–B5 | 0.8701 | 0.8522 | 1.441e-15 |
| 3 | Classes B6–B8 | 0.9269 | 0.9392 | 0.4868 |
| 6 | Classes B3–B8 | 0.9386 | 0.9227 | 6.984e-09 |
N input genes were sampled from each sampling pool by adopting two types of combinations (types I and II).
SVM, support vector machine.
These results highlight the value of gene classification based on our method. Based on the first classification, 13,684 genes in class B were probably considered genes that cannot distinguish normal and breast cancer cells. However, by adapting one more classification step based on age-specific differential expression, we identified 171 age-specific DEGs in classes B3–B8. Despite the underestimated value of the classes, we showed that a balanced selection of genes from these classes could be applied as biomarkers, identifying breast cancer from normal cells. For example, genes that are known to be high-penetrance breast cancer susceptibility genes, such as TP53, STK11, and CDH11, and moderate-penetrance genes, such as RAD50, RAD51C, RAD51D, NBS1, and FANCM, were classified in class B2 [19]. In addition to proposing the possibility of genes in class B as biomarkers, even for class A, we exhibited that our method of selecting biomarker genes based on secondary classification could be useful in making a combination of biomarker genes for a more accurate prediction by using different classes complementarily.
In summary, we retrieved a gene expression dataset of breast cancer and matched normal cells from TCGA and then classified the genes into 16 classes by two-step classification. This classification could be applied to generate a more accurate prediction model for identifying cancer. Furthermore, we expect that our scheme of classification could be used for other types of cancer data.
Acknowledgments
This work was supported by the National Research Foundation of Korea (NRF), funded by the Ministry of Science and ICT (NRF-2017R1C1B2008617, NRF-2017M3A9B6061511, and NRF-2017M3C9A604761) and KREONET (Korea Research Environment Open NETwork) which is managed and operated by KISTI (Korea Institute of Science and Technology Information). GL was supported by a Sangji University scholarship for research assistants.
Footnotes
Authors’ contribution
Conceptualization: ML
Data curation: GL
Formal analysis: GL, ML
Funding acquisition: ML
Methodology: GL
Writing – original draft: GL, ML
Writing – review & editing: ML
Supplementary materials
Supplementary data including two tables can be found with this article online at http://www.genominfo.org/src/sm/gni-15-156-s001.pdf.
Functional enrichment analysis for each class by ToppGene
List of 1,338 potential inhibitors of AP endonuclease 1 by pharmacophore screening and molecular docking
References
- 1.Torre LA, Bray F, Siegel RL, Ferlay J, Lortet-Tieulent J, Jemal A. Global cancer statistics, 2012. CA Cancer J Clin. 2015;65:87–108. doi: 10.3322/caac.21262. [DOI] [PubMed] [Google Scholar]
- 2.Perou CM, Sørlie T, Eisen MB, van de Rijn M, Jeffrey SS, Rees CA, et al. Molecular portraits of human breast tumours. Nature. 2000;406:747–752. doi: 10.1038/35021093. [DOI] [PubMed] [Google Scholar]
- 3.Rouzier R, Perou CM, Symmans WF, Ibrahim N, Cristofanilli M, Anderson K, et al. Breast cancer molecular subtypes respond differently to preoperative chemotherapy. Clin Cancer Res. 2005;11:5678–5685. doi: 10.1158/1078-0432.CCR-04-2421. [DOI] [PubMed] [Google Scholar]
- 4.Parker JS, Mullins M, Cheang MC, Leung S, Voduc D, Vickery T, et al. Supervised risk predictor of breast cancer based on intrinsic subtypes. J Clin Oncol. 2009;27:1160–1167. doi: 10.1200/JCO.2008.18.1370. [DOI] [PMC free article] [PubMed] [Google Scholar]
- 5.Carey LA, Dees EC, Sawyer L, Gatti L, Moore DT, Collichio F, et al. The triple negative paradox: primary tumor chemosensitivity of breast cancer subtypes. Clin Cancer Res. 2007;13:2329–2334. doi: 10.1158/1078-0432.CCR-06-1109. [DOI] [PubMed] [Google Scholar]
- 6.Nahta R, Yu D, Hung MC, Hortobagyi GN, Esteva FJ. Mechanisms of disease: understanding resistance to HER2-targeted therapy in human breast cancer. Nat Clin Pract Oncol. 2006;3:269–280. doi: 10.1038/ncponc0509. [DOI] [PubMed] [Google Scholar]
- 7.Lehmann BD, Bauer JA, Chen X, Sanders ME, Chakravarthy AB, Shyr Y, et al. Identification of human triple-negative breast cancer subtypes and preclinical models for selection of targeted therapies. J Clin Invest. 2011;121:2750–2767. doi: 10.1172/JCI45014. [DOI] [PMC free article] [PubMed] [Google Scholar]
- 8.Cancer Genome Atlas Research Network. Weinstein JN, Collisson EA, Mills GB, Shaw KR, Ozenberger BA, et al. The Cancer Genome Atlas Pan-Cancer analysis project. Nat Genet. 2013;45:1113–1120. doi: 10.1038/ng.2764. [DOI] [PMC free article] [PubMed] [Google Scholar]
- 9.International Cancer Genome Consortium. Hudson TJ, Anderson W, Artez A, Barker AD, Bell C, et al. International network of cancer genome projects. Nature. 2010;464:993–998. doi: 10.1038/nature08987. [DOI] [PMC free article] [PubMed] [Google Scholar]
- 10.Brown PO, Botstein D. Exploring the new world of the genome with DNA microarrays. Nat Genet. 1999;21(1 Suppl):33–37. doi: 10.1038/4462. [DOI] [PubMed] [Google Scholar]
- 11.Morin R, Bainbridge M, Fejes A, Hirst M, Krzywinski M, Pugh T, et al. Profiling the HeLa S3 transcriptome using randomly primed cDNA and massively parallel short-read sequencing. Biotechniques. 2008;45:81–94. doi: 10.2144/000112900. [DOI] [PubMed] [Google Scholar]
- 12.Efron B, Tibshirani R. Empirical bayes methods and false discovery rates for microarrays. Genet Epidemiol. 2002;23:70–86. doi: 10.1002/gepi.1124. [DOI] [PubMed] [Google Scholar]
- 13.Draghici S, Khatri P, Martins RP, Ostermeier GC, Krawetz SA. Global functional profiling of gene expression. Genomics. 2003;81:98–104. doi: 10.1016/s0888-7543(02)00021-6. [DOI] [PubMed] [Google Scholar]
- 14.Fredholm H, Eaker S, Frisell J, Holmberg L, Fredriksson I, Lindman H. Breast cancer in young women: poor survival despite intensive treatment. PLoS One. 2009;4:e7695. doi: 10.1371/journal.pone.0007695. [DOI] [PMC free article] [PubMed] [Google Scholar]
- 15.Gnerlich JL, Deshpande AD, Jeffe DB, Sweet A, White N, Margenthaler JA. Elevated breast cancer mortality in women younger than age 40 years compared with older women is attributed to poorer survival in early-stage disease. J Am Coll Surg. 2009;208:341–347. doi: 10.1016/j.jamcollsurg.2008.12.001. [DOI] [PMC free article] [PubMed] [Google Scholar]
- 16.Azim HA, Jr, Nguyen B, Brohée S, Zoppoli G, Sotiriou C. Genomic aberrations in young and elderly breast cancer patients. BMC Med. 2015;13:266. doi: 10.1186/s12916-015-0504-3. [DOI] [PMC free article] [PubMed] [Google Scholar]
- 17.Cancer Genome Atlas Network Comprehensive molecular portraits of human breast tumours. Nature. 2012;490:61–70. doi: 10.1038/nature11412. [DOI] [PMC free article] [PubMed] [Google Scholar]
- 18.Chen J, Bardes EE, Aronow BJ, Jegga AG. ToppGene Suite for gene list enrichment analysis and candidate gene prioritization. Nucleic Acids Res. 2009;37:W305–W311. doi: 10.1093/nar/gkp427. [DOI] [PMC free article] [PubMed] [Google Scholar]
- 19.Economopoulou P, Dimitriadis G, Psyrri A. Beyond BRCA: new hereditary breast cancer susceptibility genes. Cancer Treat Rev. 2015;41:1–8. doi: 10.1016/j.ctrv.2014.10.008. [DOI] [PubMed] [Google Scholar]
Associated Data
This section collects any data citations, data availability statements, or supplementary materials included in this article.
Supplementary Materials
Functional enrichment analysis for each class by ToppGene
List of 1,338 potential inhibitors of AP endonuclease 1 by pharmacophore screening and molecular docking


