

Abstract
Objective
To compare the cost and healthcare utilization of patients with obesity and Type 2 diabetes mellitus (T2DM) randomized into either Roux-en-Y gastric bypass (RYGB) surgery or an intensive lifestyle and medical intervention (ILMI).
Methods
This analysis (N=745) is based on two-year follow-up of a small randomized controlled trial (RCT); adult patients with obesity and T2DM were recruited between 2011 and 2012 from Group Health Cooperative. Comparisons were made for patients randomized into either RYGB (N=15) or ILMI (N=17).
Results
There were no significant cost savings for RYGB vs. ILMI patients through the follow-up years. Pharmacy cost was lower for RYGB vs. ILMI patients by about $900 in year 2 vs. year 0; however, inpatient and emergency room costs were higher for surgery patients in follow-up years relative to year 0. Median total cost for non-randomized patients was higher in year 0 and in year 2 compared to randomized patients.
Conclusions
Bariatric surgery is not cost-saving in the short term. Moreoover, the costs of patients who enter into RCTs of RYGB may differ from that of those who do not enter RCTs, suggesting use of caution when using such data to draw inferences about the general population with obesity.
Keywords: bariatric surgery, type 2 diabetes mellitus, randomized controlled trial, healthcare utilization, cost
INTRODUCTION
Type 2 diabetes mellitus (T2DM) is a widely prevalent health condition affecting between 12% and 14% of the adult US population in 2011-20121 and is associated with substantial healthcare costs ($176 billion)2. Although the prevalence of T2DM is quite high, it has remained fairly stable between 2007-2008 and 2011-20121, in line with trends in obesity3 – the single most important predictor of developing T2DM4.
Bariatric surgery is an intervention which has been shown to outperform conventional medication and lifestyle regimens in terms of remission of T2DM for patients with obesity in a relatively short follow-up period (1-2 years)5, 6, 7, 8 as well as in a longer 5-year follow-up9. Although the clinical advantages of bariatric surgery over a medication and lifestyle intervention have been well established, there is mixed evidence on the healthcare resource use and cost implications of surgery vs. the conventional treatments (see Narbro et al.10, Neovius et al.11 and Ikramuddin et al.12).
The vast majority of studies assessing the impact of bariatric surgery on healthcare resource use and costs for T2DM patients have used a retrospective cohort analytical approach to compare the outcomes of surgical patients in the post- versus pre-surgical period either with or without a matched control group. Randomized controlled studies of bariatric surgery vs. lifestyle and medical intervention to examine cost and resource use measures are scant.
This analysis is based on a small randomized trial with two years of follow-up that was recruited from a much larger cohort of patients who were offered participation in the trial via an informed decision making activity around bariatric surgery. We conduct a descriptive analysis of the cost and healthcare utilization of patients with obesity and T2DM who were ultimately randomized to Roux-en-Y gastric bypass (RYGB) surgery (N=15) or an intensive lifestyle and medical intervention (ILMI) (N=17). The ILMI comprised in-person and telephone-based program of exercise intervention, calorie-reduction intervention, and diabetes-related medical care.8
METHODS
Patients for the study were recruited at Group Health Cooperative (GHC) between July 2011 and June 2012, using a shared decision-making approach (SDM), that has been described in detail in Arterburn et al. (2013)13. GHC is a member-governed healthcare system that coordinates both care and insurance coverage and is currently serving more than 600,000 residents in Washington state and north Idaho. All study procedures were reviewed and approved by the Institutional Review Boards of University of Washington, Group Health Research Institute and the Fred Hutchinson Cancer Research Center.
Subjects for the trial included patients who were between 25 and 64 years, had a body mass index (BMI) of 30–45 kg/m2, were currently on medications for T2DM, had health insurance coverage for bariatric surgery procedure (for BMI 35–45 kg/m2), and had no evidence of contraindications for participation in the trial13.
An outline of the recruitment process (see Arterburn et al. (2013) and Cummings et al. (2015) for details) for the sample is depicted in Figure 1. Briefly, there were a total of 1,808 patients who met initial inclusion criteria and were invited to participate in a pre-trial screening survey that investigated patients’ attitudes and prior experiences with weight loss treatment (Box I). Of these, 745 individuals did not respond to the screening call, either because they could not be contacted, or refused to participate when contacted, or were deceased (Box II); the remaining 1,063 individuals started the screening process with a phone call (Box III). Among those who were available for the screening call, 268 people did not complete the call or did not consent to allow their electronic medical record (EMR) data to be used for research (Box IV); the remaining 795 individuals completed the screening call and consented to use of the EMR for research (Box V). Among these 795 individuals, cost and utilization data was not available for 50 individuals for the second year after their screening survey (Box VI), and they were excluded from the analysis; the remaining 745 individuals who completed the screening survey and who provided consent for use of data from the survey and their electronic medical records during the study period comprise our analytical study sample (Box VII). Utlimately, 41 patients agreed to be randomized (Box VIII) to bariatric surgery (N=15; Box X) or ILMI (N=17; Box XI) and 9 patients withdrew (Box XII) from the study after learning about their treatment assignment; 704 patients were not randomized (Box IX) - 5 patients from this group went on to get bariatric surgery (Box XIII).
Figure 1. Flow diagram of patient recruitment1.
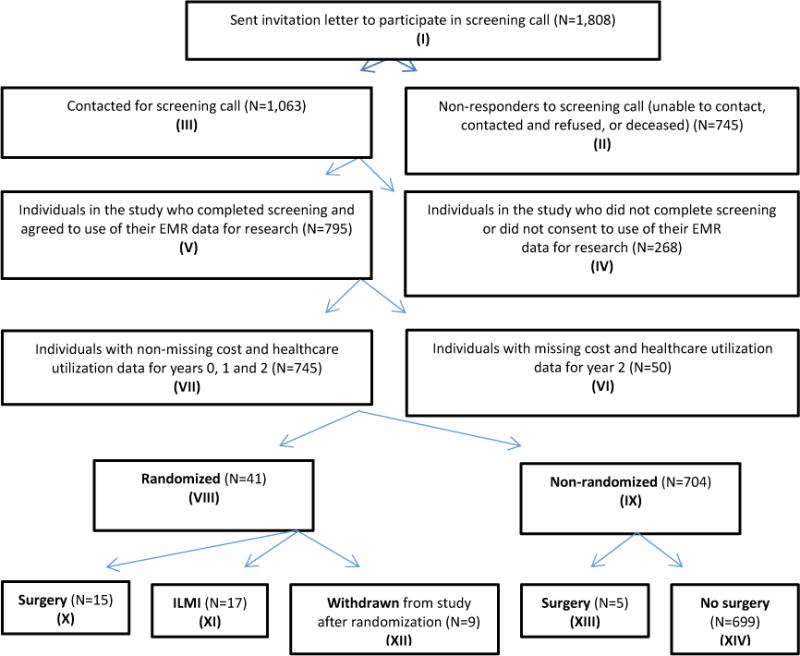
ILMI: intensive lifestyle and medical intervention
1This figure is adapted from the subject identification and recruitment flow diagram in Arterburn et al. (2013): Fig. 1.
We are primarily interested in comparing the cost and healthcare utilization outcomes for patients who ultimately completed the recruitment process and were randomized into either the surgery (Box X) or the ILMI (Box XI) group, although we also report these same outcomes for those that withdrew after randomization (Box XII). In addition, we compare the total costs for randomized (Box VIII) vs. non-randomized patients (Box IX).
Outcomes
The cost outcomes consist of: total costs, inpatient costs, outpatient costs, primary care costs, specialty care costs, pharmacy costs, emergency room costs, and other outpatient costs. Group Health costs are closer to the realized or true cost of health care than most traditional cost accounting schemes used in health services research that are based on charges.
For healthcare utilization measures, we examined the number of outpatient visits, number of inpatient hospitalizations, number of emergency room visits, and number of prescription fills.
Analysis
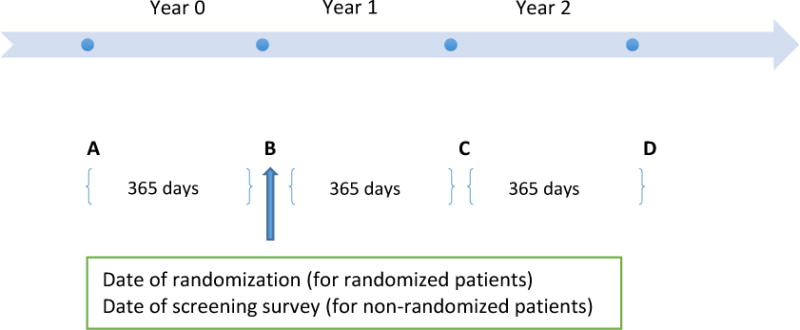
We extracted cost and healthcare utilization data for all patients in our study sample for three time periods: (1) year 0, (2) year 1, and (3) year 2. Figure 2 shows the different periods used in the analysis. Point B is the point of reference and corresponds to the date of randomization for the randomized patients (Box VIII) and the date of screening survey for the non-randomized patients (Box IX). Year 0 corresponds to 365 days prior to the reference date and is the baseline period (AB); year 1 corresponds to 365 days post reference date (BC), and year 2 corresponds to the 365-day period after end of year 1 (CD). The baseline characteristics of the randomized patients (surgery vs. ILMI vs. withdrawn) were compared using Fisher’s exact test (ANOVA) for categorical (continuous) variables and that of those for randomized vs. non-randomized patients compared using Fisher’s exact test (t-test) for categorical (continuous) variables. The outcomes were compared across the different cohorts for each time period using alternative measures of central tendency. The Wilcoxon-Mann-Whitney test (Kruskall-Wallis H test) is a non-parametric test and appropriate to test for differences in non-normally distributed outcomes between two (two or more) groups. For the surgery (Box X) and ILMI (Box XI) patients, we report the differences in outcomes between year 2 and year 0 (i.e., time differencing). In the next step, we take the difference in the outcomes between the two groups post time differencing (i.e., difference-in-differences estimator), to provide a measure of the impact of surgery on the cost and healthcare utilization outcomes. The statistical analysis was performed using STATA software, version 1314.
Figure 2. Depiction of time periods used in analysis.
RESULTS
Sample characteristics
In order to understand differences in the demographic, socio-economic and clinical characteristics of the randomized (N=41; Figure 1, Box VIII) and non-randomized patients (N = 704; Figure 1, Box IX), we present the summary statistics in year 0 in Table 1. The mean age of the randomized patients was 53 years and significantly higher (55 years) for the non-randomized patients; the majority of the randomized patients were female (63%) relative to 49% females in the non-randomized sample. A plurality of the randomized and non-randomized patients had some college education and had income between $50,000 and $100,000. The BMI distribution of the randomized patients was significantly different from that of the non-randomized patients, implying a higher mean BMI in the randomized group. The surgery (Figure 1, Box X), ILMI (Figure 1, Box XI) and withdrawn (Figure 1, Box XII) groups among the randomized patients were not statistically different along the various measures in year 0.
Table 1.
Descriptive statistics of randomized and non-randomized patients in year 0
| Randomized (N=41)
|
Non-randomized (N=704)
|
||||||
|---|---|---|---|---|---|---|---|
| N (%) | Surgery (N=15) |
ILMI (N=17) |
Withdrawn (N=9) |
Total (N=41) |
p-value† (Surgery vs. ILM vs. Withdrawn) |
Total (N=704) |
p-value†† (Randomized vs. Non-randomized) |
| Age, mean (SD) | 52.1 (2.2) | 54.8 (1.5) | 50.8 (2.5) | 53.0 (1.2) | 0.369 | 55.0 (0.3) | 0.091 |
| Female | 12 (80.0%) | 10 (58.8%) | 4 (44.4%) | 26 (63.4%) | 0.188 | 348 (49.4%) | 0.107 |
| Education | 0.889 | 0.547 | |||||
| Less than high school | 1 (6.7%) | 2 (11.8%) | 2 (22.2%) | 5 (12.2%) | 124 (17.6%) | ||
| Some college | 7 (46.7%) | 6 (35.3%) | 4 (44.4%) | 17 (41.5%) | 288 (40.9%) | ||
| College degree | 5 (33.3%) | 6 (35.3%) | 3 (33.3%) | 14 (34.1%) | 176 (25.0%) | ||
| Graduate degree | 2 (13.3%) | 3 (17.6%) | 0 (0.0%) | 5 (12.2%) | 115 (16.3%) | ||
| Income | 0.801 | 0.798 | |||||
| Less than $20,000 | 1 (6.7%) | 0 (0.0%) | 0 (0.0%) | 1 (2.4%) | 49 (7.0%) | ||
| $20,000 – $50,000 | 5 (33.3%) | 4 (23.5%) | 3 (33.3%) | 12 (29.3%) | 192 (27.3%) | ||
| $50,000 – $100,000 | 6 (40.0%) | 6 (35.3%) | 4 (44.4%) | 16 (39.0%) | 272 (38.6%) | ||
| > $100,000 | 3 (20.0%) | 6 (35.3%) | 1 (11.1%) | 10 (24.4%) | 154 (21.9%) | ||
| Married | 9 (60.0%) | 14 (82.4%) | 5 (55.6%) | 28 (68.3%) | 0.294 | 477 (67.8%) | 1.000 |
| Non-white | 3 (20.0%) | 7 (41.2%) | 4 (44.4%) | 14 (34.1%) | 0.371 | 260 (36.9%) | 0.868 |
| County | 0.334 | 0.501 | |||||
| Pierce | 4 (26.7%) | 3 (17.6%) | 2 (22.2%) | 9 (22.0%) | 108 (15.3%) | ||
| King | 10 (66.7%) | 14 (82.4%) | 5 (55.6%) | 29 (70.7%) | 534 (75.9%) | ||
| Snohomish | 1 (6.7%) | 0 (0.0%) | 2 (22.2%) | 3 (7.3%) | 62 (8.8%) | ||
| Body mass index | 0.682 | 0.020 | |||||
| 30–34.9 | 3 (20.0%) | 5 (29.4%) | 1 (11.1%) | 9 (22.0%) | 297 (42.2%) | ||
| 35–39.9 | 9 (60.0%) | 11 (64.7%) | 6 (66.7%) | 26 (63.4%) | 302 (42.9%) | ||
| 40–44.9 | 3 (20.0%) | 1 (5.9%) | 2 (22.2%) | 6 (14.6%) | 105 (14.9%) | ||
| Hypertension | 7 (46.7%) | 11 (64.7%) | 7 (77.8%) | 25 (61.0%) | 0.326 | 492 (69.9%) | 0.227 |
| Dyslipidemia | 11 (73.3%) | 15 (88.2%) | 6 (66.7%) | 32 (78.0%) | 0.384 | 489 (69.5%) | 0.295 |
| Heart disease | 1 (6.7%) | 1 (5.9%) | 0 (0.0%) | 32 (78.0%) | 1.000 | 83 (11.8%) | 0.214 |
| Sleep apnea | 3 (20.0%) | 8 (47.1%) | 5 (55.6%) | 16 (39.0%) | 0.165 | 235 (33.4%) | 0.498 |
| Heart attack | 1 (6.7%) | 1 (5.9%) | 0 (0.0%) | 2 (4.9%) | 1.000 | 44 (6.3%) | 1.000 |
| Stroke | 1 (6.7%) | 0 (0.0%) | 0 (0.0%) | 1 (2.4%) | 0.585 | 38 (5.4%) | 0.717 |
| Arthritis | 3 (20.0%) | 6 (35.3%) | 1 (11.1%) | 10 (24.4%) | 0.415 | 259 (36.8%) | 0.132 |
Notes:
p-value from ANOVA comparisons for continuous variable and from that of Fisher’s exact test for categorical variables.
p-value from two-sample t-test for continuous variable and from that of Fisher’s exact test for categorical variables.
ILMI: intensive lifestyle and medical intervention.
Withdrawn: group of patients that were randomized to surgery/ILMI, but withdrew after learning about their treatment assignment.
Comparison of healthcare cost and healthcare utilization among randomized patients
Healthcare cost
In Table 2 we compare the healthcare costs among patients in the different randomized groups—(a) surgery, (b) ILMI and (c) withdrew after randomization—for year 0, year 1 and year 2. Among the surgery, ILMI and withdrew after randomization groups, median total costs in year 0 were similar ($3,547, $3,875 and $4,121, respectively) and trended downward in year 2 for the surgery and ILMI patients: $2,909 vs. $3,191, respectively, but was higher for those that withdrew after randomization ($6,088). The difference in median total costs for the surgery group relative to the ILMI group in year 2 vs. year 0 was marginal ($47), providing no evidence of total cost savings for the surgery group (vis-a-vis ILMI group) in year 2. Median inpatient costs for the surgery patients in year 1 were about $25,000 (Table 2, panel B), reflecting costs of (and associated with) the bariatric surgical procedure.
Table 2.
Healthcare costs for randomized patients by year
| A. Total costs ($)
| |||||||||||||||
|---|---|---|---|---|---|---|---|---|---|---|---|---|---|---|---|
| Year 0 | Year 1 | Year 2 | Year 2 – Year 0 | Diff-in-Diff | |||||||||||
|
|
|||||||||||||||
| Surgery | ILMI | With- drawn |
P† (Surgery vs. ILMI) |
Surgery | ILMI | With- drawn |
P† (Surgery vs. ILMI) |
Surgery | ILMI | With- drawn |
P† (Surgery vs. ILMI) |
Surgery | ILMI | (Y2surg – Y0surg) – (Y2ILMI – Y0ILMI) |
|
| N | 15 | 17 | 9 | 15 | 17 | 9 | 15 | 17 | 9 | ||||||
| Mean | 6,486 | 4,931 | 8,101 | 0.66 | 38,815 | 5,514 | 6,519 | 0.00 | 6,193 | 5,525 | 19,064 | 0.89 | −292 | 594 | −886 |
| SD | (1,482) | (833) | (3,639) | (1,660) | (1,170) | (1,855) | (2,094) | (1,301) | (12,543) | ||||||
| Median | 3,547 | 3,875 | 4,121 | 1.00 | 38,498 | 3,681 | 5,632 | 0.00 | 2,909 | 3,191 | 6,088 | 1.00 | −638 | −685 | 47 |
| Min | 1,290 | 1,073 | 1,308 | 29,490 | 803 | 387 | 927 | 847 | 899 | ||||||
| Max | 18,290 | 12,764 | 35,932 | 52,336 | 19,310 | 16,500 | 32,081 | 21,923 | 118,478 | ||||||
|
B. Inpatient costs ($) | |||||||||||||||
| Year 0 | Year 1 | Year 2 | Year 2 – Year 0 | Diff-in-Diff | |||||||||||
|
|
|||||||||||||||
| Surgery | ILMI | With-drawn |
P† (Surgery vs. ILMI) |
Surgery | ILMI | With-drawn |
P† (Surgery vs. ILMI) |
Surgery | ILMI | With-drawn |
P† (Surgery vs. ILMI) |
Surgery | ILMI | (Y2surg – Y0surg) – (Y2ILMI – Y0ILMI) | |
|
| |||||||||||||||
| N | 15 | 17 | 9 | 15 | 17 | 9 | 15 | 17 | 9 | ||||||
| Mean | 0 | 0 | 2,271 | . | 25,355 | 0 | 0 | 0.00 | 663 | 0 | 9,291 | 0.29 | 663 | 0 | 663 |
| SD | (0) | (0) | (2,271) | (874) | (0) | (0) | (663) | (0) | (9,291) | ||||||
| Median | 0 | 0 | 0 | . | 25,355 | 0 | 0 | 0.00 | 0 | 0 | 0 | 0.95 | 0 | 0 | 0 |
| Min | 0 | 0 | 0 | 18,725 | 0 | 0 | 0 | 0 | 0 | ||||||
| Max | 0 | 0 | 20,437 | 30,667 | 0 | 0 | 9,939 | 0 | 83,617 | ||||||
|
C. Outpatient costs ($) | |||||||||||||||
| Year 0 | Year 1 | Year 2 | Year 2 – Year 0 | Diff-in-Diff | |||||||||||
|
|
|||||||||||||||
| Surgery | ILMI | With-drawn |
P† (Surgery vs. ILMI) |
Surgery | ILMI | With-drawn |
P† (Surgery vs. ILMI) |
Surgery | ILMI | With-drawn |
P† (Surgery vs. ILMI) |
Surgery | ILMI | (Y2surg – Y0surg) – (Y2meds – Y0meds) | |
|
| |||||||||||||||
| N | 15 | 17 | 9 | 15 | 17 | 9 | 15 | 17 | 9 | ||||||
| Mean | 6,486 | 4,931 | 5,830 | 0.66 | 13,460 | 5,514 | 6,519 | 0.00 | 5,531 | 5,525 | 9,773 | 0.89 | −955 | 594 | −1549 |
| SD | (1,482) | (833) | (1,612) | (1,402) | (1,170) | (1,855) | (1,540) | (1,301) | (3,569) | ||||||
| Median | 3,547 | 3,875 | 4,121 | 1.00 | 13,203 | 3,681 | 5,632 | 0.00 | 2,909 | 3,191 | 6,088 | 1.00 | −638 | −685 | 47 |
| Min | 1,290 | 1,073 | 1,308 | 4,135 | 803 | 387 | 927 | 847 | 899 | ||||||
| Max | 18,290 | 12,764 | 15,494 | 23,322 | 19,310 | 16,500 | 22,142 | 21,923 | 34,860 | ||||||
|
D. Primary care costs ($) | |||||||||||||||
| Year 0 | Year 1 | Year 2 | Year 2 – Year 0 | Diff-in-Diff | |||||||||||
|
|
|||||||||||||||
| Surgery | ILMI | With-drawn |
P† (Surgery vs. ILMI) |
Surgery | ILMI | With-drawn |
P† (Surgery vs. ILMI) |
Surgery | ILMI | With-drawn |
P† (Surgery vs. ILMI) |
Surgery | ILMI | (Y2surg – Y0surg) – (Y2ILMI – Y0ILMI) | |
|
| |||||||||||||||
| N | 15 | 17 | 9 | 15 | 17 | 9 | 15 | 17 | 9 | ||||||
| Mean | 802 | 954 | 1,103 | 0.84 | 881 | 856 | 1,445 | 0.61 | 834 | 950 | 1,664 | 0.78 | 32 | −4 | 36 |
| SD | (163) | (191) | (311) | (119) | (144) | (364) | (159) | (228) | (523) | ||||||
| Median | 634 | 554 | 958 | 1.00 | 768 | 752 | 1,433 | 1.00 | 741 | 765 | 933 | 1.00 | 107 | 211 | −104 |
| Min | 0 | 160 | 179 | 312 | 111 | 0 | 66 | 0 | 0 | ||||||
| Max | 2,135 | 2,948 | 2,688 | 1,786 | 2,048 | 3,414 | 2,310 | 4,284 | 4,199 | ||||||
|
E. Specialty care costs ($) | |||||||||||||||
| Year 0 | Year 1 | Year 2 | Year 2 – Year 0 | Diff-in-Diff | |||||||||||
|
|
|||||||||||||||
| Surgery | ILMI | With-drawn |
P† (Surgery vs. ILMI) |
Surgery | ILMI | With-drawn |
P† (Surgery vs. ILMI) |
Surgery | ILMI | With-drawn |
P† (Surgery vs. ILMI) |
Surgery | ILMI | (Y2surg – Y0surg) – (Y2ILMI – Y0ILMI) | |
|
| |||||||||||||||
| N | 15 | 17 | 9 | 15 | 17 | 9 | 15 | 17 | 9 | ||||||
| Mean | 2,204 | 1,022 | 2,107 | 0.34 | 10,267 | 2,001 | 2,441 | 0.00 | 1,939 | 1,514 | 4,436 | 0.44 | −264 | 492 | −756 |
| SD | (710) | (221) | (1,098) | (1,115) | (647) | (974) | (580) | (458) | (2,827) | ||||||
| Median | 1,495 | 566 | 773 | 0.48 | 10,122 | 784 | 1,236 | 0.00 | 979 | 810 | 929 | 0.48 | −516 | 244 | −760 |
| Min | 35 | 0 | 80 | 2,472 | 0 | 27 | 229 | 0 | 316 | ||||||
| Max | 9,254 | 2,921 | 10,094 | 15,697 | 9,106 | 8,205 | 7,854 | 6,972 | 26,715 | ||||||
|
F. Pharmacy costs ($) | |||||||||||||||
| Year 0 | Year 1 | Year 2 | Year 2 – Year 0 | Diff-in-Diff | |||||||||||
|
|
|||||||||||||||
| Surgery | ILMI | With-drawn |
P† (Surgery vs. ILMI) |
Surgery | ILMI | With-drawn |
P† (Surgery vs. ILMI) |
Surgery | ILMI | With-drawn |
P† (Surgery vs. ILMI) |
Surgery | ILMI | (Y2surg – Y0surg) – (Y2ILMI – Y0ILMI) | |
|
| |||||||||||||||
| N | 15 | 17 | 9 | 15 | 17 | 9 | 15 | 17 | 9 | ||||||
| Mean | 1,754 | 1,507 | 1,203 | 0.58 | 1,083 | 1,385 | 1,183 | 0.72 | 772 | 1,141 | 1,411 | 0.28 | −983 | −367 | −616 |
| SD | (471) | (408) | (301) | (209) | (309) | (306) | (224) | (271) | (315) | ||||||
| Median | 1,076 | 544 | 781 | 0.48 | 1,014 | 639 | 1,004 | 1.00 | 353 | 741 | 1,572 | 1.00 | −723 | 197 | −920 |
| Min | 162 | 318 | 256 | 203 | 97 | 252 | 77 | 182 | 227 | ||||||
| Max | 5,918 | 5,567 | 2,565 | 2,658 | 3,934 | 2,755 | 3,241 | 3,608 | 2,892 | ||||||
|
G. Emergency room costs ($) | |||||||||||||||
| Year 0 | Year 1 | Year 2 | Year 2 – Year 0 | ||||||||||||
|
|
|||||||||||||||
| Surgery | ILMI | With-drawn |
P† (Surgery vs. ILMI) |
Surgery | ILMI | With-drawn |
P† (Surgery vs. ILMI) |
Surgery | ILMI | With-drawn |
P† (Surgery vs. ILMI) |
Surgery | ILMI | (Y2surg – Y0surg) – (Y2ILMI – Y0ILMI) | |
|
| |||||||||||||||
| N | 15 | 17 | 9 | 15 | 17 | 9 | 15 | 17 | 9 | ||||||
| Mean | 54 | 406 | 452 | 0.90 | 339 | 28 | 375 | 0.48 | 1,085 | 384 | 140 | 0.76 | 1031 | −22 | 1052 |
| SD | (38) | (395) | (332) | (314) | (28) | (305) | (805) | (254) | (110) | ||||||
| Median | 0 | 0 | 0 | 0.69 | 0 | 0 | 0 | 0.91 | 0 | 0 | 0 | 0.78 | 0 | 0 | 0 |
| Min | 0 | 0 | 0 | 0 | 0 | 0 | 0 | 0 | 0 | ||||||
| Max | 484 | 6,722 | 3,034 | 4,722 | 473 | 2,792 | 11,655 | 3,553 | 989 | ||||||
|
H. Other costs ($) | |||||||||||||||
| Year 0 | Year 1 | Year 2 | Year 2 – Year 0 | Diff-in-Diff | |||||||||||
|
|
|||||||||||||||
| Surgery | ILMI | With-drawn |
P† (Surgery vs. ILMI) |
Surgery | ILMI | With-drawn |
P† Surgery vs. ILMI) |
Surgery | ILMI | With-drawn |
P† (Surgery vs. ILMI) |
Surgery | ILMI | (Y2surg – Y0surg) – (Y2ILMI – Y0ILMI) | |
|
| |||||||||||||||
| N | 15 | 17 | 9 | 15 | 17 | 9 | 15 | 17 | 9 | ||||||
| Mean | 1,672 | 1,042 | 966 | 0.09 | 889 | 1,244 | 1,075 | 0.18 | 901 | 1,537 | 2,122 | 0.42 | −771 | 494 | −1265 |
| SD | (618) | (457) | (309) | (98) | (476) | (587) | (370) | (662) | (874) | ||||||
| Median | 684 | 410 | 585 | 0.48 | 698 | 596 | 329 | 0.48 | 348 | 579 | 486 | 0.48 | −336 | 169 | −505 |
| Min | 207 | 141 | 132 | 241 | 19 | 72 | 55 | 0 | 63 | ||||||
| Max | 8,914 | 8,083 | 2,606 | 1,478 | 7,749 | 5,610 | 5,571 | 10,400 | 7,436 | ||||||
Notes:
p-value for the two-sample Wilcoxon-Mann-Whitney test is reported for the difference in mean for surgery and ILMI groups
ILMI: intensive lifestyle and medical intervention
Withdrawn: group of patients that were randomized to surgery/ILMI, but withdrew after learning about their treatment assignment
Diff-in-Diff: difference in difference estimator
Median outpatient costs mirrored those of total costs in year 0 and year 2 and indicate no perceptible outpatient cost savings for the surgery group relative to the ILMI group in year 2 relative to year 0 (Table 2, panel C). Median primary care costs for the surgery and ILMI groups were $634 and $554 respectively, in year 0 and remained fairly stable in the subsequent two years (Table 2, panel D). There is some evidence of cost offset in terms of pharmacy costs for bariatric surgery patients relative to ILMI patients in year 2 vs. year 0 in the order of about $920 (Table 2, panel F). The vast majority of patients in the surgery and ILMI groups did not incur any emergency room costs, as indicated by 0 median costs; however, mean emergency room costs were higher for the surgery patients relative to ILMI patients by more than $1,000 in year 2 vs. year 0, driven by some high cost utilizers (Table 2, panel G).
Healthcare utilization
The median outpatient visits for the surgery and ILMI groups were comparable in year 0 (8 vs. 7) and remained fairly stable in year 2 (Table 3, panel A). In year 1, the median outpatient visits was 14 for the surgery group and 9 visits for the ILMI group: however, the difference was not statistically significant. There were a few high ER utilizers – one patient in the ILMI group had 14 visits to the ER in year 0 and one patient in the surgery group had 11 ER visits in year 2 (Table 3, panel C). The median prescription fills for the surgery and ILMI patients were similar in year 0 (29 vs. 28) and declined to 17 and 18, respectively in year 2 (Table 3, panel D). Patients who withdrew after randomization, however, had substantially more median prescription fills in year 2 relative to that of those in year 0 (43 vs. 31).
Table 3.
Healthcare utilization for randomized patients by year
| A. Number of outpatient visits
| |||||||||||||||
|---|---|---|---|---|---|---|---|---|---|---|---|---|---|---|---|
| Year 0 | Year 1 | Year 2 | Year 2 – Year 0 | Diff-in-Diff | |||||||||||
|
|
|||||||||||||||
| Surgery | ILMI | With- drawn |
P† (Surgery vs. ILMI) |
Surgery | ILMI | With- drawn |
P† (Surgery vs. ILMI) |
Surgery | ILMI | With- drawn |
P† (Surgery vs. ILMI) |
Surgery | ILMI | (Y2surg – Y0surg) – (Y2ILMI – Y0ILMI) |
|
| N | 15 | 17 | 9 | 15 | 17 | 9 | 15 | 17 | 9 | ||||||
| Mean | 11 | 11 | 12 | 0.11 | 17 | 10 | 12 | 0.01 | 13 | 12 | 12 | 0.94 | 2 | 2 | 0 |
| SD | (2) | (4) | (4) | (3) | (2) | (2) | (4) | (3) | (4) | ||||||
| Median | 8 | 7 | 8 | 0.17 | 14 | 9 | 9 | 0.30 | 7 | 7 | 5 | 0.96 | −1 | 0 | −1 |
| Min | 4 | 2 | 2 | 6 | 1 | 2 | 2 | 0 | 2 | ||||||
| Max | 28 | 73 | 38 | 49 | 32 | 22 | 53 | 47 | 31 | ||||||
|
B. Number of inpatient hospitalizations | |||||||||||||||
| Year 0 | Year 1 | Year 2 | Year 2 – Year 0 | Diff-in-Diff | |||||||||||
|
|
|||||||||||||||
| Surgery | ILMI | With-drawn |
P† (Surgery vs. ILMI) |
Surgery | ILMI | With-drawn |
P† (Surgery vs. ILMI) |
Surgery | ILMI | With-drawn |
P† (Surgery vs. ILMI) |
Surgery | ILMI | (Y2surg – Y0surg) – (Y2ILMI – Y0ILMI) | |
|
| |||||||||||||||
| N | 15 | 17 | 9 | 15 | 17 | 9 | 15 | 17 | 9 | ||||||
| Mean | 0 | 0 | 0 | . | 1 | 0 | 0 | 0.00 | 0 | 0 | 0 | 0.29 | 0 | 0 | 0 |
| SD | (0) | (0) | (0) | (0) | (0) | (0) | (0) | (0) | (0) | ||||||
| Median | 0 | 0 | 0 | . | 1 | 0 | 0 | 0.00 | 0 | 0 | 0 | 0.95 | 0 | 0 | 0 |
| Min | 0 | 0 | 0 | 0 | 0 | 0 | 0 | 0 | 0 | ||||||
| Max | 0 | 0 | 1 | 2 | 0 | 0 | 2 | 0 | 3 | ||||||
|
C. Number of emergency room visits | |||||||||||||||
| Year 0 | Year 1 | Year 2 | Year 2 – Year 0 | Diff-in-Diff | |||||||||||
|
|
|||||||||||||||
| Surgery | ILMI | With-drawn |
P† (Surgery vs. ILMI) |
Surgery | ILMI | With-drawn |
P† (Surgery vs. ILMI) |
Surgery | ILMI | With-drawn |
P† (Surgery vs. ILMI) |
Surgery | ILMI | (Y2surg – Y0surg) – (Y2ILMI – Y0ILMI) | |
|
| |||||||||||||||
| N | 15 | 17 | 9 | 15 | 17 | 9 | 15 | 17 | 9 | ||||||
| Mean | 0 | 2 | 1 | 0.80 | 1 | 0 | 1 | 0.29 | 1 | 1 | 1 | 0.38 | 1 | −1 | 2 |
| SD | (0) | (1) | (0) | (0) | (0) | (1) | (1) | (0) | (1) | ||||||
| Median | 0 | 0 | 1 | 0.89 | 0 | 0 | 0 | 0.54 | 0 | 0 | 0 | 0.54 | 0 | 0 | 0 |
| Min | 0 | 0 | 0 | 0 | 0 | 0 | 0 | 0 | 0 | ||||||
| Max | 2 | 14 | 2 | 4 | 2 | 4 | 11 | 3 | 4 | ||||||
|
D. Number of prescription fills | |||||||||||||||
| Year 0 | Year 1 | Year 2 | Year 2 – Year 0 | Diff-in-Diff | |||||||||||
|
|
|||||||||||||||
| Surgery | ILMI | With-drawn |
P† (Surgery vs. ILMI) |
Surgery | ILMI | With-drawn |
P† (Surgery vs. ILMI) |
Surgery | ILMI | With-drawn |
P† (Surgery vs. ILMI) |
Surgery | ILMI | (Y2surg – Y0surg) – (Y2ILMI – Y0ILMI) | |
|
| |||||||||||||||
| N | 15 | 17 | 9 | 15 | 17 | 9 | 15 | 17 | 9 | ||||||
| Mean | 29 | 31 | 36 | 0.95 | 27 | 31 | 33 | 0.78 | 17 | 27 | 37 | 0.15 | −12 | −4 | −8 |
| SD | (4) | (4) | (6) | (4) | (5) | (4) | (2) | (5) | (6) | ||||||
| Median | 29 | 28 | 31 | 1.00 | 26 | 25 | 28 | 1.00 | 17 | 18 | 43 | 0.74 | −12 | −10 | −2 |
| Min | 6 | 13 | 10 | 5 | 6 | 15 | 2 | 11 | 12 | ||||||
| Max | 54 | 80 | 67 | 52 | 103 | 49 | 33 | 87 | 60 | ||||||
Notes:
SD: standard deviation.
p-value for the two-sample Wilcoxon-Mann-Whitney test is reported for the difference in mean for surgery and ILMI groups.
ILMI: intensive lifestyle and medical intervention.
Withdrawn: group of patients that were randomized to surgery/ILMI, but withdrew after learning about their treatment assignment.
Diff-in-Diff: difference in differences estimator
Comparison of total healthcare cost for randomized vs. non-randomized patients
The median total cost for non-randomized patients was higher by more than $600 compared to that of those for randomized patients in year 0 and higher by almost $1,000 in year 2, although the difference was not statistically significant (see Table 4). There were 5 patients among the non-randomized patients who subsequently went on to have a bariatric procedure.
Table 4.
Total healthcare costs ($) for randomized vs. non-randomized patients by year
| Year 0 | Year 1 | Year 2 | |||||||
|---|---|---|---|---|---|---|---|---|---|
|
|
|||||||||
| Randomized | Non- randomized |
P† (Randomized vs. Non-randomized) |
Randomized | Non- randomized |
P† (Randomized vs. Non-randomized) |
Randomized | Non- randomized |
P† (Randomized vs. Non-randomized) |
|
| N | 41 | 704 | 41 | 704 | 41 | 704 | |||
| Mean | 6,196 | 9,683 | 0.39 | 16,063 | 10,630 | 0.02 | 8,741 | 11,037 | 0.40 |
| SD | (1,008) | (597) | (2,595) | (759) | (2,916) | (853) | |||
| Median | 3,875 | 4,498 | 0.34 | 5,892 | 4,761 | 0.52 | 3,575 | 4,495 | 0.20 |
| Min | 1,073 | 259 | 387 | 183 | 847 | 20 | |||
| Max | 35,932 | 160,083 | 52,336 | 324,466 | 118,478 | 311,913 | |||
Notes:
p-value from Wilcoxon rank-sum (Mann-Whitney) test is reported for difference in mean
DISCUSSION
We assessed the impact of bariatric surgery, relative to an intensive lifestyle and medication intervention, on healthcare cost and healthcare utilization for a group of patients with diabetes and obesity. This study focuses on participants in a randomized controlled trial, a novelty of which was that recruitment was based on a population-based SDM process.13 This allows comparisons between groups that are more balanced for important known and unknown covariates. It also allows for the comparison of randomized patients to those who were informed about the treatment options but who declined random assignment of treatment.13, 15, 16
We found no significant cost savings for patients undergoing bariatric surgery compared to those undergoing ILMI through 2 years of follow-up. The cost of the surgery was about $25,000 — similar to $30,000 found in Makary et al. (2010)17; but we found no evidence of a large decrease in costs after surgery that could result in short-term cost savings. There was evidence of pharmacy cost-offset for the surgery patients relative to the ILMI patients by about $900 in year 2 vs. year 0. The pharmacy cost-offset was counteracted by higher inpatient and emergency room costs for the surgery patients in year 1 and year 2 relative to year 0. Interestingly, the median costs for patients in the randomized group, who withdrew after learning about their assignment to surgery/ILMI, increased steadily from year 0 to year 2—displaying a different cost trajectory compared to other randomized patients. The health care costs of patients who did not participate in this RCT were also substantially higher in year 0 and in follow-up. This provides further evidence that patients in RCTs are likely to differ from those who do not participate in RCTs in ways that are not typically captured or accounted for when inference is made from clinical trials to clinical care settings. This cost trajectory suggests that selection bias may have lead to the inclusion of patients in the trial who were less likely to utilize healthcare: therefore, the results from this study may be less generalizable to the overall population. As noted in Arterburn et al. (2013), there were significant differences between those who agreed and those who did not agree to be a part of the trial, in terms of sex, age, body mass index, hypoglycemic medication use, disease severity and attitude towards weight loss. This finding indicates that surgeons and patients should exercise caution when making inference about the results of RCTs – the results may not apply to all patients who are technically eligible to undergo bariatric surgery. Further research is needed to explore the differences in costs and health outcomes comparing patients who are enrolled in RCTs of bariatric surgery compared to those who receive bariatric surgery as part of routine clinical care.
In an earlier study of mild to moderately obese patients with T2DM in a randomized control setting, Ikramuddin et al. (2013)12 found that the mean use of medications for control of glycemia, dyslipidemia and blood pressure for Roux-en-Y gastric bypass surgery patients was fewer by 3 medications (1.7 vs 4.8) relative to intensive medical management patients in a 12-month follow-up period. Although results from our study are not directly comparable with those studies due to differences in the conditions included under the medications category, we find qualitatively similar results with a trend towards lower medication use in the surgery group.
Retrospective cohort studies of bariatric surgery patients with equal number of matched controls in medium to long-term follow-up have found no substantial savings in total costs (expenditures) for surgery patients relative to the control group in the post- vs. pre-surgery period18, 19. For example, using 2002-2008 claims data from seven Blue Cross Blue Shield health insurance plans, Weiner et al. (2013)18 compare total costs, inpatient costs, outpatient costs, professional office costs and pharmacy costs of patients who underwent bariatric surgery (n=29,820) with that of those of matched controls (n=29,820). Over 4 to 6 years of follow-up, they found that the overall costs for the surgery patients were not lower compared to their matched counterpart, although marked reductions in costs for prescriptions and office-based visits were observed in the years following surgery compared with those in the pre-operative period. It is worthwhile noting that although biases emanating from differences in the observed characteristics of the surgery vs. non-surgery patients are attenuated using a matching approach, potential biases from unobservable characteristics may, nonetheless, generate biased results when comparing cost outcomes. More importantly, the differences observed in our study between those who are randomized and those who are not suggest that findings of HCU in non-randomized cohorts may be different from those who enroll in RCTs.
Others have evaluated retrospective cohorts to compare total costs and measures of healthcare utilization for bariatric surgery patients in the pre- vs. post-surgery period without comparisons with a control group17, 20, 21. These studies provide mixed evidence in a short- to long-term follow-up in terms of total cost. Bleich et al. (2012)21 compared total costs, inpatient costs, outpatient costs, number of inpatient days, outpatient visits and specialist visits for patients with type 2 diabetes who had undergone bariatric surgery (n=7,806) using 2002 to 2008 data from seven Blue Cross Blue Shield health plans. Using a multivariate analytical approach with appropriate methods to account for the count (skewed) nature of the data, the authors find that bariatric surgery was not associated with lower total costs for diabetic patients in a 6-year follow-up period. Notably, mean total costs were $9,326 in the pre-surgery period, $13,400 in the year following surgery and remained fairly stable in the subsequent years with total costs six years after surgery equal to $13,664. The time horizon of the assessment may be critical. Our group21a performed a modeled cost effectiveness analysis using a 20+ year time horizon and found that bariatric surgery was cost-effective. Those results were heavily dependent on long- term survival data from the longest matched cohort study, the Swedish Obesity Subject (SOS) study21b. Of note though, the SOS itself has yet to produce a long-term cost evaluation, and to date has only focused on medication and disability costs in favor of surgery (Narbro et al., 199921c; Gripeteg et al., 201221d; Neovius et al., 201221e).
There are a number of limitations in our analysis. First, the total number of patients who met eligibility criteria for the study and were ultimately randomized is relatively quite small, as a result, our findings should be interpreted with caution. Second, the trial recruited patients from a single healthcare system in Washington State with limited socioeconomic and demographic diversity and 100% commercial insurance.13 It remains to be seen whether our results are generalizable to the broader US population. Third, we were limited to two years of follow-up data, and longer-term follow-up could demonstrate greater differences in the cost trajectories of groups. Finally, although patients were recruited in the trial using the population-based shared decision-making process to broaden the generalizability of the study results, the randomized study patients were different from other non-randomized but study-eligible patients in terms of baseline costs, cost-trajectories, sex, hypoglycemic medication use, and also disease severity,13 which has implications for the interpretation of this and other RCTs. Moreover, the randomization of the surgery and ILMI patients was not perfect: the surgery patients had longer T2DM duration relative to the ILMI patients at baseline.8
The fact that we did not observe a significant difference in the 2-year costs between the surgical and non-surgical treated groups in this RCT suggests that it is unlikely that the cost of the bariatric procedure will be recouped over a short time frame. This finding is consistent with other studies of bariatric surgery costs (see Maciejewski et al., 201219 and Weiner et al., 201318), and is in contrast to other studies that are likely to have had a flawed control group selection process (see Cremieux et al., 200823 and Finkelstein et al., 201124) that relied on ICD-9 codes to identify non-surgical control patients with severe obesity.
Patients in this study who withdrew from the RCT and those who declined participating in the RCT cost more than those who pursued aggressive treatment of their diabetes and other comorbidities through participation in the trial interventions. This finding needs confirmation in future studies, but suggests that patients with diabetes who are unwilling to pursue bariatric surgery or intensive lifestyle intervention may be at greater risk of downstream costs due to escalating intensity of care. This also makes cost savings associated with a surgical intervention more difficult to assess.
CONCLUSION
In conclusion, short-term costs were no different in this RCT of bartiatric surgery and lifestyle/medications for patients with diabetes and BMI 30+. Of note, the stakeholder community should take into consideration the possibility of selection bias (due to patients with less steep cost trajectory enrolling in trials), which may be playing a role in cost evaluations of RCTs that show negative findings.
Acknowledgments
This study was funded by the NIH National Institute for Diabetes Digestive and Kidney Diseases Grant #R01-DK089528, as well as grants from the Group Health Research Institute and the Group Health Foundation. The shared decision making aid used in this study was provided by the Informed Medical Decisions Foundation.
Funding: Dr. Arterburn reports grants from National Institutes of Health and decision aids used for the study from Informed Medical Decisions Foundation. Dr. Flum reports grants from NIH/NIDDK, during the conduct of the study.
Disclosure: David Arterburn receives research funding, has received salary support, and received free access to the shared decision making aids used in this study, as a medical editor for the not-for profit (501[3]c) Informed Medical Decisions Foundation (http://www.informedmedicaldecisions.org), which develops content for patient education programs, including the bariatric surgery program that was used by subjects of this study. The Foundation had an arrangement with a for-profit company, Health Dialog, to co-produce and market these programs to health care organizations. The authors’ spouses, partners, or children have no financial relationships that may be relevant to the submitted work.
Footnotes
The authors have no non-financial interests that may be relevant to the submitted work.
References
- 1.Menke A, Casagrande S, Geiss L, Cowie C. Prevalence of and Trends in Diabetes Among Adults in the United States, 1988-2012. Jama. 2015;314:1021–1029. doi: 10.1001/jama.2015.10029. [DOI] [PubMed] [Google Scholar]
- 2.Centers for Disease Control and Prevention. Estimates of Diabetes and Its Burden in the United States. National Diabetes Statistics Report. 2014:1–8. [Google Scholar]
- 3.Ogden C, Carroll M, Kit B, Flegal K. Prevalence of Childhood and Adult Obesity in the United States, 2011-2012. Jama. 2014;311:806–814. doi: 10.1001/jama.2014.732. [DOI] [PMC free article] [PubMed] [Google Scholar]
- 4.Woolthuis K, de Grauw, van Gerwen, van den Hoogen, van de Lisdonk, Metsemakers, et al. Yield of Opportunistic Targeted Screening for Type 2 Diabetes in Primary Care: The Diabscreen Study. Ann Fam Medicine. 2009;7:422–430. doi: 10.1370/afm.997. [DOI] [PMC free article] [PubMed] [Google Scholar]
- 5.Schauer PR, Kashyap SR, Wolski K, Brethauer SA, Kirwan JP, Pothier CE, et al. Bariatric surgery versus intensive medical therapy in obese patients with diabetes. N Engl J Med. 2012;366:1567–76. doi: 10.1056/NEJMoa1200225. [DOI] [PMC free article] [PubMed] [Google Scholar]
- 6.Mingrone G, Panunzi S, Gaetano A, De Guidone C, Iaconelli A, Leccesi L, et al. Bariatric surgery versus conventional medical therapy for type 2 diabetes. N Engl J Med. 2012;366:1577–85. doi: 10.1056/NEJMoa1200111. [DOI] [PubMed] [Google Scholar]
- 7.Dixon JB, O’Brien PE, Playfair J, Chapman L, Schachter LM, Skinner S, et al. Adjustable gastric banding and conventional therapy for type 2 diabetes: a randomized controlled trial. JAMA. 2008;299:316–23. doi: 10.1001/jama.299.3.316. [DOI] [PubMed] [Google Scholar]
- 8.Cummings D, Arterburn D, Westbrook E, Kuzma J, Stewart S, Chan C, et al. Gastric bypass surgery vs intensive lifestyle and medical intervention for type 2 diabetes: the CROSSROADS randomised controlled trial. Diabetologia. 2015;59(5):945–953. doi: 10.1007/s00125-016-3903-x. [DOI] [PMC free article] [PubMed] [Google Scholar]
- 9.Mingrone G, Panunzi S, Gaetano A, De Guidone C, Iaconelli A, Nanni G, et al. Bariatric-metabolic surgery versus conventional medical treatment in obese patients with type 2 diabetes: 5 year follow-up of an open-label, single-centre, randomised controlled trial. Lancet. 2015;386:964–73. doi: 10.1016/S0140-6736(15)00075-6. [DOI] [PubMed] [Google Scholar]
- 10.Narbro K, Agren G, Jonsson E, Näslund I, Sjöström L, Peltonen M, et al. Pharmaceutical Costs in Obese Individuals: Comparison With a Randomly Selected Population Sample and Long-term Changes After Conventional and Surgical Treatment: The SOS Intervention Study. Arch Intern Med. 2002;162:2061–2069. doi: 10.1001/archinte.162.18.2061. [DOI] [PubMed] [Google Scholar]
- 11.Neovius M, Narbro K, Keating C, Peltonen M, Sjoholm K, Agren G, et al. Heatlth Care Use During 20 Years Following Bariatric Surgery. JAMA. 2012;308(11):1132–1141. doi: 10.1001/2012.jama.11792. [DOI] [PubMed] [Google Scholar]
- 12.Ikramuddin S, Korner J, Lee W-J, Connett J, Inabnet W, Billington C, et al. Roux-en-Y Gastric Bypass vs Intensive Medical Management for the Control of Type 2 Diabetes, Hypertension, and Hyperlipidemia: The Diabetes Surgery Study Randomized Clinical Trial. Jama. 2013;309:2240–2249. doi: 10.1001/jama.2013.5835. [DOI] [PMC free article] [PubMed] [Google Scholar]
- 13.Arterburn D, Flum D, Westbrook E, Fuller S, Shea M, Bock S, et al. A population-based, shared decision-making approach to recruit for a randomized trial of bariatric surgery versus lifestyle for type 2 diabetes. Surg Obes Relat Dis. 2013;9:837–844. doi: 10.1016/j.soard.2013.05.006. [DOI] [PMC free article] [PubMed] [Google Scholar]
- 13a.Barry MJ, Edgman-Levitan S. Shared decision making—pinnacle of patient-centered care. N Engl J Med. 2012;366:780–781. doi: 10.1056/NEJMp1109283. [DOI] [PubMed] [Google Scholar]
- 14.StataCorp. Stata Statistical Software: Release 13. College Station TX: StataCorp LP; 2013. [Google Scholar]
- 15.Ha C, Ullman TA, Siegel CA, Kornbluth A. Patients enrolled in randomized controlled trials do not represent the inflammatory bowel disease patient population. Clinical gastroenterology and hepatology. 2012;10:1002–1007. doi: 10.1016/j.cgh.2012.02.004. [DOI] [PubMed] [Google Scholar]
- 16.Treweek S, Zwarenstein M. Making trials matter: pragmatic and explanatory trials and the problem of applicability. Trials. 2009 doi: 10.1186/1745-6215-10-37. [DOI] [PMC free article] [PubMed] [Google Scholar]
- 17.Makary MA, Clarke JM, Shore AD, Magnuson TH, et al. Medication Utilization and Annual Health Care Costs in Patients With Type 2 Diabetes Mellitus Before and After Bariatric Surgery. Arch Surg. 2010;145(8):726–731. doi: 10.1001/archsurg.2010.150. [DOI] [PubMed] [Google Scholar]
- 18.Weiner J, Goodwin S, Chang H-Y, Bolen S, Richards T, Johns R, et al. Impact of Bariatric Surgery on Health Care Costs of Obese Persons: A 6-Year Follow-up of Surgical and Comparison Cohorts Using Health Plan Data. Jama Surg. 2013;148:555–561. doi: 10.1001/jamasurg.2013.1504. [DOI] [PubMed] [Google Scholar]
- 19.Maciejewski M, Livingston E, Smith V, Kahwati L, Henderson W, Arterburn D. Health Expenditures Among High-Risk Patients After Gastric Bypass and Matched Controls. Arch Surg-chicago. 2012;147:633–640. doi: 10.1001/archsurg.2012.818. [DOI] [PubMed] [Google Scholar]
- 20.Keating C, Peeters A, Swinburn B, Carter R, Moodie M. Pharmaceutical utilisation and costs before and after bariatric surgery. Int J Obes 2005. 2013;37:1467–72. doi: 10.1038/ijo.2013.24. [DOI] [PubMed] [Google Scholar]
- 21.Bleich SN, Chang H-YY, Lau B, Steele K, Clark JM, Richards T, et al. Impact of bariatric surgery on health care utilization and costs among patients with diabetes. Med Care. 2012;50:58–65. doi: 10.1097/MLR.0b013e3182290349. [DOI] [PMC free article] [PubMed] [Google Scholar]
- 21a.Flum DR, Kwon S, MacLeod K, Wang B, Alfonso-Cristancho R, Garrison LP, Sullivan SD. The Use, Safety and Cost of Bariatric Surgery Before and After Medicare’s National Coverage Decision. Ann Surg. 2011;254(6):860–865. doi: 10.1097/SLA.0b013e31822f2101. [DOI] [PMC free article] [PubMed] [Google Scholar]
- 21b.Sjostrom L, Narbro K, Sjostrom CD, et al. Effects of bariatric surgery on mortality in Swedish obese subjects. N Engl J Med. 2007;357:741–752. doi: 10.1056/NEJMoa066254. [DOI] [PubMed] [Google Scholar]
- 21c.Narbro K, Agren G, Jonsson E, et al. Sick leave and disability pension before and after treatment for obesity: a report from the Swedish Obese Subjects (SOS) study. Int J Obes Relat Metab Disord. 1999;23:619–24. doi: 10.1038/sj.ijo.0800890. [DOI] [PubMed] [Google Scholar]
- 21d.Gripeteg L, Lindroos AK, Peltonen M, Sjostrom L, Narbro K. Effects of bariatric surgery on disability pension in Swedish obese subjects. Int J Obes. 2012;36:356–62. doi: 10.1038/ijo.2011.15. [DOI] [PubMed] [Google Scholar]
- 21e.Neovius M, Narbro K, Keating C, et al. Health care use during 20 years following bariatric surgery. JAMA. 2012;308:1132–41. doi: 10.1001/2012.jama.11792. [DOI] [PubMed] [Google Scholar]
- 22.Button K, Ioannidis J, Mokrysz C, Nosek B, Flint J, Robinson E, et al. Power failure: why small sample size undermines the reliability of neuroscience. Nat Rev Neurosci. 2013;14:365–376. doi: 10.1038/nrn3475. [DOI] [PubMed] [Google Scholar]
- 23.Cremieux PY, Buchwald H, Shikora SA, Ghosh A, Yang HE, Buessing M. A study on the economic impact of bariatric surgery. Am J Manag Care. 2008;14(9):589–596. [PubMed] [Google Scholar]
- 24.Finkelstein EA, Allaire BT, Burgess SM, Hale BC. Financial implications of coverage for laparoscopic adjustable gastric banding. Surg Obes Relat Dis. 2011;7(3):295–303. doi: 10.1016/j.soard.2010.10.011. [DOI] [PubMed] [Google Scholar]