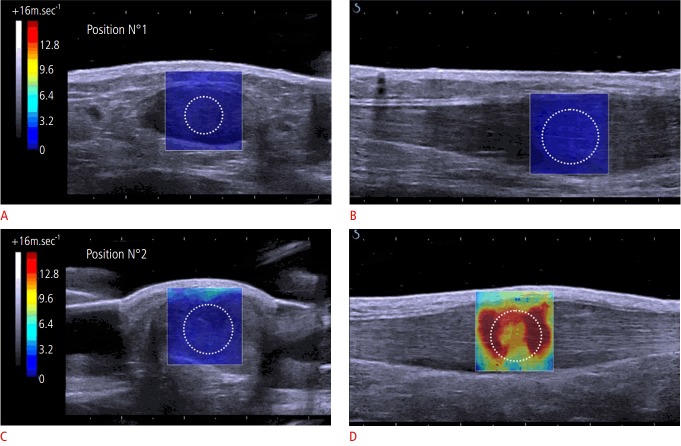
Fig. 6. Achilles tendonopathy shear modulus maps.
For position 1 (maximal plantar flexion), mean velocity was measured at 3.31 m/sec (A) and at 5.86 m/sec (B) on axial and sagittal images, respectively. For position 2 (neutral position), mean velocity was measured at 4.14 m/sec (C) and at 15.43 m/sec (D), on axial and sagittal images, respectively. N°, number. Reprinted from Aubry et al. Radiology 2015;274:821-829 [48], with permission of Radiological Society of North America.

