

Abstract
Background
Radiation-therapy (RT) induces mucositis, a clinically challenging condition with limited prophylactic interventions and no predictive tests. In this pilot study, we applied global gene-expression analysis on serial human oral mucosa tissue and blood cells from patients with tonsil squamous cell cancer (TSCC) to identify genes involved in mucositis pathogenesis.
Methods and findings
Eight patients with TSCC each provided consecutive buccal biopsies and blood cells before, after 7 days of RT treatment, and 20 days following RT. We monitored clinical mucositis and performed gene-expression analysis on tissue samples. We obtained control tissue from nine healthy individuals. After RT, expression was upregulated in apoptosis inducer and inhibitor genes, EDA2R and MDM2, and in POLH, a DNA-repair polymerase. Expression was downregulated in six members of the histone cluster family, e.g., HIST1H3B. Gene expression related to proliferation and differentiation was altered, including MKI67 (downregulated), which encodes the Ki-67-proliferation marker, and KRT16 (upregulated), which encodes keratin16. These alterations were not associated with the clinical mucositis grade. However, the expression of LY6G6C, which encodes a surface immunoregulatory protein, was upregulated before treatment in three cases of clinical none/mild mucositis, but not in four cases of ulcerative mucositis.
Conclusion
RT caused molecular changes related to apoptosis, DNA-damage, DNA-repair, and proliferation without a correlation to the severity of clinical mucositis. LY6G6C may be a potential protective biomarker for ulcerative mucositis. Based on these results, our study model of consecutive human biopsies will be useful in designing a prospective clinical validation trial to characterize molecular mucositis and identify predictive biomarkers.
Introduction
Treatment-related toxicity remains a major concern in patients with head and neck cancers [1,2], including squamous cell cancer of the tonsil (TSCC). The incidence of TSCC is increasing, due to a shift towards younger patients with human papilloma virus (HPV)-positive cancers [3,4]. Consequently, more survivors must live with both short- and long-term cancer treatment side effects, including mucositis, hypo-salivation, tissue fibrosis, and hypo-vascular bone [5–8].
For curative intentions, radiation therapy (RT) is a key modality, with or without surgery, combined with concomitant chemotherapy. Squamous cell carcinomas require a relatively large amount of radiation (60 to 70 Gray [Gy]) [9]. Recently, outcomes have improved with the advent of radio-sensitizers and intensity-modulated RT. However, mucositis remains an acute, painful side effect [10]. Mucositis appears clinically at a total dose of approximately 35 Gy (after about 2 weeks), and it gradually worsens with each dose delivered [11]. The incidence of mucositis is 85% in patients with head and neck cancers that require RT; of these, 37% require hospitalization, and of these 51% require a feeding tube [5,6]. The lack of predictability of who are severely affected is a significant clinical challenge [12]. Palliative interventions may relieve the side effects, but no preventive medications are available that can reduce mucositis, and no markers are available for pretreatment identification of patients likely to be severely affected [13]. Previous studies have shown that RT causes DNA damage and oxidative stress, which subsequently lead to activation of p53-induced radiotoxic pathways, apoptosis, and cell-cycle arrest [14–16]. Furthermore, DNA repair and damage response via MDM2 suppression of p53, was also reported a consequence of RT in addition to radiation fibrosis, and endothelial damage [17–18]. However, no studies have described a gene expression analysis of human mucosa [19].
Here, we describe a disease- and treatment-specific global gene expression (GGE) pilot study. We examined consecutive mucosa biopsies and peripheral blood cells collected from patients with TSCC during RT treatment. This study aimed to generate phenotypic data to document the feasibility of a novel in vivo model of consecutive human biopsies during RT treatment that might provide new biological knowledge of the molecular pathogenesis of severe mucositis and facilitate the identification of potential predictive biomarkers.
Materials and methods
Patients
The Committee on Health Research Ethics of the Northern Denmark Region (N-20100022) approved the clinical protocol for this study. Informed written consent was obtained from all patients, in accordance with the Declaration of Helsinki. Patients were enrolled from September 1, 2010, to April 30, 2013. Inclusion criteria were age ≥18 years, cancer-treatment naïve, and without uncontrolled competitive disease.
We recruited 19 patients at the Department of Maxillofacial Surgery, Aalborg University Hospital. Among those patients, nine displayed histologically confirmed TSCC and a metastasis-negative FDG-PET/CT scan. Of these nine patients, seven provided three consecutive buccal biopsies and peripheral blood samples. The first biopsy and blood sample set (baseline) was acquired before the start of RT, the second set was acquired after one week of RT, and the third set was acquired at an average of 20 days after the last RT, for outline of the study plan (Fig 1). Two of the nine included patients died during treatment; one after the second biopsy and one before the first biopsy. The patient that died after the second biopsy was included in the analysis; thus, we analyzed eight patient samples. Our control group comprised 10 healthy, non-smoking individuals that had participated in a previous study [20]. Of these, one was excluded, due to an autoimmune disease that was not reported at the time of biopsy; thus, nine control samples were analyzed. All patients underwent pretreatment evaluations, including a medical history, smoking habits (smokers were defined as smoking more than 10 cigarettes per day), alcohol consumption (consumers were defined as drinking more than 21 units of alcohol weekly), and a clinical examination. Baseline characteristics were noted, including age, gender, and Eastern Cooperative Oncology Group (ECOG) performance status. Before RT, patients were screened for dental infections, and when indicated, infections were eradicated.
Fig 1. The pilot study design.
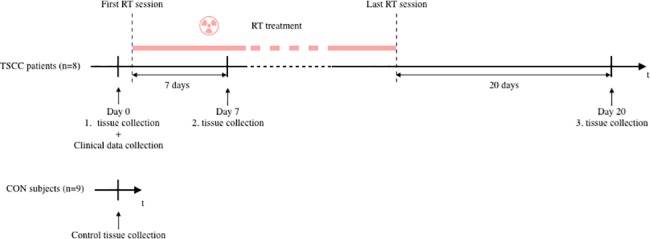
Tissue samples were collected from patients with tonsil squamous cell cancer (TSCC) at three time points: at baseline, before RT (Day0), after 7 days of RT (Day7), and 20 days after the last RT. In addition, tissue samples were collected from healthy subjects (CON). All tissue collections consisted of one blood sample and one biopsy of oral buccal mucosa. Tissue samples were successively stored in our biobank. Once all the material was collected, gene expression analysis was performed collectively at the same laboratory.
TSCC tumors were staged according to the TNM system for staging cancer (T = size of primary tumor; N = presence and level of lymph node involvement; M = presence of distant metastasis) [21]. Immunohistochemistry was performed to detect p16 overexpression in the tumor, which indicated HPV-induced TSCC. All patients with TSCC received intention-to-cure treatments. Accelerated external RT was applied in 6 weekly fractions of 2 Gy. RT was supplemented, when indicated, with concomitant cisplatin (40 mg/m2) once weekly during RT, according to international guidelines [22,23]. We noted the total radiation dose (Gy) applied to the tumor, based on the radiation schemes. We also calculated the estimated dose applied to the buccal mucosa at the site of the biopsy.
Mucositis assessment
Oral mucositis (OM) was evaluated weekly in all patients, by the same researcher (MM), according to the World Health Organization oral toxicity assessment worksheet [24]. Subjective symptoms (pain and ability to eat solid food) and objective oral mucositis-related findings (erythema, ulceration) were noted. Grades 0 and 1 comprised none/mild mucositis (NM); this included soreness, with or without erythema, but solid food could be taken. Grades 2 to 4 comprised ulcerative mucositis (UM); in UM, food intake gradually declined, due to pain, and parenteral feeding might become necessary. The highest score measured during treatment was noted as the patients general mucositis experience.
Collection of mucosa tissue and blood cells
Sample collection was performed with the methods described previously [20]. Briefly, a lens-formed, 5-mm biopsy was harvested with a scalpel from the buccal mucosa approximately 1 cm inferior to the parotid papilla in a standardized manner, and the wound was tightly sutured. One half of the biopsy was immediately embedded in RNAlater™, for GGE analysis. The other half was fixed in formalin and embedded in paraffin for immunohistochemistry.
Within 2 h of the biopsy procedure, 15 ml of EDTA-mixed venous full blood was collected. Then, mononuclear cells were isolated and stored at -196°C in liquid nitrogen, until analysis.
Gene expression analysis
Gene expression was evaluated with the methods described previously in detail [20]. Briefly, for both mononuclear cells and mucosa, we used the Affymetrix GeneChip Human Exon 1.0 ST Arrays with the Affymetrix GeneChip WT Terminal Labeling and Controls Kit (P/N 901524). CEL files were generated with Affymetrix GeneChip Command Console Software and deposited in the NCBI Gene Expression Omnibus repository, under number GSE103412.
Immunohistochemistry
Tissue blocks were cut in 4-μm sections, and the sections were mounted on glass slides. With an in-house optimized protocol, tissues were stained for scinderin with a rabbit polyclonal antibody (KIAA1905, Nordic Biosite, www.nordicbiosite.com). Stained slides were scanned on a Hamamatsu NanoZoomer slide scanner and analyzed with NDP viewer software. To estimate the scinderin stain intensity, each stained slide was viewed at a magnification of ×15, and evaluated within a framed rectangle of 0.75 × 0.4 mm (0.3 mm2). Samples were classified as no stain (0), lightly stained (+), or heavily stained (++).
Statistical analysis
All statistical analyses were performed with R [25] version 3.2.2 and Bioconductor packages [26].
Estimation of sample size
We applied the method described by Lee and Whitmore to identify genes that varied more than two-fold between test points, with a false discovery rate (FDR) less than 0.05% and a power of 90% [27]. This analysis was implemented in the R-package, size-power (Qui 2008). The results indicated that 10 patients in each group would provide sufficient statistical power.
Data preprocessing
The CEL files produced by the Affymetrix Expression Console were preprocessed and summarized at the gene level with the RMA algorithm in the Bioconductor package, affy, based on custom CDF-files [28]. This preprocessing step revealed the expression levels of 38,830 genes for each exon array. Genes were annotated with Ensembl gene identifiers.
Detection of differential expression
With the patient ID as a cluster variable, we used the limma package, a linear mixed model analysis provided in R, and the empirical Bayes approach to test for significant differences in gene expression between the second biopsy/blood sample and baseline, and between the third biopsy/blood sample and baseline [29]. To test for significantly differentially expressed genes between baseline and control samples, an unpaired t-test was performed with limma [29]. Patients were divided into two groups based on mucositis status (UM or NM), and significantly differentially expressed genes were detected with limma at each time point.
The FDR-adjusted P-values (≤0.05) were controlled with the Benjamini–Hochberg method [30] for each of the above tests.
Hierarchical clustering
The GGE data set of all nine control samples and the eight TSCC samples were divided into eight subsets. These subsets were gene biotypes (defined as protein coding), pseudogenes, miRNA, rRNA, snoRNA, snRNA, linRNA, and antisense transcript. Each dataset was subjected to hierarchical clustering, where the Pearson correlation was used as a distance measure, and average linkage was used as the algorithm method [31].
Results
Clinical characteristics of TSCC
The pilot study design is shown in Fig 1. Three steps of intervention were planned during TSCC-specific standard therapy, which included RT and cisplatin treatments. We collected 32 biopsies and performed 32 blood draws (7 × 3 sample sets + 1 × 2 sample sets for TSCC and 9 × 1 sample set for controls).
Patient clinical characteristics and demographics are shown in Table 1. Age was comparable between the control (age 58 years, range 47–78) and TSCC (age 63.5 years, range 51–69) groups. A trend towards male dominance was observed in the TSCC group (2 females among 8 patients), but not in the control group (4 females among 9 patients). Five of eight patients with TSCC were smokers, and four of the eight consumed alcohol. Tumor staging was evaluated according to the TMN system [21], and p16 overexpression was detected in six of eight tumors.
Table 1. Patient characteristics and demographics upon enrollment in the study.
| Patient | Age | Gender | ECOGa | Smokingb | Alcoholc | Stagingd | p16e |
|---|---|---|---|---|---|---|---|
| TSCC01 | 57 | m | 0 | 0 | 0 | T1N2bM0 | yes |
| TSCC03 | 67 | f | 2 | 1 | 1 | T1N0M0 | no |
| TSCC04 | 74 | m | 2 | 0 | 1 | T1NxM0 | no |
| TSCC05 | 72 | m | 0 | 0 | 0 | T1N2aM0 | yes |
| TSCC06 | 65 | m | 0 | 1 | 1 | T1N1M0 | yes |
| TSCC07 | 59 | m | 1 | 1 | 1 | T2N1M0 | yes |
| TSCC08 | 68 | m | 0 | 1 | 0 | T4aN2cM0 | yes |
| TSCC09 | 56 | f | 0 | 1 | 0 | T2N2cM0 | yes |
aEastern Cooperative Oncology Group (ECOG) performance status at baseline
bSmoking categories: 0 = Non-smoker, 1 = smoked more than 10 cigarettes per day
cAlcohol categories: 0 = No alcohol consumption, 1 = consumed more than 3 units of alcohol per day
dTNM system for staging of cancer: T = size of primary tumor; N = presence and level of lymph node involvement; M = presence of distant metastasis (1)
eOverexpression of p16 indicates positive for HPV
The clinical data collected during RT are shown in Table 2. After treatment initiation, the second biopsy was acquired at a median of 7 days (range 3–12), and the third biopsy was acquired at an average of 57 days (range 40–92). Two patients, TSCC06 and TSCC08, did not receive cisplatin. An average dose of 68.3 Gy (range 66–76) was applied to the tumors. According to the radiation schemes, a total dose of approximately 30–35 Gy was applied to the buccal mucosa bilaterally. At the time of the second biopsy, an average dose of 7.7 Gy (range 4.2–14.4) was applied. UM was detected in five patients and NM was detected in three patients. The median mucositis scores were 1.9 (range 0–3): 2.6 for the UM group and 0.7 for the NM group. We observed no signs of infection at the site of biopsy. All samples yielded valid gene expression profiles.
Table 2. Patient clinical data during radiation treatment and at follow-up.
| Patient | Total dose of radiation to tumor | Estimated dose of RT at biopsy site day7 | Cisplatin (40 mg/m2) once weekly during RT |
WHOa | Days from treatment start to second biopsy | Days from second to third biopsy |
|---|---|---|---|---|---|---|
| TSCC01 | 66 Gy/33 fr | 4.2 | yes | 3 | 3 | 53 |
| TSCC03 | 66 Gy/33 fr | 9.5 | yes | 0 | 8 | 42 |
| TSCC04 | 68 Gy/34 fr | 9.3 | yes | 1 | 8 | dead |
| TSCC05 | 68 Gy/33 fr | 14.4 | yes | 2 | 12 | 41 |
| TSCC06 | 66 Gy/33 fr | 5.3 | no | 1 | 4 | 40 |
| TSCC07 | 68 Gy/34 fr | 5.1 | yes | 3 | 4 | 52 |
| TSCC08 | 76 Gy/56 fr | 6.9 | no | 2 | 9 | 80 |
| TSCC09 | 68 Gy/34 fr | 7.2 | yes | 3 | 6 | 92 |
Abbreviations: Gy: Gray; fr: fractionated; WHO: World Health Organization
amucositis stage, according to the WHO assessment scale, was measured weekly, during treatment and after, until mucositis dissolved [24].
Gene expression in mucosa and blood
The differentially expressed genes in mucosa (Table 3) and blood (Table 4) are annotated with a gene symbol, the fold change (FC), the adjusted p-value, the gene ontology terms (GO-terms), and the gene function.
Table 3. Genes altered in mucosal tissue from patients with tonsil squamous cell carcinoma receiving radiation therapy.
| Gene symbol | FC | p-value | adj. p-value | Qualified Gene Onotology term | Function |
|---|---|---|---|---|---|
| Baseline | |||||
| LIFR | -2.73 | 2.09e-05 | 0.019 | Leukemia Inhibitory Factor Receptor Alpha | Cellular differentiation, proliferation, survival |
| FKBP5 | -2.48 | 0.00015 | 0.037 | FK506 Binding Protein 5 | Immune regulation, basic cellular processes |
| SPARCL1 | -2.24 | 0.0002 | 0.041 | SPARC Like 1 | Cell adhesion, migration, and proliferation |
| MS4A4E | -2.30 | 9.06e-06 | 0.018 | Membrane Spanning 4-Domains A4E | Cell surface signaling |
| PDGFRA | -2.11 | 1.74e-06 | 0.010 | Platelet Derived Growth Factor Receptor Alpha | Cell surface tyrosine kinase receptor |
| RN7SL783P | 2.54 | 0.00010 | 0.031 | pseudogene | Unknown function |
| MTND5P8 | 2.17 | 0.0002 | 0.04 | pseudogene | Unknown function |
| ABO | 2.02 | 8.82e-07 | 0.001 | Alpha 1-3-N-Acetylgalactosaminyltransferase | Enzyme, modifying surface glycoproteins |
| After seven days of radiotherapy | |||||
| HIST1H3B | -2.91 | 7.52e-08 | 0.000143 | Histone Cluster 1, H3b | Transcription |
| HIST1H2BM | -2.75 | 1.6e-07 | 0.000251 | Histone Cluster 1, H2bm | Transcription |
| CYSLTR1 | -2.54 | 3.91e-05 | 0.0098 | Cysteinyl Leukotriene Receptor 1 | Cell structure |
| HIST1H3C | -2.39 | 9.08e-06 | 0.0039 | Histone Cluster 1, H3c | Transcription |
| HIST1H3H | -2.17 | 4.53e-08 | 0.000105 | Histone Cluster 1, H3h | Transcription |
| MOXD1 | -2.16 | 6.19e-08 | 0.000128 | Monooxygenase DBH Like 1 | Metabolism |
| HIST1H1A | -2.12 | 0.00016 | 0.022 | Histone Cluster 1, H1a | Transcription |
| HIST1H1B | -2.09 | 1.05e-08 | 3.14e-05 | Histone Cluster 1, H1b | Transcription |
| MKI67 | -2.00 | 2.58e-06 | 0.0016 | Marker Of Proliferation Ki-67 | Transcription |
| WDR63 | 2.67 | 1.09e-10 | 1.1e-06 | WD Repeat Domain 63 | Unknown |
| MDM2 | 2.29 | 6.77e-11 | 4.26e-11 | MDM2 oncogene, E3 ubiquitin protein ligase | Apoptosis |
| EDA2R | 2.26 | 8.38e-11 | 1.0e-06 | Ectodysplasin A2 receptor | Apoptosis |
| POLH | 2.17 | 3.22e-10 | 1.81e-06 | Polymerase; DNA directed | Transcription |
| KRT16 | 2.15 | 0.00058 | 0.052 | Keratin 16 | Cell structure |
| Three weeks after RT cessation | |||||
| ANKRD20A5P | -3.56 | 2.90e-07 | 0.0026 | Ankyrin Repeat Domain 20 Family Member A5 | Pseudogene |
| CYSLTR1 | -3.11 | 3.92e-06 | 0.0082 | Cysteinyl Leukotriene Receptor 1 | Cell structure |
| SCIN | -2.50 | 9.09e-05 | 0.044 | Scinderin | Cell structure |
| ANKRD20A11P | -2.47 | 4.93e-05 | 0.033 | Ankyrin Repeat Domain 20 Family Member A11 | Pseudogene |
| ANKRD20A9P | -2.32 | 1.2e-06 | 0.0052 | Ankyrin Repeat Domain 20 Family Member A9 | Pseudogene |
| CYP4F34P | -2.28 | 4.1e-05 | 0.032 | Cytochrome P450 Family 4 Subfamily F Member 34 | Pseudogene |
| TC2N | -2.13 | 6.47e-05 | 0.036 | Tandem C2 Domains, Nuclear | Metabolism |
| IL1R2 | -2.12 | 3.37e-07 | 0.0026 | Interleukin 1 Receptor Type 2; cytokine receptor of the interleukin 1 receptor family | Immune response |
| MIR31HG | 5.30 | 5.71e-05 | 0.035 | Non-coding microRNA no 3 | Non-coding mi-RNA |
| CCAT1 | 3.08 | 1.08e-05 | 0.018 | Colon Cancer Associated Transcript 1 | Non-coding RNA |
| PTPRZ1 | 2.93 | 0.000103 | 0.047 | Protein Tyrosine Phosphatase, Receptor Type Z1 | Transcription |
| NM versus UM | |||||
| LY6G6C | -3.78 | 2.53e-06 | 0.0995 | Lymphocyte Antigen-6 G6C | Signal transduction Immune response |
Table 4. Genes altered in mononuclear cells of the blood from patients with tonsil squamous cell carcinoma receiving radiation therapy.
| Gene symbol | FC | p-value | adj. p-value | Qualified Gene Onotology term | Function |
|---|---|---|---|---|---|
| Baseline | |||||
| RNU6-620P | -11.8 | 1.48e-12 | 5.80e-08 | RNA, U6 small nuclear 620, pseudogene | pseudogene |
| RNU6-422P | -3.77 | 3.03e-08 | 0.00022 | RNA, U6 small nuclear 422, pseudogene | pseudogene |
| RNU6-737P | -3.36 | 1.34e-07 | 0.00034 | RNA, U6 small nuclear 737, pseudogene | pseudogene |
| RNU6-795P | -2.85 | 2.82e-06 | 0.0024 | RNA, U6 small nuclear 795, pseudogene | pseudogene |
| RPS7P2 | -2.63 | 2.14e-07 | 0.00044 | Ribosomal protein S7 pseudogene 2 | pseudogene |
| AGAP9 | -2.61 | 6.15e-06 | 0.0039 | ArfGAP With GTPase Domain, Ankyrin Repeat And PH Domain 9 | GTPase-activating |
| RNU6-336P | -2.45 | 5.72e-08 | 0.00025 | RNA, U6 small nuclear 336, pseudogene | pseudogene |
| OAZ1 | -2.26 | 6.81e-06 | 0.0040 | Ornithine decarboxylase antienzyme 1 | Cell growth and proliferation |
| RPL23AP64 | -2.19 | 0.00012 | 0.018 | Ribosomal protein L23a pseudogene 64 | pseudogene |
| RNU6-1162P | -2.06 | 2.02e-05 | 0.0068 | RNA, U6 small nuclear 1162, pseudogene | pseudogene |
| CCDC144B | -2.02 | 0.00074 | 0.043 | Coiled-Coil Domain Containing 144B | pseudogene |
| RN7SL432P | -2.02 | 5.37e-07 | 0.00088 | RNA, 7SL, cytoplasmic 432, pseudogene | pseudogene |
| RNU6-622P | 7.30 | 7.74e-09 | 8.62e-05 | RNA, U6 Small Nuclear 622, Pseudogene | pseudogene |
| DUTP6 | 3.45 | 1.74e-06 | 0.0019 | Deoxyuridine Triphosphatase Pseudogene 6 | pseudogene |
| SSU72P8 | 3.44 | 1.07e-07 | 0.0014 | RNA Polymerase II CTD Phosphatase Homolog, Pseudogene 8 | pseudogene |
| RNU6-919P | 3.37 | 1.06e-05 | 0.0051 | RNA, U6 Small Nuclear 919, Pseudogene | pseudogene |
| RPS6P15 | 3.01 | 2.82e-06 | 0.0024 | Ribosomal Protein S6 Pseudogene 15 | pseudogene |
| RN7SL748P | 2.44 | 1.59e-05 | 0.0061 | RNA, 7SL, Cytoplasmic 748, Pseudogene | pseudogene |
| RPL10P4 | 2.33 | 2.88e-07 | 0.00051 | Ribosomal Protein L10 Pseudogene 4 | pseudogene |
| RPL21P133 | 2.32 | 6.39e-07 | 0.0010 | Ribosomal Protein L21 Pseudogene 133 | pseudogene |
| RN7SL290P | 2.22 | 1.06e-05 | 0.0051 | RNA, 7SL, Cytoplasmic 290, Pseudogene | pseudogene |
| OR5M4P | 2.21 | 4.97e-05 | 0.011 | Olfactory Receptor Family 5 Subfamily M Member 4 Pseudogene | pseudogene |
| RNU6-151P | 2.19 | 1.58e-07 | 0.00036 | RNA, U6 Small Nuclear 151, Pseudogene | pseudogene |
| RNU6-135P | 2.19 | 1.29e-07 | 0.00034 | RNA, U6 Small Nuclear 135, Pseudogene | pseudogene |
| RNA5SP116 | 2.18 | 0.00085 | 0.046 | RNA, 5S Ribosomal Pseudogene 116 | pseudogene |
| NUTM2D | 2.13 | 0.00016 | 0.021 | NUT family member 2D | unknown |
| RNA5SP54 | 2.06 | 8.49e-08 | 0.00030 | RNA, 5S Ribosomal Pseudogene 54 | pseudogene |
| RN7SL865P | 2.05 | 0.00074 | 0.043 | RNA, 7SL, Cytoplasmic 865, Pseudogene | pseudogene |
| RPS29P8 | 2.00 | 8.69e-07 | 0.0012 | Ribosomal Protein S29 Pseudogene 8 | pseudogene |
Before RT was applied, eight genes were altered in patients with TSCC compared to controls (Table 3). Five of these genes remained unaffected with subsequent therapy: LIFR, FKBP5, SPARCL1, MS4A4E, and PDGFRA.
In response to treatment, we found nine downregulated genes. Eight of these genes were in the histone cluster family, including HIST1H3B, HIST1H2BM, HIST1H3C, HIST1H3H, HIST1H1A, and HIST1H1B; and one, MKI67, was a marker of Ki-67 proliferation. Five genes were upregulated. Of these, two were related to apoptosis, MDM2 and EDA2R, and one, POLH, encoded a transcriptional DNA-directed polymerase (Table 3).
On day 21 after the last RT application, we found 11 altered genes compared to baseline (Table 3). Most were pseudogenes, including ANKRD20A5P, ANKRD20A11P, ANKRD20A9P, and CYP4F34P (downregulated); and noncoding RNAs, CCAT1 and MIR31HG. The MIR31HG RNA was upregulated only among patients with TSCC that received cisplatin. IL1R2 (downregulated) encoded a cytokine receptor of the interleukin 1 receptor family. SCIN (downregulated) encoded a regulatory protein involved in exocytosis. Immunohistochemical analysis results (Fig 2) showed reduced expression in epithelial cells, but not in the salivary glands.
Fig 2. Immunohistochemical analysis of mucosal tissue expression of scinderin.

Oral buccal mucosa section (×15 magnification) stained with an SCIN antibody. (a) High scinderin expression is evident in mucosa from a control individual (patient CON05). (b) Low scinderin expression is evident in mucosa from a patient with tonsil squamous cell cancer (patient TSCC07); the biopsy was acquired Day20. SCIN encodes a regulatory protein involved in exocytosis and we expected to se downregulation in salivary gland tissue, however epithelial cells were heavily stained in the healthy control group.
When gene expression profiles of the buccal mucosa were compared between UM and NM samples, we found no differentially expressed genes (adjusted P < 0.05) in either blood or mucosa. However, one gene, LY6G6C, tended to be expressed at low levels (FC -3.78; adj. P = 0.0995) in UM baseline biopsies (Fig 3, Table 3).
Fig 3. Expression of LY6G6C in mucosa.
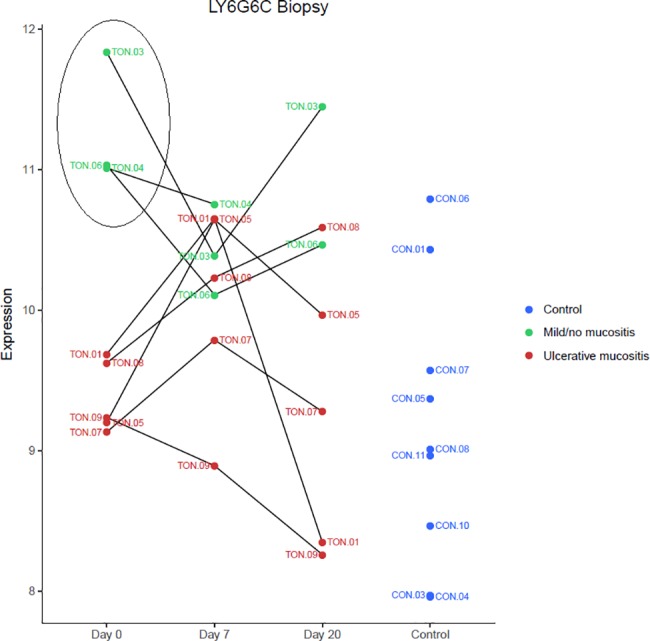
Dot plot shows expression of LY6G6C, at baseline (Day 0), after 7 days of RT (Day 7), and 20 days after the last RT session (Day 20), among patients that developed ulcerative mucositis (red) or mild/no mucositis (green), and in controls (blue). Patients with mild/ no mucositis exhibited an upregulation of LY6G6C. LY6G6C encodes a surface immunoregulatory protein expressed on mucosal dendritic cells.
We found 12 downregulated and 17 upregulated genes in blood samples from the TSCC group compared to the control group (Table 4). These genes were dominated by small nuclear RNAs (snRNAs), e.g., RNU6-620P and RNU6-622P, and a dot plot of these two selected genes is shown in Fig 4.
Fig 4. Expression of RNU6-620P and RNU6-622P in blood cells.

Dot plot shows expression of RNU6-620P (FC-x11.8; P = 5.80e-80) and RNU6-622P (FCx7.3 P = 8.62e-05) at baseline (Day 0), after 7 days of RT (Day 7), and 20 days after the last RT session (Day 20), among patients that developed ulcerative mucositis (red) or mild/no mucositis (green). Expression in normal controls is indicated with blue circles. These genes encode small nuclear RNAs, which are non-protein coding genes. Patients with TSCC expressed a significant different level of both genes compared to healthy controls.
We clustered the expression levels of snRNAs, regardless of fold-changes according to P-value, and observed a distinct division between patients with TSCC and healthy controls (Fig 5). We found no differentially expressed genes in blood samples between baseline and day 7 or day 20.
Fig 5. Small nuclear RNA (snRNA) clustered according to P value.
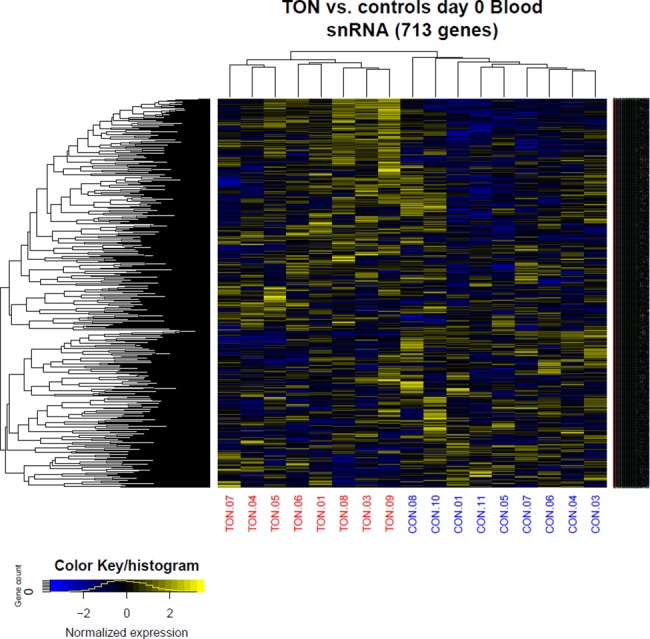
The expression of snRNA regardless of fold change was clustered according to P value, showing a distinct division between patients with TSCC and healthy controls.
Discussion
This study aimed to validate our clinical pilot study set-up and demonstrate its potential for identifying pathogenic variables or biomarkers for molecular mucositis. In response to RT, we identified several altered genes in the mucosa, but no differentially expressed genes in the blood cells. Furthermore, the identified genes were not correlated to the grade of clinical mucositis. Furthermore, we found that although all patients with TSCC were diagnosed with a localized solid epithelial tumor, and the biopsies from the study group was harvested from clinically healthy buccal mucosa, the mucosal tissue and blood cells had different gene profiles compared to healthy controls before RT.
RT effects on mucosal gene expression
Several studies have described the molecular effects of radiation on normal tissue, but no studies have described effects on gene expression levels [19]. Generally, short-term alterations include increased levels of p53 and other apoptotic markers (e.g., Bcl-2 and Mcl-1) [14,32], increased numbers of inflammatory cells (CD68-positive macrophages and other leukocyte subtypes), and alterations in inflammatory markers (e.g., NF-kB and COX-2) [32–35]. The epithelium begins to regenerate after one week of radiation, confirmed by the identification of cell proliferation markers, Ki-67 and [3H]-TdR, and by the increased expression of keratins (keratins 1, 6, 10, 16) [36,37]. Over the long term, RT caused different distribution patterns of adhesion molecules and macrophage subpopulations, compared to pretreatment specimens [38].
The present pilot study identified markers of apoptotic activity. EDA2R was upregulated in the mucosa 7 days after RT initiation, compared to its pretreatment status. EDA2R encodes the ectodysplasin A2 receptor, a transmembrane protein in the tumor necrosis factor receptor superfamily. Upon stimulation, this receptor activates the NF-ĸB and JNK apoptotic pathways [39]. In addition, six members of the histone cluster family were downregulated, which indicated DNA damage. Histones are basic nuclear proteins responsible for nucleosome structure. Previous studies in cell lines have described histone downregulation in response to RT [40].
In parallel, the MDM2 oncogene (MDM2) was upregulated. MDM2 encodes an E3 ubiquitin ligase, localized in the nucleus, and is regulated transcriptionally by p53. In turn, E3 ubiquitin ligase mediates the ubiquitination of p53, and thereby, inhibits p53-mediated cell-cycle arrest and apoptosis [41]. In addition, the upregulation of POLH, a polymerase that replicates UV-damaged DNA, indicated a DNA defense mechanism. Thus, we identified both inducers and inhibitors of apoptosis and DNA damage, consistent with findings reported in previous preclinical studies.
Proliferation-related genes were also altered. MKI67, which encodes Ki-67, a nuclear protein that is essential for cellular proliferation, was downregulated after 7 days of RT. This finding contrasted with findings from a previous study on human mucosa [32]. However, KRT16 was upregulated. KRT16 encodes keratin16, a protein characteristic of early differentiated epithelial cells. This short-term change indicated continuous epithelial proliferation [42]. This finding was also reported in a previous study [37].
SCIN encodes a calcium ion- and actin filament-binding protein with a regulatory function in exocytosis [43]. We expected SCIN to be associated with salivary gland function because of the connection to exocytosis function and prior studies have reported histological changes in radiated salivary glands, including atrophy, edema, cell death, and fibrous tissue formation [44]. However an immune histochemical stain for SCIN revealed that the presence was seen in the epithelial cells (Fig 2).
A potential biomarker for the grade of clinical mucositis
When we compared samples from three patients with NM to samples from 4 patients with UM, we found that LY6G6C (lymphocyte antigen 6 complex, locus G6C) was upregulated (x3.78; P = 0.0995) in NM before treatment, although this finding was not statistically significant (Fig 3). LY6G6C belongs to a cluster of leukocyte antigen-6 genes linked to the major histocompatibility complex–class II. This complex is located at the cell surface, where it is involved in immune-mediated signal transduction.
In a previous study, we showed that two members of the major histocompatibility complex–class II gene family, HLADR-B1 and B5, could potentially predict UM in patients with multiple myeloma [20]. We therefore hypothesize that HLA-based immunity protect against tissue inflammation during treatment in both these disease categories. Because mucositis may be considered an inflammatory state, those findings might add to our molecular understanding of why RT induces severe mucositis in some patients.
Pretreatment gene signature of TSCC
In mucosa, we found that TSCC induced a specific gene signature different from controls (Table 3). In particular, we found that TSCC induced changes in the expression of leukemia inhibitor factor receptor-alpha (LIFR), platelet-derived growth factor receptor-alpha (PDGFR), and secreted protein acidic and cysteine rich-like protein (SPARCL) genes. First, this signature was present in clinically normal-appearing oral mucosa located at a distance from the tonsil tumor. Second, the signature was expressed independently of alcohol consumption, smoking habits, and p16 overexpression in the tumor, in addition to other clinical features. Third, this signature remained practically unchanged throughout RT.
LIFR, a transmembrane receptor protein of the type 1 cytokine receptor family, is involved in cellular differentiation, proliferation, and survival; moreover, it inhibits the p53 apoptotic pathway. Low expression has been detected in various human cancers [45]. However, LIFR has been identified as both a suppressor and a promoter of carcinogenesis. PDGFR encodes a cell-surface tyrosine kinase receptor that binds platelet-derived growth factor family members. The receptor complex activates pathways involved in cell migration and chemotaxis during wound healing [46]; additionally, mutations in PDGFRA play an active role in cancer development [47]. Finally, SPARCL is involved in extracellular matrix synthesis. It was downregulated in number human cancer types [48]. It remains unclear why these genes, which are involved in cellular differentiation, wound healing, and extracellular matrix formation, are downregulated in clinically normal-appearing mucosa acquired from patients with TSCC. Future studies should investigate whether this phenotype might indicate increased susceptibility to malignant transformation.
The GGE analysis of blood samples revealed a large array of snRNA-type pseudogenes. Of these, RNU6-620P was downregulated 11.8-fold (P = 5.80e-80) and RNU6-622P was upregulated 7.3-fold (P = 8.62e-05) compared to controls. A cluster analysis of the expression of snRNAs and other noncoding RNAs in the blood revealed that distinctly different clusters of noncoding RNAs were associated with TSCC and controls (Fig 5). The protein coding genes did not show the same distinction.
Conclusion
In this pilot study, we described a gene signature expressed by mucosal tissue and circulating peripheral blood cells from patients with TSCC in response to RT. We chose to take the second biopsy before any macroscopic damage in order to gain insight into the molecular processes that underlie mucositis and to avoid harvesting disintegrates tissue dominated by inflammatory mediators. RT caused molecular alterations related to apoptosis, DNA damage, DNA repair, and proliferation. However, these alterations were independent of clinical mucositis severity. Furthermore we identified a potential protective biomarker for ulcerative mucositis. Based on these results, we concluded that our model was feasible, and the data will be useful in designing a prospective clinical validation trial for characterizing mucositis at the molecular level and identifying predictive biomarkers.
Accesion codes
Phenotype data described in this manuscript was deposited at the NCBI Gene Expression Omnibus (GEO) repository under no GSE103412.
Data Availability
Our data is publicly available at GEO depository number GSE103412 (https://www.ncbi.nlm.nih.gov/geo/query/acc.cgi?acc=GSE103412).
Funding Statement
Grant no 25042 received from Det Obelske Familiefond (http://obel.com/) to Mette Marcussen. The funders has no role in the design, data collection and analysis, decision to publish, or preparation of the manuscript.
References
- 1.Mortensen HR, Overgaard J, Specht L, Overgaard M, Johansen J, Evensen JF, et al. Prevalence and peak incidence of acute and late normal tissue morbidity in the DAHANCA 6&7 randomised trial with accelerated radiotherapy for head and neck cancer. Radiother Oncol 2012;103:69–75. 10.1016/j.radonc.2012.01.002 [DOI] [PubMed] [Google Scholar]
- 2.Sonis ST. Oral Mucositis in Head and Neck Cancer: Risk, Biology, and Management. ASCO educational Book; 2013; e236–40. http://meetinglibrary.asco.org/record/78881/edbook#fulltext [DOI] [PubMed] [Google Scholar]
- 3.Chaturvedi AK, Anderson WF, Lortet-Tieulent J, Curado MP, Ferlay J, Franceschi S, et al. Worldwide Trends in Incidence Rates for Oral Cavity and Oropharyngeal Cancers. J Clin Oncol 2013;36:4550–9. 10.1200/JCO.2013.50.3870 [DOI] [PMC free article] [PubMed] [Google Scholar]
- 4.Garnaes E, Kiss K, Andersen L, Therkildsen MH, Franzmann MB, Filtenborg-barnkob B, et al. A high and increasing HPV prevalence in tonsillar cancers in Eastern Denmark, 2000–2010: The largest registry-based study to date. International Journal of Cancer to date 2015;2203:2196–203. 10.1002/ijc.29254 [DOI] [PubMed] [Google Scholar]
- 5.Trotti A, Bellm LA, Epstein JB, Frame D, Fuchs HJ, Gwede CK, et al. Mucositis incidence, severity and associated outcomes in patients with head and neck cancer receiving radiotherapy with or without chemotherapy: a systematic literature review. Radiother Oncol 2003;66:253–62. 10.1016/S0167-8140(02)00404-8 [DOI] [PubMed] [Google Scholar]
- 6.Murphy BA, Beaumont JL, Isitt J, Garden AS, Gwede CK, Trotti AM, et al. Mucositis-Related Morbidity and Resource Utilization in Head and Neck Cancer Patients Receiving Radiation Therapy With or Without Chemotherapy. J Pain Symptom Manage 2009;38:522–32. 10.1016/j.jpainsymman.2008.12.004 [DOI] [PubMed] [Google Scholar]
- 7.Abendstein H, Nordgren M, Boysen M, Jannert M, Silander E, Ahlner-Elmquist M, et al. Quality of Life and Head and Neck Cancer: A 5 Year Prospective Study. Laryngoscope 2005;115:2183–92. 10.1097/01.MLG.0000181507.69620.14 [DOI] [PubMed] [Google Scholar]
- 8.Elad S, Zadik Y. Chronic oral mucositis after radiotherapy to the head and neck: a new insight. Support Care Cancer 2016;11:4825–30. 10.1007/s00520-016-3337-5 [DOI] [PubMed] [Google Scholar]
- 9.Grégoire V, Lefebvre JL, Licitra L, Felip E. Squamous cell carcinoma of the head and neck: EHNS-ESMO-ESTRO Clinical Practice Guidelines for diagnosis, treatment and follow-up. Ann Oncol 2010;21 Suppl 5:v184–6. 10.1093/annonc/mdq185 [DOI] [PubMed] [Google Scholar]
- 10.Kouloulias V, Thalassinou S, Platoni K, Zygogianni A, Kouvaris J, Antypas C, et al. The treatment outcome and radiation-induced toxicity for patients with head and neck carcinoma in the IMRT era: a systematic review with dosimetric and clinical parameters. Biomed Res Int 2013:401261 10.1155/2013/401261 [DOI] [PMC free article] [PubMed] [Google Scholar]
- 11.Bhide SA, Gulliford S, Schick U, Miah A, Zaidi S, Newbold K, et al. Dose–response analysis of acute oral mucositis and pharyngeal dysphagia in patients receiving induction chemotherapy followed by concomitant chemo-IMRT for head and neck cancer. Radiother Oncol 2012;103:88–91. 10.1016/j.radonc.2011.12.027 [DOI] [PubMed] [Google Scholar]
- 12.Elting LS, Ooksley CD, Chambers MS, Garden AS. Risk, outcomes and costs of radiation-induced oral mucositis among patients with head-and-neck malignancies. Int J Radiat Oncol Biol Phys 2007;68:1110–20. 10.1016/j.ijrobp.2007.01.053 [DOI] [PubMed] [Google Scholar]
- 13.Lalla RV, Bowen J, Barasch A, Elting L, Epstein J, Keefe DM, et al. MASCC/ISOO clinical practice guidelines for the management of mucositis secondary to cancer therapy. Cancer 2014;120:1453–61. 10.1002/cncr.28592 [DOI] [PMC free article] [PubMed] [Google Scholar]
- 14.Xanthinaki A, Nicolatou-Galitis O, Athanassiadou P, Gonidi M, Kouloulias V, Sotiropoulou-Lontou A, et al. Apoptotic and inflammation markers in oral mucositis in head and neck cancer patients receiving radiotherapy: preliminary report. Support Care Cancer 2008;16:1025–33. 10.1007/s00520-007-0379-8 [DOI] [PubMed] [Google Scholar]
- 15.Sonis ST, Scherer J, Phelan S, Lucey C a, Barron JE, O’Donnell KE, et al. The gene expression sequence of radiated mucosa in an animal mucositis model. Cell Prolif 2002;35 Suppl 1:93–102. 10.1046/j.1365-2184.35.s1.10.x [DOI] [PMC free article] [PubMed] [Google Scholar]
- 16.Sonis S, Haddad R, Posner M, Watkins B, Fey E, Morgan TV, et al. Gene expression changes in peripheral blood cells provide insight into the biological mechanisms associated with regimen-related toxicities in patients being treated for head and neck cancers. Oral Oncol 2007;43:289–300. 10.1016/j.oraloncology.2006.03.014 [DOI] [PubMed] [Google Scholar]
- 17.Sonis ST, Elting LS, Keefe D, Peterson DE, Schubert M, Hauer-Jensen M, et al. Perspectives on cancer therapy-induced mucosal injury: pathogenesis, measurement, epidemiology, and consequences for patients. Cancer 2004;100:1995–2025. 10.1002/cncr.20162 [DOI] [PubMed] [Google Scholar]
- 18.Kabacik S, Mackay A, Tamber N, Manning G, Finnon P, Paillier F, et al. Gene expression following ionising radiation: identification of biomarkers for dose estimation and prediction of individual response. Int J Radiat Biol 2011;87:115–29. 10.3109/09553002.2010.519424 [DOI] [PubMed] [Google Scholar]
- 19.Marcussen M, Skrubbeltrang C, Bødker JS, Christiansen I, Bøgsted M, Dybkær K, et al. A systematic review of molecular responses to cancer therapy in normal human mucosa. TripleO 2017; In press. 10.1016/j.oooo.2017.08.002 [DOI] [PubMed] [Google Scholar]
- 20.Marcussen M, St J, Heidi S, Johansen P, Nielsen S, Christiansen I, et al. Molecular Characteristics of High-Dose Melphalan Associated Oral Mucositis in Patients with Multiple Myeloma: A Gene Expression Study on Human Mucosa. PlosOne 2017(1): e0169286 10.1371/journal.pone.0169286 [DOI] [PMC free article] [PubMed] [Google Scholar]
- 21.Manikantan K, Sayed SI, Syrigos KN, Rhys-Evans P, Nutting CM, Harrington KJ, et al. Challenges for the future modifications of the TNM staging system for head and neck cancer: Case for a new computational model? Cancer Treat Rev 2009;35:639–44. 10.1016/j.ctrv.2009.04.010 [DOI] [PubMed] [Google Scholar]
- 22.Kennedy WR, Herman MP, Deraniyagala RL, Amdur RJ, Werning JW, Dziegielewski P, et al. Radiotherapy alone or combined with chemotherapy as definitive treatment for squamous cell carcinoma of the tonsil. Eur Arch Oto-Rhino-Laryngology 2016;273:2117–25. 10.1007/s00405-016-4027-0 [DOI] [PubMed] [Google Scholar]
- 23.Grégoire V, Ang K, Budach W, Grau C, Hamoir M, Langendijk JA, et al. Delineation of the neck node levels for head and neck tumors: a 2013 updata. DAHANCA, EORTC, HKNPCSG, NCIC CTG, NCRI, RTOG, TROG consensus guidelines. Radiother Oncol 2014;110:172–81. 10.1016/j.radonc.2013.10.010 [DOI] [PubMed] [Google Scholar]
- 24.Quinn B, Stone R, Uhlenhopp M, McCann S, Blijlevens N. Ensuring accurate oral mucositis assessment in the European Group for Blood and Marrow Transplantation Prospective Oral Mucositis Audit. Eur J Oncol Nurs 2007;11 Suppl 1:S10–8. 10.1016/S1462-3889(07)70003-0 [DOI] [PubMed] [Google Scholar]
- 25.R Development Core Team (2011), R: A Language and Environment for Statistical Computing. Vienna, Austria: the R Foundation for Statistical Computing; ISBN: 3-900051-07-0. http://www.R-project.org/ [Google Scholar]
- 26.Gentleman RC, Carey VJ, Bates DM, Bolstad B, Dettling M, Dudoit S, et al. Bioconductor: open software development for computational biology and bioinformatics. Genome Biol 2004;5:R80 10.1186/gb-2004-5-10-r80 [DOI] [PMC free article] [PubMed] [Google Scholar]
- 27.Lee MLT, Whitmore GA. Power and sample size for DNA microarray studies. Stat Med 2002;21:3543–70. 10.1002/sim.1335 [DOI] [PubMed] [Google Scholar]
- 28.Dai M, Wang P, Boyd AD, Kostov G, Athey B, Jones EG, et al. Evolving gene/transcript definitions significantly alter the interpretation of GeneChip data. Nucleic Acids Res 2005;33:1–9. 10.1093/nar/gni179 [DOI] [PMC free article] [PubMed] [Google Scholar]
- 29.Smyth G. Linear models and empirical bayes methods for assessing differential expression in microarray experiments. Stat Appl Genet Mol Biol 2004;3:Article3. 10.2202/1544-6115.1027 [DOI] [PubMed] [Google Scholar]
- 30.Benjamini Y, Hochberg Y. Controlling the false discovery rate: a practical and powerful approach to multiple testing. J R Stat Soc 1995;57:289–300. https://www.jstor.org/stable/2346101 [Google Scholar]
- 31.Subramanian A, Tamayo P, Mootha VK, Mukherjee S, Ebert BL, Gilette MA. Gene set enrichment analysis: a knowledge-based approach for interpreting genome-wide expression profiles. Proc Natl Acad Sci U S A 2005; 43:15545–50. 10.1073/pnas.0506580102 [DOI] [PMC free article] [PubMed] [Google Scholar]
- 32.Bonan PRF, Kaminagakura E, Pires FR, Vargas PA, De Almeida OP. Histomorphometry and immunohistochemical features of grade I (WHO) oral radiomucositis. Oral Dis 2007;2:170–6. 10.1111/j.1601-0825.2006.01254.x [DOI] [PubMed] [Google Scholar]
- 33.Yeoh AS, Bowen JM, Gibson RJ, Keefe DM. Nuclear factor kappaB (NFkappaB) and cyclooxygenase-2 (Cox-2) expression in the irradiated colorectum is associated with subsequent histopathological changes. Int J Radiat Oncol Biol Phys 2005;63:1295–303. 10.1016/j.ijrobp.2005.04.041 [DOI] [PubMed] [Google Scholar]
- 34.Prott FJ, Handschel J, Micke O, Sunderkötter C, Meyer U, Piffko J. Long-term alterations of oral mucosa in radiotherapy patients. Int J Radiat Oncol Biol Phys 2002;54:203–10. 10.1016/S0360-3016(02)02867-5 [DOI] [PubMed] [Google Scholar]
- 35.Handschel J, Sunderkötter C, Prott F, Meyer U, Kruse-Lösler B, Joos U. Increase of RM3/1-positive macrophages in radiation- induced oral mucositis 2001;193:242–7. 10.1002/1096-9896(2000)9999:9999<::AID-PATH754>3.0.CO;2-P [DOI] [PubMed] [Google Scholar]
- 36.Dörr W, Hamilton CS, Boyd T, Reed B, Denham JW. Radiation-induced changes in cellularity and proliferation in human oral mucosa. Int J Radiat Oncol Biol Phys 2002;52:911–7. 10.1016/S0360-3016(01)02721-3 [DOI] [PubMed] [Google Scholar]
- 37.Bonan F, Kaminagakura E, Roge P, Pires R, Vargas A. Cytokeratin expression in initial oral mucositis of head and neck irradiated patients. Oral Surg Oral Med Oral Pathol Oral Radiol Endod 2006;101:205–11. 10.1016/j.tripleo.2005.03.033 [DOI] [PubMed] [Google Scholar]
- 38.Handschel J, Sunderkötter C, Kruse-Lösler B, Prott FJ, Meyer U, Piffko J, et al. Late effects of radiotherapy on oral mucosa in humans. Eur J Oral Sci 2001;109:95–102. 10.1034/j.1600-0722.2001.00975.x [DOI] [PubMed] [Google Scholar]
- 39.Tanikawa C, Furukawa Y, Yoshida N, Arakawa H, Nakamura Y, Matsuda K. XEDAR as a putative colorectal tumor suppressor that mediates p53-regulated anoikis pathway. Oncogene 2009;28:3081–92. 10.1038/onc.2009.154 [DOI] [PubMed] [Google Scholar]
- 40.Su C, Gao G, Schneider S, Helt C, Weiss C, O’Reilly MA, et al. DNA damage induces downregulation of histone gene expression through the G1 checkpoint pathway. EMBO J 2004;23:1133–43. 10.1038/sj.emboj.7600120 [DOI] [PMC free article] [PubMed] [Google Scholar]
- 41.Nag S. The MDM2-p53 pathway revisited. J Biomed Res 2013;27:254–71. 10.7555/JBR.27.20130030 [DOI] [PMC free article] [PubMed] [Google Scholar]
- 42.Tudor D, Locke M, Owen-Jones E, Mackenzie IC. Intrinsic patterns of behavior of epithelial stem cells. J Investig Dermatol Symp Proc 2004;9:208–14. 10.1111/j.1087-0024.2004.09310.x [DOI] [PubMed] [Google Scholar]
- 43.Tchakarov L, Vitale ML, Jeyapragasan M, Del Castillo AR, Trifaró JM. Expression of scinderin, an actin filament-severing protein, in different tissues. FEBS Lett 1990;268:209–12. 10.1016/0014-5793(90)81010-L [DOI] [PubMed] [Google Scholar]
- 44.Acauan MD, Figueiredi MA, Cherubini K, Gomes AP, Salum FG. Radiotherapy-induced salivary dysfunction: structural changes, pathogenic mechanisms and therapies. Arch Oral Biol 2015;60:1802–10. 10.1016/j.archoralbio.2015.09.014 [DOI] [PubMed] [Google Scholar]
- 45.Alisoltani A, Fallahi H, Ebrahimi M, Ebrahimi M, Ebrahimie E. Prediction of Potential Cancer-Risk Regions Based on Transcriptome Data: Towards a Comprehensive View. PlosOne 2014. 10.1371/journal.pone.0096320 [DOI] [PMC free article] [PubMed] [Google Scholar]
- 46.Barrientos S, Stojadinovic O, Golinko MS, Brem H, Tomic-Canic M. Growth factors and cytokines in wound healing. Wound Repair Regen 2008;16:585–601. 10.1111/j.1524-475X.2008.00410.x [DOI] [PubMed] [Google Scholar]
- 47.Li M, Jendrossek V, Belka C. The role of PDGF in radiation oncology. Radiat Oncol 2007;2:5 10.1186/1748-717X-2-5 [DOI] [PMC free article] [PubMed] [Google Scholar]
- 48.Gagliardi F, Narayanan A, Mortini P. Critical Reviews in Oncology / Hematology SPARCL1 a novel player in cancer biology. Crit Rev Oncol / Hematol 2017;109:63–8. 10.1016/j.critrevonc.2016.11.013 [DOI] [PubMed] [Google Scholar]
Associated Data
This section collects any data citations, data availability statements, or supplementary materials included in this article.
Data Availability Statement
Our data is publicly available at GEO depository number GSE103412 (https://www.ncbi.nlm.nih.gov/geo/query/acc.cgi?acc=GSE103412).