

Abstract
Objective:
The aim of this study was to quantify the relationship between workers’ body mass index and work productivity within various occupations.
Methods:
Data from two administrations (2014 and 2015) of the United States (US) National Health and Wellness Survey, an Internet-based survey administered to an adult sample of the US population, were used for this study (n = 59,772). Occupation was based on the US Department of Labor's 2010 Standardized Occupation Codes. Outcomes included work productivity impairment and indirect costs of missed work time.
Results:
Obesity had the greatest impact on work productivity in Construction, followed by Arts and Hospitality occupations. Outcomes varied across occupations; multivariable analyses found significant differences in work productivity impairment and indirect costs between normal weight and at least one obesity class.
Conclusion:
Obesity differentially impacted productivity and costs, depending upon occupation.
Learning Objectives
Become familiar with previous evidence on the prevalence of obesity and its impact on productivity and costs in different industries and occupational categories.
Summarize the new findings on differences in obesity prevalence, productivity loss, and indirect costs between different types of occupations.
Discuss the study implications for developing interventions to address the economic impact of excess body weight.
According to the World Health Organization,1 obesity is defined as having a body mass index (BMI; calculated on the basis of height and weight) of at least 30.0 kg/m2 and can be further subdivided into class I (BMI 30.0 to 34.9 kg/m2), class II (BMI 35.0 to 39.9 kg/m2), and class III (BMI ≥40.0 kg/m2). Approximately a quarter of US adult men (25.3%) and women (24.6%) are estimated to be in the obese weight category.2 Further, obesity has been associated with a range of physical and psychiatric conditions, including, but not limited to, heart disease, cancer, type-2 diabetes, pain and joint-related disorders, such as osteoarthritis,3–7 and depression.8 Unsurprisingly, people who are obese are at risk for reduced life expectancy.9–15
The impact of excess weight in the workplace has also been a domain of investigation, with a number of studies detailing the rising prevalence of obesity across industries and occupational groups. Jackson et al16 reported that from 2004 to 2011, the age-adjusted prevalence of obesity increased in all industries in the US, although estimates differed by race. Specifically, African–American women were more likely to be obese than white women in every industry category, whereas the prevalence of obesity was higher for African–American (vs white) men only in the Health Care and Social Assistance, Education Services, Public Administration, and Manufacturing industry categories. When examined by occupational group, the highest age-standardized obesity prevalence was found for US adults working in the Motor Vehicle Operator occupational category (39.2%), with the lowest prevalence for those working in the Health Diagnosing and Treating Practitioner (15.4%) category.17
Although preliminary studies suggest that obesity may differentially impact work productivity and costs, based on occupational requirements, there is a paucity of research examining the impact of obese weight status across occupations, and findings have thus far been mixed. A large-scale, cross-sectional Dutch population study reported that obesity was predictive of developing musculoskeletal symptoms, especially among workers whose jobs had low (vs high) physical workloads (ie, the extent to which the respondent's job requires repetitive motions, awkward body positioning, etc).18 Yet, the researchers acknowledged that their findings could alternatively be explained by individuals with musculoskeletal symptoms tending to self-select into occupations with fewer physical job demands. Gates et al19 found a significant relationship between excess weight and impaired productivity among a sample of Manufacturing employees. Specifically, individuals with a BMI at least 35.0 kg/m2 reported a health-related productivity loss of nearly 5.0% and needed additional time to complete physically demanding tasks. Finally, Cawley et al,20 examining costs attributable to obesity-related absenteeism across a number of primarily office-based positions, found that costs differed by occupation, with Management and Professional occupations incurring the highest costs per worker.
The extant research has primarily focused on how BMI impacts work productivity and costs without consideration of occupational requirements; results have consistently highlighted the negative effects of obesity on these outcomes. For instance, obese BMI has been associated with significantly greater absenteeism among US workers than normal BMI, after controlling for demographic characteristics (eg, age, gender, race).21 Tunceli et al22 found that excess weight was predictive of future workforce participation, with obese individuals less likely to be employed over time than normal weight counterparts. In addition, a large-scale Canadian-based study found, among a cohort of 56,971 respondents, that obesity was an independent predictor of absenteeism and presenteeism.23 Notably, obese individuals with cardiometabolic risk factors (ie, diabetes, hyperlipidemia, and/or hypertension) reported significantly greater impairments in productivity and higher medical expenditures than normal weight individuals with the same risk factors,24,25 which demonstrates the unique contribution of obesity to less favorable outcomes. Excess weight was also associated with impaired health status and work productivity, as well as increased health care resource utilization, among US workers,26 which has serious implications for the societal burden of obesity, given companies often cover the health insurance costs of their employees. Further, among employed US adults, annual direct (ie, medical expenditures) and indirect (ie, work productivity loss) costs totaled $73.1 billion, and nearly two-thirds of these costs were incurred by morbidly obese workers (BMI > 35.0 kg/m2).27 Obesity additionally accounted for up to 12.6% of annual absenteeism and over $8 billion in associated costs.21
Overall, previous studies have documented the prevalence of obesity by industry and occupational categories and examined the association between obesity and lost work productivity and associated costs.16,17 However, these studies have tended to focus on one or a few occupations.19,20 Thus, there exists a dearth of empirical research investigating the impact of obesity across varying occupational groups. Such research is critical, as excess weight may be associated with differing degrees of burden depending on profession and job responsibilities.
METHODS
Sample
All respondents from the 2014 and 2015 US National Health and Wellness Survey (NHWS), a self-administered, Internet-based questionnaire of adults (aged 18 years or older) who reported their occupation and had nonmissing weight data were included (n = 39,259). If a respondent completed the NHWS in multiple years, only the most recent data were included in this study. Underweight (BMI <18.5 kg/m2) respondents were excluded from the analyses. The survey was divided into two parts. The primary component was the base survey, which included demographic, health behaviors (eg, smoking), health history (eg, height and weight, current and previous medical conditions), and work productivity questions. The second section consisted of condition-specific (eg, diabetes) and noncondition-specific modules (eg, symptoms).
Measures
Weight Status
BMI was calculated on the basis of responses to items asking “What is your height?” and “What is your weight?” BMI was coded into the following categories: Normal-weight range (BMI 18.5 to 24.99 kg/m2), Overweight (BMI: 25.0 to 29.99 kg/m2), Obese class I (BMI: 30.0 to 34.99 kg/m2), Obese class II (BMI: 35.0 to 39.99 kg/m2), and Obese class III (BMI ≥40.0 kg/m2).1
Major Occupational Groups
Respondents of the NHWS were asked to provide their occupation as part of the in-depth demographic profile when they registered to join the Internet panel. Respondent occupations were first categorized into major occupational groups, based on the 2010 Standard Occupational Classification and Coding Structure (SOC), which was developed by the US Department of Labor, Bureau of Labor Statistics (BLS).28 Those occupational groups that included fewer participants were then merged. For example, the Installation, Maintenance, and Repair occupations, Building and Grounds Cleaning and Maintenance occupations, Farming, Fishing, and Forestry occupations, and Construction and Extraction occupations were merged to into one occupational group, Construction/Installation/Maintenance/Repair/Agriculture.
Demographics and Health Characteristics
Participants reported their demographic and health characteristics, which included age, sex, marital status, race, education, household income, smoking status, alcohol use, and exercise behavior. This information was used to describe the sample and was included as covariates in the multivariable analyses.
Comorbidity Burden
The Charlson comorbidity index (CCI) was used to represent overall health by gauging the presence of a range of disparate health conditions (eg, HIV/AIDS, metastatic tumor, moderate/severe renal disease, diabetes, mild liver disease, ulcer disease, connective tissue disease, chronic pulmonary disease, dementia, etc). A higher CCI score indicates that the respondent has more health conditions and is, therefore, not as healthy.29
Overall Work Productivity
Overall work productivity was derived using the Work Productivity and Activity Impairment-General Health (WPAI-GH) questionnaire, a six-item, validated instrument.30 Overall work impairment was measured by combining absenteeism (the self-reported number of work hours missed in the past week because of one's health divided by the total number of hours that one could have worked) and presenteeism (the self-reported level of impairment experienced while at work in the past seven days).
Indirect Costs
Indirect costs were calculated for each employed respondent by using median weekly income figures obtained from the BLS.31 For each respondent, an hourly rate was estimated by dividing the median weekly income by the length of the typical workweek. Next, the number of hours missed in the last week because of one's health (absenteeism) and the number of hours missed in the last week because of health impairment while at work (presenteeism) were each multiplied by the hourly rates to arrive at total lost wages. These figures were then multiplied by the average number of workweeks in a year to obtain annual estimates.
Statistical Analyses
Descriptive Statistics
All categorical variables were reported using frequencies and percentages. All continuous variables were reported using counts, means, medians, and standard deviations.
Multivariable Analyses
The independent variable was BMI category. Normal-weight BMI was the reference category. Separate generalized linear models (GLMs) for each occupational group were used to calculate the association between BMI and overall work productivity and indirect costs, controlling for age, sex, race, marital status, education, income, exercise, smoking, alcohol use, and CCI scores. To account for the skewing across the outcome variables, a negative binomial distribution and log-link function were specified. Adjusted means (least-squares means presented at the mean of the covariates) for all outcomes were calculated by using a maximum likelihood algorithm and reported in their original metric.
RESULTS
Demographics and Health Characteristics
In general, the sample was middle-aged (mean [M] = 41.89; SD = 13.13) and female (n = 11,300, 52.7%), and the majority self-identified as white (n = 16,833, 64.1%). Comorbidity burden, as measured by the CCI, was fairly low (M = 0.30, SD = 0.84). Almost one-third (n = 8453, 32.1%) of respondents in the full sample were obese. Approximately two-thirds of respondents (n = 22,900, 67.0%) reported consuming alcohol, and approximately the same percentage reported exercising within the past month (n = 22,494, 63.9%). A plurality (n = 12,113, 31.3%) have never smoked (Table 1). Protective Services (n = 1176, 39.2%) had the largest percentage of obese respondents, followed by Transportation (n = 832, 35.6%) and Healthcare (n = 4018, 30.2%) occupations; Science/Engineering had the fewest (n = 1949, 21.0%; Table 1).
TABLE 1.
Descriptive Statistics for Demographics, Health Characteristics, and BMI for the Total Sample and by Each Occupation Group
| Occupation Group | |||||||||||||
| Variable | Total | Finance | Education | Healthcare | Computer | Manufac-turing | Construction | Science | Hospitality | Arts | Protective Services | Transportation | Legal |
| Sex | |||||||||||||
| Male | 19015 (47.3%) | 3496 (61.9%) | 1884 (38.7%) | 1430 (35.6%) | 2902 (81.5%) | 1798 (77.2%) | 1944 (87.5%) | 1633 (83.8%) | 997 (61.4%) | 733 (54.5%) | 984 (83.7%) | 704 (84.6%) | 510 (69.1%) |
| Female | 11300 (52.7%) | 2154 (38.1%) | 2986 (61.3%) | 2588 (64.4%) | 659 (18.5%) | 532 (22.8%) | 277 (12.5%) | 316 (16.2%) | 627 (38.6%) | 613 (45.5%) | 192 (16.3%) | 128 (15.4%) | 228 (30.9%) |
| Race | |||||||||||||
| White | 16833 (64.1%) | 3177 (56.2%) | 3199 (65.7%) | 2275 (56.6%) | 1818 (51.1%) | 1172 (50.3%) | 1327 (59.7%) | 1013 (52.0%) | 687 (42.3%) | 794 (59.0%) | 556 (47.3%) | 415 (49.9%) | 400 (54.2%) |
| Minority | 13482 (35.9%) | 2473 (43.8%) | 1671 (34.3%) | 1743 (43.4%) | 1743 (48.9%) | 1158 (49.7%) | 894 (40.3%) | 936 (48.0%) | 937 (57.7%) | 552 (41.0%) | 620 (52.7%) | 417 (50.1%) | 338 (45.8%) |
| Income | |||||||||||||
| <$25k | 2617 (18.8%) | 238 (4.2%) | 369b (7.6%) | 313 (7.8%) | 94 (2.6%) | 284 (12.2%) | 388 (17.5%) | 52 (2.7%) | 508 (31.3%) | 145 (10.8%) | 106 (9.0%) | 95 (11.4%) | 25 (3.4%) |
| $25k–$50k | 6089 (25.8%) | 872 (15.4%) | 1044 (21.4%) | 857 (21.3%) | 451 (12.7%) | 627 (26.9%) | 635 (28.6%) | 227 (11.6%) | 461 (28.4%) | 287 (21.3%) | 283 (24.1%) | 247 (29.7%) | 98 (13.3%) |
| $50k–$75k | 6401 (19.2%) | 1159 (20.5%) | 1186 (24.4%) | 835 (20.8%) | 758 (21.3%) | 497 (21.3%) | 507 (22.8%) | 357 (18.3%) | 292 (18.0%) | 277 (20.6%) | 235 (20.0%) | 209 (25.1%) | 89 (12.1%) |
| ≥$75k | 14104 (30.5%) | 3202 (56.7%) | 2094 (43.0%) | 1808 (45.0%) | 2163 (60.7%) | 848 (36.4%) | 620 (27.9%) | 1234 (63.3%) | 285 (17.5%) | 580 (43.1%) | 525 (44.6%) | 261 (31.4%) | 484 (65.6%) |
| Marital status | |||||||||||||
| Single | 8864 (28.1%) | 1589 (28.1%) | 1188 (24.4%) | 1123 (27.9%) | 860 (24.2%) | 760 (32.6%) | 646 (29.1%) | 519 (26.6%) | 879 (54.1%) | 526 (39.1%) | 299 (25.4%) | 245 (29.4%) | 230 (31.2%) |
| Married | 18163 (56.1%) | 3466 (61.3%) | 3050 (62.6%) | 2397 (59.7%) | 2405 (67.5%) | 1328 (57.0%) | 1308 (58.9%) | 1297 (66.5%) | 593 (36.5%) | 696 (51.7%) | 723 (61.5%) | 476 (57.2%) | 424 (57.5%) |
| Education attainment | |||||||||||||
| Less than university degree | 8311 (46.2%) | 1111 (19.7%) | 552 (11.3%) | 918 (22.8%) | 637 (17.9%) | 1060 (45.5%) | 1378 (62.0%) | 175 (9.0%) | 1071 (65.9%) | 340 (25.3%) | 524 (44.6%) | 476 (57.2%) | 69 (9.3%) |
| At least university degree | 21976 (53.7%) | 4537 (80.3%) | 4317 (88.6%) | 3095 (77.0%) | 2921 (82.0%) | 1266 (54.3%) | 838 (37.7%) | 1772 (90.9%) | 549 (33.8%) | 1005 (74.7%) | 651 (55.4%) | 356 (42.8%) | 669 (90.7%) |
| Exercise frequency in past month | |||||||||||||
| None | 7715 (35.8%) | 1251 (22.1%) | 1164 (23.9%) | 1116 (27.8%) | 773 (21.7%) | 667 (28.6%) | 726 (32.7%) | 401 (20.6%) | 552 (34.0%) | 293 (21.8%) | 328 (27.9%) | 281 (33.8%) | 163 (22.1%) |
| 20 + minutes ≥1 time | 22494 (63.9%) | 4375 (77.4%) | 3698 (75.9%) | 2894 (72.0%) | 2764 (77.6%) | 1660 (71.2%) | 1489 (67.0%) | 1544 (79.2%) | 1058 (65.1%) | 1048 (77.9%) | 844 (71.8%) | 547 (65.7%) | 573 (77.6%) |
| Smoking status | |||||||||||||
| Current smoker | 5119 (18.7%) | 824 (14.6%) | 444 (9.1%) | 574 (14.3%) | 610 (17.1%) | 535 (23.0%) | 753 (33.9%) | 268 (13.8%) | 463 (28.5%) | 202 (15.0%) | 196 (16.7%) | 174 (20.9%) | 76 (10.3%) |
| Former smoker | 5973 (24.9%) | 1165 (20.6%) | 858 (17.6%) | 800 (19.9%) | 605 (17.0%) | 493 (21.2%) | 502 (22.6%) | 315 (16.2%) | 303 (18.7%) | 303 (22.5%) | 280 (23.8%) | 187 (22.5%) | 162 (22.0%) |
| Never smoked | 12113 (31.3%) | 2203 (39.0%) | 2279 (46.8%) | 1737 (43.2%) | 1423 (40.0%) | 812 (34.8%) | 616 (27.7%) | 822 (42.2%) | 590 (36.3%) | 544 (40.4%) | 469 (39.9%) | 315 (37.9%) | 303 (41.1%) |
| Alcohol use | |||||||||||||
| Does not currently drink | 7404 (32.9%) | 1268 (22.4%) | 1371 (28.2%) | 995 (24.8%) | 878 (24.7%) | 537 (23.0%) | 538 (24.2%) | 445 (22.8%) | 457 (28.1%) | 278 (20.7%) | 282 (24.0%) | 228 (27.4%) | 127 (17.2%) |
| Currently drinks | 22900 (67.0%) | 4381 (77.5%) | 3498 (71.8%) | 3021 (75.2%) | 2681 (75.3%) | 1792 (76.9%) | 1682 (75.7%) | 1504 (77.2%) | 1164 (71.7%) | 1068 (79.3%) | 894 (76.0%) | 604 (72.6%) | 611 (82.8%) |
| BMI | |||||||||||||
| Normal | 11363 (35.6%) | 2187 (38.7%) | 1879 (38.6%) | 1541 (38.4%) | 1401 (39.3%) | 826 (35.5%) | 730 (32.9%) | 824 (42.3%) | 659 (40.6%) | 540 (40.1%) | 271 (23.0%) | 222 (26.7%) | 283 (38.3%) |
| Overweight | 10499 (32.4%) | 2030 (35.9%) | 1530 (31.4%) | 1267 (31.5%) | 1281 (36.0%) | 807 (34.6%) | 843 (38.0%) | 716 (36.7%) | 527 (32.5%) | 460 (34.2%) | 444 (37.8%) | 314 (37.7%) | 280 (37.9%) |
| Obese class I | 4972 (17.4%) | 868 (15.4%) | 829 (17.0%) | 661 (16.5%) | 531 (14.9%) | 409 (17.6%) | 401 (18.1%) | 255 (13.1%) | 259 (15.9%) | 204 (15.2%) | 278 (23.6%) | 169 (20.3%) | 108 (14.6%) |
| Obese class II | 2039 (8.1%) | 326 (5.8%) | 358 (7.4%) | 325 (8.1%) | 198 (5.6%) | 173 (7.4%) | 164 (7.4%) | 92 (4.7%) | 103 (6.3%) | 86 (6.4%) | 109 (9.3%) | 68 (8.2%) | 37 (5.0%) |
| Obese class III | 1442 (6.6%) | 239 (4.2%) | 274 (5.6%) | 224 (5.6%) | 150 (4.2%) | 115 (4.9%) | 83 (3.7%) | 62 (3.2%) | 76 (4.7%) | 56 (4.2%) | 74 (6.3%) | 59 (7.1%) | 30 (4.1%) |
| Continuous Variables | |||||||||||||
| Mean ± SD | Mean ± SD | Mean ± SD | Mean ± SD | Mean ± SD | Mean ± SD | Mean ± SD | Mean ± SD | Mean ± SD | Mean ± SD | Mean ± SD | Mean ± SD | Mean ± SD | |
| Age mean ± SD | 41.89 ± 13.13 | 42.46 ± 13.17 | 44.75 ± 13.74 | 42.03 ± 13.07 | 41.16 ± 11.48 | 40.64 ± 12.37 | 42.84 ± 13.16 | 42.13 ± 13.32 | 34.61 ± 12.57 | 39.61 ± 13.64 | 40.87 ± 11.96 | 42.60 ± 12.65 | 43.02 ± 13.38 |
| CCI mean ± SD | .30 ± .84 | .31 ± .89 | .29 ± .80 | .30 ± .85 | .30 ± .80 | .31 ± .81 | .37 ± .97 | .23 ± .71 | .30 ± .92 | .26 ± .78 | .26 ± .80 | .28 ± .88 | .33 ± .93 |
| Overall work impairment | 17.00 ± 26.22 | 16.35 ± 26.28 | 14.65 ± 23.80 | 15.16 ± 24.83 | 19.89 ± 29.08 | 18.46 ± 26.55 | 20.54 ± 27.53 | 16.25 ± 26.23 | 19.54 ± 26.98 | 16.48 ± 25.13 | 16.33 ± 25.18 | 18.20 ± 28.03 | 14.88 ± 24.48 |
| Indirect costs | $6,200.72 ± $10,865.10 | $5,886.73 ± $10,483.69 | $5,002.81 ± $9,215.86 | $5,273.08 ± $10,019.19 | $7,259.61 ± $11,726.75 | $6,999.74 ± $11,439.49 | $8,053.17 ± $12,119.62 | $6,570.51 ± $11,978.59 | $6,027.41 ± $10,259.33 | $5,906.08 ± $10,542.17 | $6,569.27 ± $11,140.94 | $7,571.84 ± $13,275.64 | $5,673.04 ± $11,127.74 |
BMI, body mass index; CCI, Charlson comorbidity index; SD, standard deviation.
Overall Work Productivity Impairment
In general, work productivity impairment was positively associated with increases in BMI class. For all 12 occupational groups, there was a significant difference (P < 0.05) in overall work productivity impairment between normal BMI and at least one obesity class. The Construction/Installation occupation had the highest level of work impairment [17.95% (normal BMI) to 37.21% (obese class III)], followed by Arts [14.11% (normal BMI) to 28.89% (obese class III)] and Hospitality [17.32% (normal BMI) to 26.85% (obese class III)], whereas the Legal occupational category (n = 738) had the lowest level of work impairment [11.66% (normal BMI) to 19.42% (obese class III); Fig. 1]. However, direct comparisons across occupation groups could not be made because the adjusted means were within the confidence intervals.
FIGURE 1.
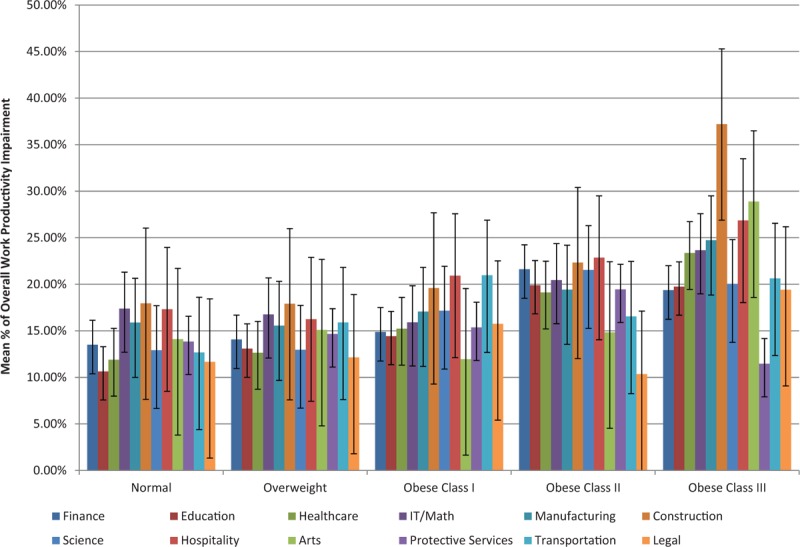
Mean percentage of overall work productivity impairment by BMI and occupation group, adjusted for covariates.
Indirect Costs
Indirect costs were also positively associated with BMI class. For each occupational group examined, there was a significant difference in indirect costs between normal-weight respondents and those in one or more of the obesity categories (P < 0.05). The Construction occupation group had the highest annual indirect costs [$7070.70 (normal BMI) to $12,336.75 (obese class III)], which was followed by Transportation [$5688.76 (normal BMI) to $11,741.81 (obese class III)] and Arts [$5142.21 (normal BMI) to $10,988.05 (obese class III)] occupations. In contrast, Manufacturing/Production had the lowest costs [$237.70 (normal BMI) to $1097.40 (obese class III); Fig. 2].
FIGURE 2.
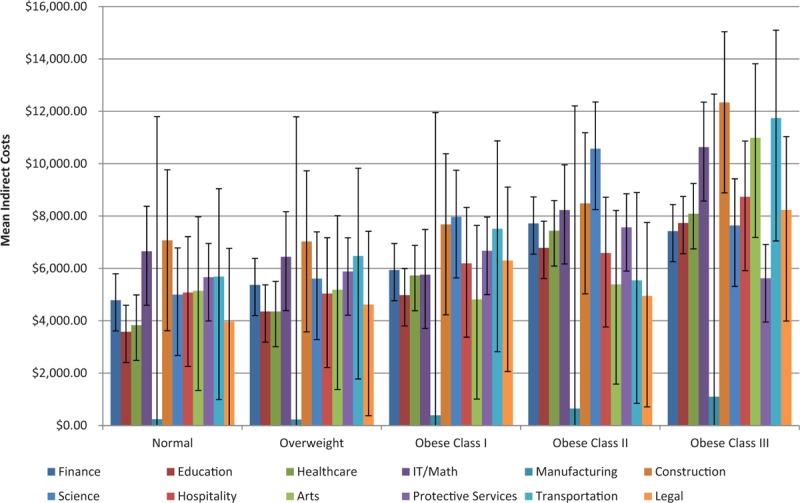
Mean indirect costs by BMI and occupation group, adjusted for covariates.
DISCUSSION
Obesity imposes significant health and economic burden in the US. The current study suggests that obesity has a negative impact in the workplace, which may differ by occupation. These findings reinforce the need for employers to evaluate the burden of obesity on work productivity and to try to address it. Almost one-third of the sample reported that they were obese, which is slightly lower than a recent estimate of 37.7% for US adults.32 Further, in the current study, nearly two-thirds (64.5%) of employed adult participants were overweight or obese. These results provided additional evidence of the considerable scope of the obesity epidemic among US workers.
A number of differences emerged in demographic characteristics, with males generally less likely to be obese than females, and minority participants less likely than whites to report being in higher BMI categories. Lower income respondents (less than $25k per year) and those with less than a college degree were more likely to be overweight or obese than normal-weight participants. As may be expected, the comorbidity burden (ie, CCI scores) increased along with increases in BMI class, which was consistent with prior research showing the strong links between obesity and a variety of comorbidities, such as cardiovascular disease, type-2 diabetes, and psychiatric conditions.11,14,15
Occupation-based analyses revealed obesity to be most common among those working in Protective Services professions, consistent with previous findings that reported a sharp increase over time in the prevalence of obesity within this occupation.17 Despite this finding, the poorest outcomes tended to be concentrated among two other occupational groups, Construction/Installation/Agriculture and Hospitality, which reported the highest comorbidity burden (ie, CCI scores), the highest rate of overall work productivity impairment, and the greatest indirect costs. One can hypothesize that perhaps those occupations that involve more physically demanding work are worst affected by obesity, compared with more sedentary occupations. Future studies may focus on identifying which factors relate to more burden for one occupational group versus another.
Previous studies have reported a significant relationship between obesity and indirect costs via work productivity loss.26 The current study likewise found that, across most major occupational groups, indirect costs typically increased concomitantly with BMI class. In many cases and in line with prior research,27 indirect costs for those in the obese class III group were higher than those incurred by normal-weight respondents, often by 50.0% or more.
Overall, the current findings highlight the considerable burden of obesity among US working adults. Furthermore, these findings provide important clarification regarding how this burden may vary based upon a worker's respective occupation. These results can provide a better understanding of the economic consequences attributable to obesity and inform broad-based interventions targeting education and healthy weight-loss for employees.
Limitations
For the current study, there are some limitations that should be noted. First, all data were self-reported, and no objective verification of BMI class, health history information, or work productivity was possible. Thus, we cannot exclude the possibility that recall biases or socially desirable responding may have occurred. Second, the data used in this study were cross-sectional, which precludes the ability to infer causality between BMI class and the outcomes of interest. Disability-related costs and other nonwage-related variables were not accounted for in the indirect cost calculation. Therefore, the current study may either underestimate or provide a very conservative estimate of indirect costs. It is also possible that selection bias limited the representativeness of the sample. Specifically, preliminary bivariate analyses (not shown) indicated that NHWS respondents who did not provide occupational data, and were thus excluded from the study, systematically differed on demographics, health history, and outcomes from study participants (ie, those who provided occupational data). Finally, although the NHWS is demographically representative of the general US adult population with respect to age, sex, and race, it is unclear to what extent this sample generalizes to the specific population of obese adults or whether the sample accurately represents the characteristics of workers within each major occupational category examined.
CONCLUSION
Overall, the findings underscored the substantial economic burden of obesity among US workers. Generally speaking, increasing BMI class was positively associated with impaired work productivity and indirect costs. However, this study revealed that these effects were not uniform, with notable differences emerging, based on participants’ respective occupation. The current study's findings are important in garnering a more complete understanding of the indirect economic impact of excess weight and in guiding broader occupation-specific interventions that target employee health.
Acknowledgments
The authors acknowledge Martine C. Maculaitis, PhD, and Errol Phillips, PhD, for their assistance with the literature review, editing, and helpful feedback on the analyses, on behalf of Kantar Health with funding from Novo Nordisk.
Footnotes
The study reported on in this manuscript was funded by Novo Nordisk.
IK is an employee of Kantar Health, which received funding from Novo Nordisk for conducting and reporting on this study. JH was an employee of Novo Nordisk at the time the study was conducted; RG is an employee of Novo Nordisk.
Authors Kudel, Huang, and Ganguly have no relationships/conditions/circumstances that present potential conflict of interest.
The JOEM editorial board and planners have no financial interest related to this research.
REFERENCES
- 1.World Health Organization (2000). Obesity: Preventing and Managing The Global Epidemic (Report of a WHO Consultation: WHO Technical Report Series 894). Available at: http://apps.who.int/iris/bitstream/10665/42330/1/WHO_TRS_894.pdf?ua=1&ua=1. Accessed March 24, 2016. [Google Scholar]
- 2.Armour BS, Courtney-Long E, Campbell VA, Wethington HR. Estimating disability prevalence among adults by body mass index: 2003–2009 National Health Interview Survey. Prev Chronic Dis 2012; 9:120136. [DOI] [PMC free article] [PubMed] [Google Scholar]
- 3.Hitt HC, McMillen RC, Thornton-Neaves T, Koch K, Cosby AG. Comorbidity of obesity and pain in a general population: results from the Southern Pain Prevalence Study. J Pain 2007; 8:430–436. [DOI] [PubMed] [Google Scholar]
- 4.Ray L, Lipton RB, Zimmerman ME, Katz MJ, Derby CA. Mechanisms of association between obesity and chronic pain in the elderly. Pain 2011; 152:53–59. [DOI] [PMC free article] [PubMed] [Google Scholar]
- 5.Urquhart DM, Berry P, Wluka AE, et al. 2011 Young Investigator Award winner: increased fat mass is associated with high levels of low back pain intensity and disability. Spine (Phila Pa 1976) 2011; 36:1320–1325. [DOI] [PubMed] [Google Scholar]
- 6.Wright LJ, Schur E, Noonan C, Ahumada S, Buchwald D, Afari N. Chronic pain, overweight, and obesity: findings from a community-based twin registry. J Pain 2010; 11:628–635. [DOI] [PMC free article] [PubMed] [Google Scholar]
- 7.Lementowski PW, Zelicof SB. Obesity and osteoarthritis. Am J Orthop (Belle Mead, NJ) 2008; 37:148–151. [PubMed] [Google Scholar]
- 8.Luppino FS, de Wit LM, Bouvy PF, et al. Overweight, obesity, and depression: a systematic review and meta-analysis of longitudinal studies. Arch Gen Psychiatry 2010; 67:220–229. [DOI] [PubMed] [Google Scholar]
- 9.Fontaine KR, Redden DT, Wang C, Westfall AO, Allison DB. Years of life lost due to obesity. JAMA 2003; 289:187–193. [DOI] [PubMed] [Google Scholar]
- 10.Calle EE, Rodriguez C, Walker-Thurmond K, Thun MJ. Overweight, obesity, and mortality from cancer in a prospectively studied cohort of U.S. adults. N Engl J Med 2003; 348:1625–1638. [DOI] [PubMed] [Google Scholar]
- 11.Guh DP, Zhang W, Bansback N, Amarsi Z, Birmingham CL, Anis AH. The incidence of co-morbidities related to obesity and overweight: a systematic review and meta-analysis. BMC Public Health 2009; 9:88. [DOI] [PMC free article] [PubMed] [Google Scholar]
- 12.Berrington de Gonzalez A, Hartge P, Cerhan JR, et al. Body-mass index and mortality among 1.46 million white adults. N Engl J Med 2010; 363:2211–2219. [DOI] [PMC free article] [PubMed] [Google Scholar]
- 13.Wolin KY, Carson K, Colditz GA. Obesity and cancer. Oncologist 2010; 15:556–565. [DOI] [PMC free article] [PubMed] [Google Scholar]
- 14.Dixon JB. The effect of obesity on health outcomes. Mol Cell Endocrinol 2010; 316:104–108. [DOI] [PubMed] [Google Scholar]
- 15.Scott KM, Bruffaerts R, Simon GE, et al. Obesity and mental disorders in the general population: results from the world mental health surveys. Int J Obes (Lond) 2008; 32:192–200. [DOI] [PMC free article] [PubMed] [Google Scholar]
- 16.Jackson CL, Wee CC, Hurtado DA, Kawachi I. Obesity trends by industry of employment in the United States, 2004 to 2011. BMC Obes 2016; 3:20. [DOI] [PMC free article] [PubMed] [Google Scholar]
- 17.Gu JK, Charles LE, Bang KM, et al. Prevalence of obesity by occupation among US workers: the National Health Interview Survey 2004–2011. J Occup Environ Med 2014; 56:516–528. [DOI] [PMC free article] [PubMed] [Google Scholar]
- 18.Viester L, Verhagen EA, Oude Hengel KM, Koppes LL, van der Beek AJ, Bongers PM. The relation between body mass index and musculoskeletal symptoms in the working population. BMC Musculoskelet Disord 2013; 14:238. [DOI] [PMC free article] [PubMed] [Google Scholar]
- 19.Gates DM, Succop P, Brehm BJ, Gillespie GL, Sommers BD. Obesity and presenteeism: the impact of body mass index on workplace productivity. J Occup Environ Med 2008; 50:39–45. [DOI] [PubMed] [Google Scholar]
- 20.Cawley J, Rizzo JA, Haas K. Occupation-specific absenteeism costs associated with obesity and morbid obesity. J Occup Environ Med 2007; 49:1317–1324. [DOI] [PubMed] [Google Scholar]
- 21.Andreyeva T, Luedicke J, Wang YC. State-level estimates of obesity-attributable costs of absenteeism. J Occup Environ Med 2014; 56:1120–1127. [DOI] [PMC free article] [PubMed] [Google Scholar]
- 22.Tunceli K, Li K, Williams LK. Long-term effects of obesity on employment and work limitations among U.S. adults, 1986 to 1999. Obesity (Silver Spring) 2006; 14:1637–1646. [DOI] [PubMed] [Google Scholar]
- 23.Sanchez Bustillos A, Vargas KG, 3rd, Gomero-Cuadra R. Work productivity among adults with varied body mass index: results from a Canadian population-based survey. J Epidemiol Glob Health 2015; 5:191–199. [DOI] [PMC free article] [PubMed] [Google Scholar]
- 24.Sullivan PW, Ghushchyan V, Ben-Joseph RH. The effect of obesity and cardiometabolic risk factors on expenditures and productivity in the United States. Obesity (Silver Spring) 2008; 16:2155–2162. [DOI] [PubMed] [Google Scholar]
- 25.Sullivan PW, Ghushchyan V, Wyatt HR, Wu EQ, Hill JO. Productivity costs associated with cardiometabolic risk factor clusters in the United States. Value Health 2007; 10:443–450. [DOI] [PubMed] [Google Scholar]
- 26.DiBonaventura M, Lay AL, Kumar M, Hammer M, Wolden ML. The association between body mass index and health and economic outcomes in the United States. J Occup Environ Med 2015; 57:1047–1054. [DOI] [PubMed] [Google Scholar]
- 27.Finkelstein EA, DiBonaventura M, Burgess SM, Hale BC. The costs of obesity in the workplace. J Occup Environ Med 2010; 52:971–976. [DOI] [PubMed] [Google Scholar]
- 28.US Bureau of Labor Statistics (2010, February). 2010 SOC User Guide. Available at: http://www.bls.gov/soc/soc_2010_class_and_coding_structure.pdf. Accessed March 24, 2016. [Google Scholar]
- 29.Charlson ME, Pompei P, Ales KL, MacKenzie CR. A new method of classifying prognostic comorbidity in longitudinal studies: development and validation. J Chronic Dis 1987; 40:373–383. [DOI] [PubMed] [Google Scholar]
- 30.Reilly MC, Zbrozek AS, Dukes EM. The validity and reproducibility of a work productivity and activity impairment instrument. Pharmacoeconomics 1993; 4:353–365. [DOI] [PubMed] [Google Scholar]
- 31.US Bureau of Labor Statistics (2015, November). Highlights of Women's Earnings in 2014. Available at: http://www.bls.gov/opub/reports/cps/highlights-of-womens-earnings-in-2014.pdf. Accessed March 24, 2016. [Google Scholar]
- 32.Flegal KM, Kruszon-Moran D, Carroll MD, Fryar CD, Ogden CL. Trends in obesity among adults in the United States, 2005 to 2014. JAMA 2016; 315:2284–2291. [DOI] [PMC free article] [PubMed] [Google Scholar]