

Abstract
Purpose
To identify baseline peripheral blood biomarkers associated with clinical outcome following ipilimumab treatment in advanced melanoma patients.
Experimental design
Frequencies of myeloid-derived suppressor cells (MDSCs) and regulatory T cells (Tregs), serum lactate dehydrogenase (LDH), routine blood counts, and clinical characteristics were assessed in 209 patients. Endpoints were overall survival (OS) and best overall response. Statistical calculations were done by Kaplan-Meier- and Cox-regression-analysis including calibration and discrimination by C-statistics.
Results
Low baseline LDH, absolute monocyte counts (AMC), Lin−CD14+HLA-DR−/low-MDSC frequencies, and high absolute eosinophil counts (AEC), relative lymphocyte counts (RLC), and CD4+CD25+FoxP3+-Treg frequencies were significantly associated with better survival, and were considered in a combination model. 43.5% of patients presenting with the best biomarker signature had a 30% response rate and median survival of 16 months. In contrast, patients with the worst biomarkers (27.5%) had only a 3% response rate and median survival of 4 months. The occurrence of adverse events correlated with neither baseline biomarker signatures nor the clinical benefit of ipilimumab. In another model, limited to the routine parameters LDH, AMC, AEC, and RLC, the number of favorable factors (4 vs. 3 vs. 2-0) was also associated with OS (p<0.001 for all pairwise comparisons) in the main study and additionally in an independent validation cohort.
Conclusions
A baseline signature of low LDH, AMC and MDSCs as well as high AEC, Tregs and RLC is associated with favorable outcome following ipilimumab. Prospective investigation of the predictive impact of these markers following ipilimumab and other treatments, e.g. PD-1 antibodies, is warranted.
Keywords: Melanoma, ipilimumab, biomarker, prognosis, MDSCs, Tregs, T cells, LDH
Introduction
Ipilimumab was the first agent to prolong survival of melanoma patients in randomized phase III studies (1, 2). However, only about 20% of treated patients experience a durable response, while all are at risk for side effects (3). The identification of patients who are most likely to experience clinical benefit will become increasingly important as alternative treatments such as combined targeted therapies, or anti-programmed cell death protein-1 (PD-1) antibodies become available (4, 5).
Thus far, no reliable laboratory parameter is established in daily clinical routine predicting clinical outcome after ipilimumab treatment. Such biomarkers may be useful to select patients likely to benefit and vice versa to steer those with a low chance to alternative treatments. Moreover, biomarkers can shed light on the mechanisms of immune-mediated tumor rejection (6). Early studies with ipilimumab reported a correlation between favorable clinical outcome and the occurrence of autoimmunity after ipilimumab (7, 8). High serum lactate dehydrogenase (LDH) levels before, and increasing values during, treatment were reported to predict poor outcome (9–14). However, this marker is not regularly considered for treatment decisions in most countries.
Ipilimumab acts indirectly through immune cells by allowing T cell activation. CD4+ T helper cells (15), CD8+ cytotoxic T cells (16, 17), those targeting melanoma-associated- (18) or neo-antigens (19, 20) are in principle able to attack cancer cells and are most likely responsible for the beneficial effects of ipilimumab. Moreover, recent breakthroughs in immunotherapy, especially anti-PD-1 (5, 21) and anti-programmed cell death ligand-1 (PD-L1) antibodies (22) impressively demonstrate the capacity of a modulated immune system to reject cancer. Therefore, immune-related factors are promising biomarkers. Low serum concentrations of soluble CD25 (14) or C-reactive protein (CRP) (23), and the presence of specific tumor mutations have been recorded in patients with favorable outcomes on ipilimumab treatment (19). The absolute lymphocyte count (ALC) (11–13, 23, 24), the neutrophil count (25), or the neutrophil to lymphocyte ratio (26) was reported by different groups as other possible biomarkers.
Phenotypic characterization of immune cells provides detailed information about the patient´s immune status (27). Populations with suppressive functions such as myeloid-derived suppressor cells (MDSCs) or regulatory T cells (Tregs) are especially promising biomarker candidates because they might limit the supposed beneficial mode of action of ipilimumab (28). We recently demonstrated a strong prognostic relevance of MDSCs in melanoma patients (29). MDSCs have also been reported as predictive marker candidates for following ipilimumab-administration (10, 30, 31).
The aim of the present study was to identify baseline peripheral blood biomarkers associated with overall survival (OS) and tumor response of melanoma patients treated with ipilimumab, by a comprehensive analysis of routine blood counts, frequencies of immune cell subsets analyzed by flow cytometry, and established prognostic factors (32). Moreover, we wanted to test whether the occurrence of adverse events after treatment with ipilimumab was associated with clinical outcome and/or baseline blood biomarkers.
Patients and Methods
Study design and patients
The study was conducted in two parts. The first part aimed to identify and confirm biomarker candidates, and to define prognostic models considering biomarker combinations. The second part aimed to validate the prognostic model based on routine markers as previously defined. In the first part of the study, inclusion criteria were stage IV melanoma, treatment with at least one dose of ipilimumab at 3 or 10 mg/kg in the metastatic (not adjuvant) setting, and availability of cryopreserved baseline peripheral blood mononuclear cells (PBMCs). Patients with uveal or mucosal melanoma were excluded. All patients gave written informed consent for biobanking, and use of biomaterials and clinical data for scientific purposes. This part was approved by the Ethics Committee, University of Tuebingen (approval 524/2012B02).
In the first part of the study two separate cohorts of patients (identification and confirmation cohort) were analyzed. The identification cohort comprised 105 patients from Amsterdam, Essen, Lausanne, Nantes and Tuebingen. The remaining 104 patients from Naples, New York and Siena were aligned to the confirmation cohort aiming at a balanced sample size of both cohorts. Differences in OS according to 28 factors were investigated in the identification cohort. These factors were gender, age and the pattern of visceral tumor involvement (soft tissue and/or lung only vs. involvement of other organs) the presence of brain metastases, LDH, absolute leucocyte counts, absolute and relative lymphocyte-, monocyte- and eosinophil counts, and the frequencies of 16 immune cell populations analyzed by flow cytometry (Supplementary Table 1). LDH was analyzed by means of the LDH-ratio (actual value divided by the upper limit of normal [ULN]). All blood parameters derived from blood draws taken within 28 days before the first dose.
The analysis of the identification cohort aimed to identify biomarker candidates. Candidates and respective cut-off points for continuous variables were defined by applying an optimization algorithm similar to those published earlier (10, 33). In detail, differences in OS for continuous variables were analyzed using a modified approach of maximally selected p-values based on log rank tests at different cut-off points to divide the identification cohort for each factor into two or three groups. First, only central cut-off points were analyzed resulting in two balanced groups. A central cut-off point was considered for survival analysis if the resulting smaller group comprised at least 25% of all patients. Of all analyzed cut-off points, the lowest significant log-rank p-value was chosen as cut-off candidate 1. If no significant log-rank p-value was observed for any analyzed central cut-off, potential eccentric cut-offs (the resulting smaller group comprised at least 10% of patients) were analyzed. Of all analyzed eccentric cut-off points the lowest significant log-rank p-value was chosen as cut-off 1. For continuous variables with an established cut-off 1, the definition of a second cut-off point resulting in three groups according to this variable was attempted. A central second cut-off point was considered for survival analysis, if the smallest of the resulting three groups comprised at least 25% of discovery cohort patients. Differences in OS between the three groups were analyzed using pairwise comparison and only cut-off points resulting in significant differences for each group-combination were further considered. Of those, the cut-off point resulting in the lowest significant log-rank p-value was chosen as cut-off 2. If no central second cut-off point could be established potential eccentric second cut-off points were considered for survival analysis, if the smallest of the resulting three groups comprised at least 10% of patients. Differences in OS between the three groups were analyzed using pairwise comparisons and only cut-off points resulting in significant differences for each group-combination were further considered. Of those, the cut-off point resulting in the lowest significant log-rank p-value was chosen as cut-off 2.
Factors that were not significantly correlated with OS in the identification cohort were not further considered. Factors categorizing patients into groups with significant differences in OS, as defined in the identification cohort, were subsequently tested for their association with OS in the confirmation cohort. Clinical responses were assessed by the investigators of the respective clinical site and categorized as either complete response (CR), partial response (PR), stable disease (SD) or progressive disease (PD) according to immune-related response criteria (irRC) (34). A blinded or independent radiologic review was not conducted. The best overall response (bOR) was defined by the best achieved response between starting administration of ipilimumab and progression or start of a new systemic treatment considering all available tumor assessments in this time period. Patients were classified as having experienced a clinical response if the bOR was PR or CR and clinical benefit in case of SD, PR, or CR. Data on grade III, IV and V adverse events (AE) according to common toxicity criteria, which were at least possibly related to ipilimumab, were collected for patients of the identification and confirmation cohort. Colitis/diarrhea, dermatitis, hypophysitis, hepatitis, and the development of Guillain-Barré-Syndrome were classified as immune-related adverse events (irAE).
After completion of this first part, a validation study was conducted in 406 patients from seven clinical sites (Ethics approval 234/2015B02). In contrast to the first part only patients treated at 3 mg/kg were considered. The collected data were limited to routine blood counts, LDH, and clinical parameters. PBMCs were not available for flow cytometric analysis. OS served as endpoint.
Flow cytometry
PBMCs were thawed and immediately analyzed by flow cytometry. Fc receptors were blocked with human IgG (Gamunex; Talecris, USA), and dead cells were excluded by ethidium monoazide labeling (EMA, Biotinum, USA). Staining was performed separately for the analysis of myeloid cells and T-cells/Tregs using antibody panels described in detail in Supplementary Table 1. Data were acquired with a BD LSR-II with FACS-Diva software V6.1.3 (BD, USA) and analyzed with FlowJo V9.3.2 (Tree Star, USA). Gating strategies are displayed in Supplementary Figure 1.
Statistics
Overall survival time was defined from the date of the first dose of ipilimumab to the date of last follow-up or death. Disease-specific survival probabilities were estimated according to the Kaplan-Meier method, and compared using log rank tests. Only deaths due to melanoma were considered; other causes of death were regarded as censored events. Cox proportional hazard regression models were applied to determine the impact of confirmed single factors. Results of Cox regression analysis are described by means of hazard ratios (HR), and p-values (Wald test). Patients with missing data in variables analyzed in the given model were excluded. The concordance index (c-index) was calculated for different models as a measure of the discriminatory ability that allows comparison of models. A model with a c-index=0.5 has no predictive value, a model with a c-index =1 would allow a perfect prediction of the patient´s outcome (35). The concordance index was analyzed using the survConcordance function in the survival package for R. Calibration of the combination models was calculated using the calibrate function in the rms package of R and the Kolmogorov Smirnov test for survival data using the coxph function in the survival package of R. Associations between clinical response and biomarker categories were analyzed by Chi square and Fisher´s exact tests. Throughout the analysis, p-values <0.05 were considered statistically significant. Analyses were carried out using SPSS 22 (IBM, USA) and R 3.2.1 (R Foundation for Statistical Computing, Vienna Austria).
Results
Patients and treatments
A total of 209 patients treated with ipilimumab at eight clinical sites was included in the first part of the study. A detailed listing of patient and treatment characteristics is presented in Table 1. Median age was 58 years, and 56.5% were male. 158 individuals were assigned to the M category M1c (76.3%), 29 to M1b (14%) and 20 to M1a (9.7%). Treatment was mainly administered in the compassionate use program (46.4%) or after marketing approval (43.5%). 206 patients received at least one prior systemic treatment before ipilimumab. Of 198 with available data on the bOR 37 (18.7%) experienced a CR or PR. An additional 29 patients had SD, resulting in a clinical benefit rate of 33.3%. 160 deaths were observed during follow-up (159 were melanoma-related, one was due to sepsis). Median OS after start of treatment was 7 months. Median follow-up was 19 months for patients who were alive at the last follow-up, and 5 months for those who died (Table 1).
Table 1.
Patient and treatment characteristics
| Factor | Category | Identification Cohort (n=105) |
Confirmation Cohort (n=104) |
Identification & confirmation cohort combined (n=209) | Validation Cohort (n=406) |
||||
|---|---|---|---|---|---|---|---|---|---|
| n | (%) | n | (%) | n | (%) | n | (%) | ||
| Clinical site | Amsterdam | 54 | 51.4 | 54 | 25.8 | 94 | 23.2 | ||
| Essen | 15 | 14.3 | 15 | 7.2 | 19 | 4.7 | |||
| Heidelberg | 113 | 27.8 | |||||||
| Lausanne | 10 | 9.5 | 10 | 4.8 | |||||
| Nantes | 10 | 9.5 | 10 | 4.8 | 49 | 12.1 | |||
| Naples | 20 | 19.2 | 20 | 9.6 | 34 | 8.4 | |||
| New York | 49 | 47.1 | 49 | 23.4 | |||||
| Siena | 35 | 33.7 | 35 | 16.7 | 38 | 9.4 | |||
| Tuebingen | 16 | 15.2 | 16 | 7.7 | 59 | 14.5 | |||
| Gender | Male | 55 | 52.4 | 63 | 60.6 | 118 | 56.5 | 192 | 47.3 |
| Female | 50 | 47.6 | 41 | 39.4 | 91 | 43.5 | 214 | 52.7 | |
| Age | ≤ 50 years | 39 | 37.1 | 28 | 26.9 | 67 | 32.1 | 119 | 29.3 |
| > 50 years | 23 | 21.9 | 26 | 25.0 | 49 | 23.4 | 86 | 21.2 | |
| > 60 years | 22 | 21.0 | 25 | 24.0 | 47 | 22.5 | 121 | 29.8 | |
| > 70 years | 21 | 20.0 | 25 | 24.0 | 46 | 22.0 | 80 | 19.7 | |
| Median age | 54 | 60 | 58 | 60 | |||||
| M category (AJCC) | M1a | 11 | 10.5 | 9 | 8.7 | 20 | 9.6 | 26 | 6.4 |
| M1b | 14 | 13.3 | 15 | 14.4 | 29 | 13.9 | 43 | 10.6 | |
| M1c | 78 | 74.3 | 80 | 76.9 | 158 | 75.6 | 336 | 82.8 | |
| Unknown | 2 | 1.9 | 2 | 1.0 | 1 | 0.2 | |||
| Visceral involvement | Soft tissue only | 14 | 13.3 | 13 | 12.5 | 27 | 12.9 | 41 | 10.1 |
| Lung | 15 | 14.3 | 30 | 28.8 | 45 | 21.5 | 56 | 13.8 | |
| Other organs | 76 | 72.4 | 61 | 58.7 | 137 | 65.6 | 308 | 75.9 | |
| Unknown | 1 | 0.2 | |||||||
| LDH | Elevated | 45 | 42.9 | 51 | 49.0 | 96 | 45.9 | 184 | 45.3 |
| Normal | 56 | 53.3 | 53 | 51.0 | 109 | 52.2 | 222 | 54.7 | |
| Unknown | 4 | 3.8 | 4 | 1.9 | |||||
| Treatment background | CA-184-128 (3 mg/kg, local IL-2) | 14 | 13.3 | 14 | 6.7 | ||||
| CA-184-169 (3 or 10 mg/kg) | 5 | 4.8 | 5 | 2.4 | |||||
| Early access program (3 mg/kg) | 34 | 32.4 | 63 | 60.6 | 97 | 46.4 | 117 | 28.8 | |
| Regular prescription (3 mg/kg) | 52 | 49.5 | 39 | 37.5 | 91 | 43.5 | 289 | 71.2 | |
| BMS-0241 (10 mg/kg, dacarbazine) | 2 | 1.9 | 2 | 1.0 | |||||
| Doses applied | 1 | 9 | 8.6 | 2 | 1.9 | 11 | 5.3 | 23 | 5.7 |
| 2 | 13 | 12.4 | 4 | 3.8 | 17 | 8.1 | 41 | 10.1 | |
| 3 | 16 | 15.2 | 16 | 15.4 | 32 | 15.3 | 43 | 10.6 | |
| 4 | 67 | 63.8 | 82 | 78.8 | 149 | 71.3 | 296 | 72.8 | |
| Best clinical response (irRC) | Complete response | 3 | 2.9 | 4 | 3.8 | 7 | 3.3 | ||
| Partial response | 17 | 16.2 | 13 | 12.5 | 30 | 14.4 | |||
| Stable disease | 15 | 14.3 | 14 | 13.5 | 29 | 13.9 | |||
| Progressive disease | 69 | 65.7 | 63 | 60.6 | 132 | 63.2 | |||
| Unknown | 1 | 1.0 | 10 | 9.6 | 11 | 5.3 | 406 | 100 | |
American Joint Committee on Cancer (AJCC), lactate dehydrogenase (LDH), immune-related response criteria (irRC), interleukin-2 (IL-2)
Validation was subsequently performed in the second part of the study in an additional independent cohort of 406 patients. Those patients were treated in the compassionate use program (n=117; 28.8%) or after marketing approval (n=289; 71.2%). 77 (19%) received ipilimumab as a first-line treatment, while the remaining patients had at least one prior systemic treatment. Among patients treated with ipilimumab included in the validation cohort the median age was 60 years, 47% were male. Of 405 individuals 336 were assigned to the M-category M1c (83%), 43 to M1b (10.6%), and 26 to M1a (6.4%). The M category was unknown in one patient. LDH was elevated in 184 (45.3%). 296 patients received all 4 doses, while in the remaining patients treatment was stopped after 1-3 doses. Median follow-up was 15 months for patients who were alive at the last follow-up, and 7 months for those who died. Median OS after start of ipilimumab was 8 months (Table 1).
Identification and confirmation of biomarkers
Altogether 28 variables were investigated in 105 patients (identification cohort) to identify biomarker candidates. Of these, 8 were not associated with prognosis including the presence of brain metastases. 13 variables were associated with OS at one, and 7 at two, optimized cut-off points. In total, 27 variable/cut-off combinations derived from 20 biomarkers were identified as candidates and further assessed in 104 patients (confirmation cohort). Here, 6 variables were also significantly associated with OS at one, and 2 variables at two previously defined cut-off points. In total, 10 biomarker/cut-off combinations derived from 8 biomarkers were confirmed and further considered. All variables, and survival analyses according to the cohorts and variable/cut-off combinations, are presented in Supplementary Table 2.
Survival analysis using confirmed biomarkers
OS according to eight confirmed biomarkers (LDH and Lin−CD14+HLA-DR−/low MDSCs at two cut-off points = 10 biomarker/cut-off combinations) in all patients of the combined identification and confirmation cohorts is presented in Table 2. LDH was the strongest biomarker for classifying patients according to OS into three groups. Median OS was 10 months for patients with baseline LDH up to 1.2-fold higher than the ULN, but for those with >1.2-or >2.3-fold, it was only 5 and 2 months, respectively (p=6.25×10⁻¹³; Figure 1A). A relative lymphocyte count (RLC) <10.5% identified patients with a 1-year survival probability of only 5% (p=3.30×10⁻¹²; Figure 1B). However, a low frequency of Lin−CD14+HLA-DR−/low MDSCs was associated with the highest probability of long-term survival. Thus, 2-year survival probability after ipilimumab initiation was 34.5% for 99 patients with MDSC frequencies <5.1%, while there were no survivors among 65 patients with higher baseline levels (p=6.73×10⁻¹¹; Figure 1C). An absolute monocyte count (AMC) <650/μL (Figure 1D) and a frequency of CD14+ monocytes <28% were also strongly associated with favorable outcome (p=1.35×10−08 and 6.58×10−07, respectively). Additionally, absolute (Figure 1E) and relative eosinophil counts (AEC and REC) were positively correlated with survival (p=5.06×10−05 and 2.14×10−04, respectively). Baseline frequencies of CD4+CD25+FoxP3+ Tregs ≥1.5% were associated with good prognosis after initiation of ipilimumab (p=8.70×10−05; Figure 1F).
Table 2.
Overall survival according to confirmed biomarkers
| Factor | Total n | Categories | n | % | % dead | Univariate survival analysis | |||||||
|---|---|---|---|---|---|---|---|---|---|---|---|---|---|
| Median survival (months) | 1-year survival rate (95% CI) | 2-year survival rate (95% CI) | 3-year survival rate (95% CI) | p-value | |||||||||
| LDH-ratio | 205 | ≤1.2 | 139 | 67.8 | 69.1 | 10 | 52.9 | [43.4; 62.5] | 30.3 | [20.7; 39.8] | 25.1 | [15.5; 34.7] | 6.25E-13 |
| >1.2 | 45 | 22.0 | 88.9 | 5 | 23.4 | [12.5; 34.3] | 11.7 | [1.9; 21.5] | 11.7 | [1.9; 21.5] | |||
| >2.3 | 21 | 10.2 | 100.0 | 2 | 10.0 | [0.0; 20.7] | 3.3 | [0.0; 9.8] | |||||
| Relative lymphocyte counts | 204 | <10.5% | 20 | 9.8 | 100.0 | 2 | 5.0 | [0.0; 14.6] | 3.30E-12 | ||||
| ≥10.5% | 184 | 90.2 | 72.8 | 8 | 40.8 | [33.6; 48.1] | 24.3 | [17.4; 31.3] | 20.1 | [13.2; 27.0] | |||
| Absolute monocyte counts | 204 | <650/μl | 165 | 80.9 | 70.9 | 9 | 42.6 | [34.9; 50.4] | 26.1 | [18.6; 33.5] | 22.3 | [14.8; 29.9] | 1.35E-08 |
| ≥650/μl | 39 | 19.1 | 94.9 | 2 | 15.4 | [4.1; 26.7] | 3.8 | [0.0; 11.0] | |||||
| Absolute eosinophil counts | 204 | <50/μl | 54 | 26.5 | 88.9 | 4 | 21.6 | [10.5; 32.7] | 6.7 | [0.0; 14.8] | 5.06E-05 | ||
| ≥50/μl | 150 | 73.5 | 70.7 | 9 | 42.9 | [34.8; 51.1] | 27.2 | [19.3; 35.1] | 22.2 | [14.3; 30.1] | |||
| Relative eosinophil counts | 204 | <1.5% | 89 | 43.6 | 85.4 | 6 | 24.8 | [15.5; 34.1] | 12.1 | [4.2; 20.0] | 7.5 | [0.5; 14.6] | 2.14E-04 |
| ≥1.5% | 115 | 56.4 | 67.8 | 9 | 46.8 | [37.5; 56.1] | 29.2 | [20.0; 38.4] | 25.9 | [16.7; 35.2] | |||
| CD4+CD25+FoxP3+ Tregs | 155 | <1.5% | 14 | 9.0 | 100.0 | 3 | 7.1 | [0.0; 20.6] | 8.70E-05 | ||||
| ≥1.5% | 141 | 91.0 | 72.3 | 9 | 43.3 | [34.9; 51.7] | 23.8 | [15.9; 31.8] | 21.2 | [13.4; 29.1] | |||
| CD14+ Monocytes | 189 | <28% | 162 | 85.7 | 70.4 | 9 | 43.5 | [35.7; 51.4] | 26.4 | [18.8; 34.0] | 22.9 | [15.3; 30.5] | 6.58E-07 |
| ≥28% | 27 | 14.3 | 96.3 | 4 | 13.3 | [0.0; 26.7] | |||||||
| Lin−CD14+HLA-DR−/low MDSCs | 164 | <5.1% | 99 | 60.4 | 64.6 | 13 | 51.2 | [41.1; 61.3] | 34.5 | [24.2; 44.9] | 29.4 | [19.0; 39.8] | 6.73E-11 |
| ≥5.1% | 39 | 23.8 | 87.2 | 5 | 24.9 | [11.1; 38.6] | |||||||
| ≥9.5% | 26 | 15.9 | 92.3 | 3 | 15.4 | [1.5; 29.3] | |||||||
Lactate dehydrogenase (LDH), regulatory T cells (Tregs), myeloid-derived suppressor cells (MDSCs)
Figure 1. Overall survival according to confirmed biomarkers.
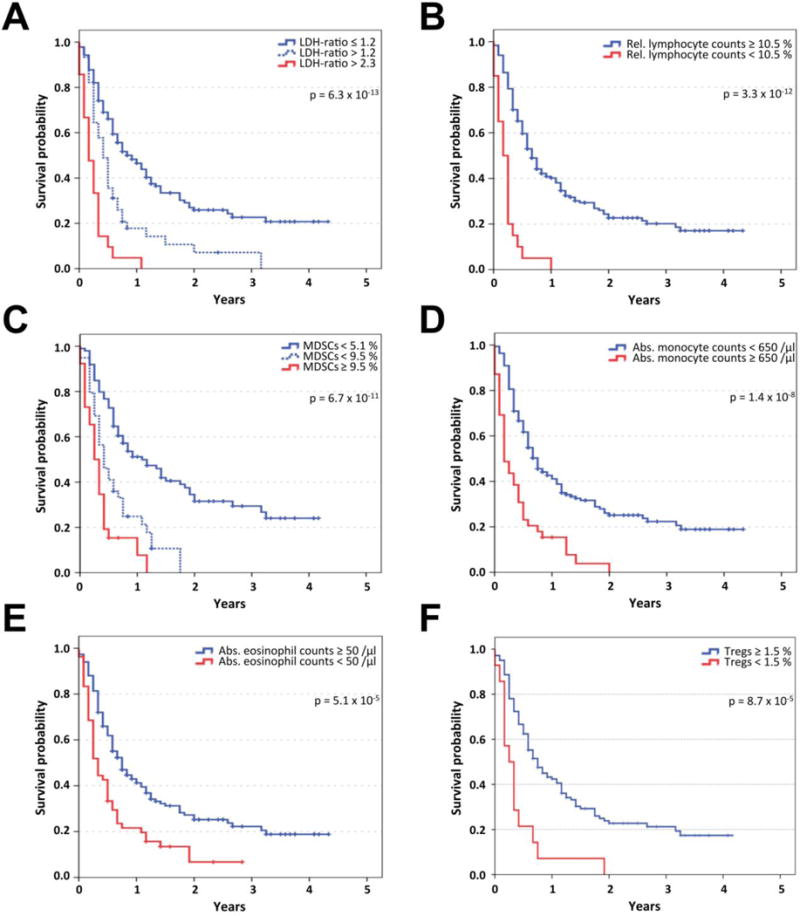
Kaplan-Meier analysis of overall survival in the identification and confirmation cohort (n=209) according to LDH-ratio (the measured LDH serum concentration divided by the upper limit of normal) (A), relative lymphocyte count (B), frequency of Lin−CD14+HLA-DR−/low myeloid-derived suppressor cells (MDSCs, C), absolute monocyte count (D), absolute eosinophil count (E), and frequency of CD4+CD25+FoxP3+ regulatory T cells (Tregs, F). Censoring is indicated by vertical lines; p-values were calculated by log rank statistics.
Definition of a combination model
Cox regression analysis was performed to determine the relative impact of confirmed biomarkers. LDH (at both cut-off points), MDSCs, RLC, AMC, and AEC (each at one cut-off) remained in the model as significantly independent biomarkers. REC, Tregs, or CD14+ monocyte frequencies did not add further significant independent prognostic information (Table 3, left).
Table 3.
Multivariate Models
| Multivariate analysis of significantly independent factors (n=138) | Multivariate analysis including Tregs (combination model 1) (n=138) | Combination model 2 considering LDH (elevated vs. normal) and blood count parameters* only (n=200) | |||||||
|---|---|---|---|---|---|---|---|---|---|
| Factor | Category | HR | p-value | Category | HR | p-value | Category | HR | p-value |
| LDH-ratio | >2.3 | 4.9 | 0.0156 | >2.3 | 5.2 | 0.0103 | Elevated | 1.9 | 0.0003 |
| >1.2 | 1.8 | 0.0263 | >1.2 | 1.8 | 0.0336 | ||||
| ≤1.2 | 1.0 | ≤1.2 | 1.0 | Normal | 1.0 | ||||
| Relative lymphocyte counts | <10.5% | 2.4 | 0.0110 | <10.5% | 2.6 | 0.0071 | <10.5% | 4.2 | < 0.0001 |
| ≥10.5% | 1.0 | ≥10.5% | 1.0 | ≥10.5% | 1.0 | ||||
| Absolute monocyte counts | ≥650/μL | 2.0 | 0.0171 | ≥650/μL | 2.0 | 0.0218 | ≥650/μL | 2.2 | 0.0001 |
| <650/μL | 1.0 | <650/μL | 1.0 | <650/μL | 1.0 | ||||
| Absolute eosinophil counts | <50/μL | 1.7 | 0.0225 | <50/μL | 1.6 | 0.0285 | <50/μL | 1.7 | 0.003 |
| ≥50/μL | 1.0 | ≥50/μL | 1.0 | ≥50/μL | 1.0 | ||||
| Relative eosinophil counts | <1.5% | Not independent | <1.5% | Not considered | <1.5% | Not independent | |||
| ≥1.5% | ≥1.5% | ≥1.5% | |||||||
| Lin−CD14+HLA-DR−/low MDSCs | ≥9.5% | Not independent | ≥9.5% | Not considered | Not considered | ||||
| ≥5.1% | 2.6 | <0.0001 | ≥5.1% | 2.5 | 0.0001 | ||||
| <5.1% | 1.0 | <5.1% | 1.0 | ||||||
| CD4+CD25+FoxP3+ Tregs | <1.5% | Not independent | <1.5% | 1.8 | 0.1439 | ||||
| ≥1.5% | ≥1.5% | 1.0 | |||||||
| CD14+ monocytes | <28% | Not independent | <28% | Not considered | |||||
| ≥28% | ≥28% | ||||||||
Lactate dehydrogenase (LDH), regulatory T cells (Tregs), myeloid-derived suppressor cells (MDSCs), hazard ratio (HR).
Relative lymphocyte count, absolute monocyte count, absolute and relative eosinophil count
Next, the discriminatory ability of the initial model considering the relative impact of all 5 independent biomarkers in combination and 13 alternative combination models was analyzed using C-statistics. The best discriminatory ability (Supplementary Figure 2A&B) and satisfactory calibration (Supplementary Figure 3A) was achieved when Tregs were likewise considered in addition to LDH (at both cut-off points), MDSCs, RLC, AMC, and AEC in the combination model (c-index=0.712), despite this factor having no significant independent impact according to Cox regression analysis (Table 3, middle). The latter model combining 6 biomarkers (LDH at two cut-off points) including Tregs was selected for further analysis (combination model 1). Classification of patients in this model was based on a linear predictor score (risk score) accounting for the relative impact of each marker in the combination model (Figure 2A).
Figure 2. Overall survival and tumor response according to combination model 1.

A nomogram-based linear predictor measure was calculated for each patient considering the relative impact of single factors according to Cox regression analysis (A). In combination model 1, the LDH-ratio (at two cut-off points), the absolute eosinophil and monocyte counts, the relative lymphocyte count, the frequency of Lin−CD14+HLA-DR−/low myeloid-derived suppressor cells (MDSCs) and CD4+CD25+FoxP3+ regulatory T cells (Tregs) were considered. Kaplan-Meier analysis of overall survival is presented according to the patient´s individual risk score, which was calculated as the sum of the values of 7 separate factors. Censoring is indicated by vertical lines (B). The best overall tumor response according to immune-related response criteria (irRC) was analyzed either as the rate of patients with irRC benefit (sum of those with complete responses, partial responses and stable disease) or irRC response (sum of those with complete or partial responses) (C). * p < 0.05; ** p < 0.01; *** p < 0.001.
The 2-year survival rate for patients with favorable values for all 6 biomarkers (risk-score=0) was 40.8% compared to 17.3% for those with risk scores ≤130. In contrast, none of the patients with risk scores >130 survived longer than 15 months (Figure 2B). Moreover, the rate of clinical responses differed strongly between risk-score groups (Figure 2C). The response rate in patients with risk-scores of 0, ≤130 or >130 was 31%, 31% and 3% (51%, 41% and 6% rate of clinical benefit, respectively) according to irRC.
Definition of a combination model limited to routine markers
Next, we developed a less complex model which allows immediate application in daily clinical practice. Therefore, we focused exclusively on the impact of clinical parameters and factors available in the routine laboratory setting. Factors requiring low cytometry, for example the determination of subpopulations of MDSCs and Tregs, were not considered as this technique is not broadly available and the exact determination of these immune parameters is not yet standardized. In contrast to model 1, we aimed to avoid the need for calculations here. Therefore, the number of favorable factors in combination model 2 was counted instead of calculating the risk score for the individual patient (model 1). Moreover, LDH was categorized as elevated vs. normal, instead of considering the LDH-ratio. According to Cox regression analysis, an RLC <10.5% appeared to be the strongest independent factor (HR 4.2; p<0.0001) followed by an AMC ≥650/μL (HR 2.2; p=0.0001), elevated LDH (HR 1.9; p=0.0003), and a low AEC <50/μL (HR 1.7; p=0.003). The REC did not add independent power (Table 3, right). The count of values classified as favorable for all 4 independent factors was selected as outcome measure of combination model 2. This model was chosen based on the highest discriminatory ability (c-index=0.690; Supplementary Figure 2B) of all possible combination models considering the five routine markers (Supplementary Figure 2C&D) and satisfactory calibration (Supplementary Figure 3B). The 2-year survival probability of patients with favorable profiles for all 4 markers was 43.1% compared to 13.7% for those with one, and 2.5% for those with two or more unfavorable values (p<0.001 for all pairwise comparisons of categories; Figure 3A). Similar to the first model, there was a strong correlation with the bOR (Figure 3B). The response rate in patients with 4, 3 and 2-0 favorable baseline biomarker results was 31%, 18% and 8% (52%, 30% and 12% rate of clinical benefit, respectively) according to irRC.
Figure 3. Overall survival and tumor response according to combination model 2.

In combination model 2, only routine biomarkers, available in daily practice, were considered. In addition to the absolute eosinophil and monocyte counts, the relative lymphocyte counts and LDH (categorized as elevated vs. normal) was integrated. Patients were stratified according to the number of favorable factors for Kaplan-Meier analysis of overall survival. Censoring is indicated by vertical lines (A). The best overall tumor response according to immune-related response criteria (irRC) was analyzed either as the rate of patients with irRC benefit (sum of those with complete responses, partial responses and stable disease) or irRC response (sum of those with complete or partial responses) (B). The association with overall survival of combination model 2 was confirmed in an independent validation cohort of 378 patients with available data for all 4 factors (C). * p < 0.05; ** p < 0.01; *** p < 0.001.
Validation of the combination model limited to routine markers
Finally, the factors considered in combination model 2 were additionally analyzed in an independent cohort of 406 patients treated with ipilimumab. All 4 single baseline factors (LDH elevated vs. normal, RLC < vs. ≥ 10.5%, AMC < vs. ≥ 650/μL, AEC < vs. ≥ 50/μL) were significantly associated with OS in univariate analysis of the validation cohort (all log rank p<0.05). Large differences in OS were again observed according to the number of favorable baseline factors for patients treated with ipilimumab (p<0.001 for all pairwise comparisons of categories 4 vs. 3 vs. 2-0 favorable factors; Figure 3 C) and the c-index was 0.652. The 2-year survival probability of patients with favorable profiles for all 4 markers was 40.2% compared to 22.1% for those with one, and 9.5% for those with two or more unfavorable values.
Correlations with grade III/IV/V adverse events
Adverse events (AE) of grade III or higher were reported for 26 (12.6% of 207 evaluable patients) and immune-related adverse events (irAE) in 23 patients (11.1%). Colitis/diarrhea was most frequently observed (n=11; 5.3%). Less frequent AEs were dermatitis (n=5; 2.4%), hypophysitis and hepatitis (each n=3; 1.4%). The occurrence of nausea, headache/asthenia, neutropenia, orthostatic dysregulation, and the development of Guillain-Barré-Syndrome was noted in one patient, respectively. Severity of all AEs was classified as grade III and no grade IV or V toxicities were reported. The occurrence of AEs was neither correlated with OS since starting ipilimumab, nor with best clinical response, nor with the combination groups of baseline biomarkers (Supplementary Figure 4).
Further characterization of the proposed combination models
Seven patients of the identification and the confirmation cohorts received either 10 mg/kg ipilimumab or were treated at 3 or 10 mg/kg in a blinded manner. As the applied dose may confound the biomarker results, an additional analysis was conducted excluding those patients. All independent factors considered in the models as described in Table 3 had also significant independent impact in the reduced cohort of patients treated at 3 mg/kg ipilimumab (n=202). HRs changed only marginally (Supplementary Table 3).
Moreover, confounding effects of subsequent therapies were analyzed in 71 patients from the identification and confirmation cohorts who had received at least one systemic treatment after ipilimumab. They were treated with BRAF/MEK inhibitors (n=24), PD-1/PD-L1 antibodies (n=28), or chemotherapy/other treatments (n=33). Patients receiving PD-1/PD-L1 antibodies had an exceptionally long OS (Supplementary Figure 5 B), and were overrepresented in the prognostically favorable biomarker groups (Supplementary Figure 5 A). However, the prognostic impact of both biomarker combination models remained significant (p<0.018 or less for all pairwise comparisons of categories of the respective model), if patients treated with PD-1/PD-L1 antibodies were excluded (Supplementary Figure 5 C&D).
Discussion
In the current study, the LDH-ratio, AMC, AEC, RLC and the frequency of MDSCs and Tregs were found to represent baseline peripheral blood biomarkers impacting OS of melanoma patients treated with ipilimumab. The LDH-ratio was a strong baseline biomarker associated with prognosis, as similarly reported by others (10–13). We did not observe differences in OS according to the baseline ALC (11). However, a low AEC correlated with favorable outcome. Similar findings were reported by Schindler et al. at the ASCO meeting 2013 (36) and an increase of eosinophils during ipilimumab was associated with OS in the study of Delyon (12). Our study is the first to report a negative impact of high AMC, consistent with a similar association with the frequency of CD14+ monocytes analyzed by flow cytometry. An association of high AMC with poor prognosis was reported before (37, 38), but baseline counts were not predictive for ipilimumab-treated patients in the study of Kitano et al (10). However, a different cut-off point used to categorize patients (300/μL versus 650/μL in our study) may explain the divergent results. A low baseline frequency of Lin−CD14+HLA-DR−/low MDSCs was a powerful indicator of benefit and was the strongest stand-alone factor of the entire study to indicate long-term survival. Similar results were previously reported from two single-center studies (10, 30) and a recent study of Gebhardt et al (31). The inverse correlation of MDSC frequencies and OS following ipilimumab and the prognostic relevance for melanoma patients with distant metastasis in general (29) provides a rationale to pursue therapeutic strategies aiming at depleting these cells. Blockade of the suppressive function of MDSCs using cyclooxygenase-2 (COX-2)/prostaglandin E2 pathway inhibitors (39, 40) or phosphodiesterase-inhibitors (41) represents other possible approaches, which may be tested as monotherapies or in combination with ipilimumab.
Interestingly, higher baseline frequencies of circulating CD4+CD25+FoxP3+ Tregs were associated with improved OS. Tregs represent direct target cells of ipilimumab due to their constitutive CTLA-4-expression. Therefore, a high baseline frequency might render patients more susceptible to anti-CTLA-4 antibodies. This hypothesis is strongly supported by the observed correlation between decreasing levels of circulating Tregs during ipilimumab and favorable outcome (9). However, conflicting results have also been reported (42).
The T cell response, which is crucial for immunological melanoma rejection in patients treated with ipilimumab (16, 17, 19, 20), is balanced by interactions between T cells and regulatory cells (28). All five cellular compartments which we found to associate with outcome upon ipilimumab treatment (eosinophils, lymphocytes, monocytes, Tregs and MDSCs), are involved in this complex regulatory network. For instance, eosinophils have important functions for tumor surveillance and were described as potent effectors for tumor rejection in mouse models (43–45). MDSCs and Tregs have been shown to exert suppressive function on T cells, thereby possibly counteracting the beneficial effect of ipilimumab (28, 46).
We propose a combination model for outcome of ipilimumab treatment defined by six baseline biomarkers. Based on the LDH-ratio, the AMC and AEC, the RLC and the frequency of MDSCs and Tregs, patients were classified into three groups with clinically meaningful differences in survival and response rate. Additionally, we propose a biomarker signature that could be easily implemented in routine clinical settings. This simplified classification based on LDH, AMC and AEC, and RLC allowed identification of 27% of all patients with a median survival of three months, no survivors beyond 2 years, and a response rate of only 8%. In contrast, this combination model also identified 35% of all patients presenting favorable values for all four biomarkers with a 35% probability of surviving longer than three years and response rates of ~30%. In cases where several treatment options may be available for the individual patient, these findings may impact treatment selection and sequence. Of note, based on the discriminatory abilities, both models were superior for prognosis prediction than considering LDH alone. The respective c-indices were 0.712 and 0.690 for combination models 1 and 2, in contrast to 0.617 for the LDH-ratio categorized as >2.3 vs. >1.2 vs. ≤1.2, or 0.598 if LDH was categorized as elevated vs. normal in the combined identification and confirmation cohorts.
Importantly, in this study we followed REMARK recommendations (47) and confirmed the association between ten variable/cut-off combinations and OS in a confirmation cohort. Altogether, 209 patients from eight clinical sites and six different countries were included, minimizing the risk that our results are confounded by patient selection, regional- or site-specific influences. Nevertheless, there are limitations to our study which need to be considered. Other factors, for example the Eastern Cooperative Oncology Group (ECOG) performance status or prior treatments, for example with BRAF/MEK inhibitors, may impact outcome following ipilimumab or the biomarker results, which were not analyzed in detail, here. The results of factors analyzed by flow cytometry may be confounded by varying site-specific protocols for isolation, freezing, or storage of PBMC and might not reflect the actual immune milieu in vivo, for example due to differences in susceptibility to cryopreservation between immune cell populations (48). We were able to validate the prognostic relevance of the combination model limited to routine factors in an additional independent cohort of 406 patients. The number of favorable factors (4 vs. 3 vs. 2-0) according to this model again was strongly associated with OS (p<0.001 for all pairwise comparisons) in patients of the validation cohort although the discriminatory ability was lower than in the main study (c-indices 0.652 vs. 0.690). Thus, further validation is warranted. This is particularly important because patients analyzed here were heterogeneous regarding the treatment background. Patients were treated either after marketing approval, in the compassionate use program or in different clinical trials. Site-specific treatment procedures and patient selection guidelines or the inclusion/exclusion criteria in the clinical trials may led to a selection bias and confounding effects on the biomarker results. The question whether the suggested signatures are prognostic in general or specifically predictive for outcome after ipilimumab, cannot be answered by our study. This key question needs to be addressed in future studies including patients in other clinical situations; e.g. tumor-free individuals in earlier stages after surgery, or prior to other treatments; e.g. with PD-1 antibodies or in the context of randomized controlled clinical trials.
Early clinical studies reported a correlation between the occurrence of autoimmunity after ipilimumab and favorable clinical outcome (7, 8). In contrast, this correlation was neither observed in the current study, nor in recent investigations of large patient cohorts treated within early access programs (12, 49). Biomarkers predictive for severe autoimmunity are warranted as they might improve the individual risk/benefit assessment. An early increase of AEC was recently reported to correlate with the occurrence of irAEs (50) but no such property was observed for the biomarker signatures described here.
In conclusion, a baseline signature of low values of LDH, AMC and MDSCs as well as high AEC, Tregs and RLC in the peripheral blood is associated with favorable outcome of late-stage melanoma patients treated with ipilimumab. Investigation of the predictive impact of these biomarkers following ipilimumab and other treatments; e.g. PD-1 antibodies, is warranted.
Supplementary Material
Statement of translational relevance.
We report a prognostic combination model for melanoma patients treated with ipilimumab considering 6 baseline peripheral blood biomarkers. The spectrum comprised LDH as well as five immune cell populations including CD14+HLA-DR−/low-MDSCs, and CD4+CD25+FoxP3+-Tregs. The observed negative impact of high MDSC frequencies translates into a strong rationale to investigate therapeutic strategies to deplete or inhibit these cells.
Due to the complexity of flow cytometry, required for analysis of MDSCs and Tregs, we additionally defined a model limited to generally available routine markers. The resulting prognostic classification considering LDH, absolute monocyte and eosinophil counts and relative lymphocyte counts delineates groups of patients with large differences in outcome. Our findings improve patient counselling and provide a rationale to investigate the predictive impact of these markers and the proposed combination in future studies not only for outcome after treatment with ipilimumab, but also at baseline for other treatments such as using PD-1 antibodies.
Acknowledgments
We thank Carsten Schulz (Heidelberg, Germany) and Laura Milsch (Essen, Germany) for their help in data collection.
Financial Support:
Parts of this study were funded by Bristol-Myers-Squibb (Munich, Germany).
Parts of this study were funded by the EU Seventh Framework Program “PRIAT” (Profiling Responders In Antibody Therapies), grant agreement no 305309 and DFG PA 361-22/1 (to GP).
T.K Eigentler reports receiving honoraria from BMS, travel/accommodations/expenses from Bristol-Myers Squibb and is a consultant/advisory board member for BMS. M. Maio reports receiving honoraria from BMS and Roche, reports receiving a commercial research grant from BMS, travel/accommodations/expenses from BMS, Roche and MSD and is a consultant/advisory board member for BMS and Roche. D. Schadendorf reports receiving honoraria from GSK, Roche, BMS, Amgen, Novartis, MSD, speakers bureau honoraria from GSK, Roche, BMS, Amgen, Novartis, MSD, reports receiving a commercial research grant from MSD, travel/accommodations/expenses from GSK, Roche, BMS, Amgen, Novartis, MSD and is a consultant/advisory board member for GSK, Roche, BMS, Amgen, Novartis, MSD. J.C. Hassel reports receiving honoraria from BMS, MSD, Roche, GSK, Novartis, Amgen. C. Blank reports receiving honoraria from BMS, MSD, GSK, Roche, Novartis, and a commercial research grant from Novartis. J. D. Wolchok reports receiving a commercial research grant from BMS, MSD. M. A. Postow reports receiving honoraria from BMS and a commercial research grant from BMS. J. Yuan reports receiving a commercial research grant from BMS. B. Schilling reports receiving a commercial research grant from BMS and travel/accommodations/expenses from BMS. C. Garbe reports receiving honoraria from BMS, MSD, Amgen, Novartis, Roche, GSK, reports receiving a commercial research grant from MSD, BMS, Roche, GSK. B. Weide reports receiving a commercial research grant from BMS, reports receiving travel/accommodations/expenses from BMS, MSD, Roche, Philogen, Curevac and is a consultant/advisory board member for BMS, Philogen, Curevac.
A.M Di Giacomo reports receiving honoraria from BMS, receiving travel/accommodations/expenses from BMS, Roche. E. Romano reports receiving travel/accommodations/expenses from BMS. P. A. Ascierto reports receiving honoraria from BMS, Roche, GSK, commercial research grant from BMS, Roche, Ventana, and is a consultant/advisory board member for BMS, Roche, MSD, Ventana, GSK, Novartis, Amgen.
A. Khammari reports receiving travel/accommodations/expenses from BMS and Roche.
Footnotes
Conflicts of Interests:
No potential conflicts of interest were disclosed by the other authors
References
- 1.Robert C, Thomas L, Bondarenko I, O’Day S, M DJ, Garbe C, et al. Ipilimumab plus dacarbazine for previously untreated metastatic melanoma. N Engl J Med. 2011;364:2517–26. doi: 10.1056/NEJMoa1104621. [DOI] [PubMed] [Google Scholar]
- 2.Hodi FS, O’Day SJ, McDermott DF, Weber RW, Sosman JA, Haanen JB, et al. Improved survival with ipilimumab in patients with metastatic melanoma. N Engl J Med. 2010;363:711–23. doi: 10.1056/NEJMoa1003466. [DOI] [PMC free article] [PubMed] [Google Scholar]
- 3.Schadendorf D, Hodi FS, Robert C, Weber JS, Margolin K, Hamid O, et al. Pooled Analysis of Long-Term Survival Data From Phase II and Phase III Trials of Ipilimumab in Unresectable or Metastatic Melanoma. J Clin Oncol. 2015 doi: 10.1200/JCO.2014.56.2736. [DOI] [PMC free article] [PubMed] [Google Scholar]
- 4.Robert C, Karaszewska B, Schachter J, Rutkowski P, Mackiewicz A, Stroiakovski D, et al. Improved overall survival in melanoma with combined dabrafenib and trametinib. N Engl J Med. 2015;372:30–9. doi: 10.1056/NEJMoa1412690. [DOI] [PubMed] [Google Scholar]
- 5.Robert C, Ribas A, Wolchok JD, Hodi FS, Hamid O, Kefford R, et al. Anti-programmed-death-receptor-1 treatment with pembrolizumab in ipilimumab-refractory advanced melanoma: a randomised dose-comparison cohort of a phase 1 trial. Lancet. 2014;384:1109–17. doi: 10.1016/S0140-6736(14)60958-2. [DOI] [PubMed] [Google Scholar]
- 6.Ascierto PA, Kalos M, Schaer DA, Callahan MK, Wolchok JD. Biomarkers for immunostimulatory monoclonal antibodies in combination strategies for melanoma and other tumor types. Clin Cancer Res. 2013;19:1009–20. doi: 10.1158/1078-0432.CCR-12-2982. [DOI] [PubMed] [Google Scholar]
- 7.Attia P, Phan GQ, Maker AV, Robinson MR, Quezado MM, Yang JC, et al. Autoimmunity correlates with tumor regression in patients with metastatic melanoma treated with anti-cytotoxic T-lymphocyte antigen-4. J Clin Oncol. 2005;23:6043–53. doi: 10.1200/JCO.2005.06.205. [DOI] [PMC free article] [PubMed] [Google Scholar]
- 8.Downey SG, Klapper JA, Smith FO, Yang JC, Sherry RM, Royal RE, et al. Prognostic factors related to clinical response in patients with metastatic melanoma treated by CTL-associated antigen-4 blockade. Clin Cancer Res. 2007;13:6681–8. doi: 10.1158/1078-0432.CCR-07-0187. [DOI] [PMC free article] [PubMed] [Google Scholar]
- 9.Simeone E, Gentilcore G, Giannarelli D, Grimaldi AM, Caraco C, Curvietto M, et al. Immunological and biological changes during ipilimumab treatment and their potential correlation with clinical response and survival in patients with advanced melanoma. Cancer Immunol Immunother. 2014;63:675–83. doi: 10.1007/s00262-014-1545-8. [DOI] [PMC free article] [PubMed] [Google Scholar]
- 10.Kitano S, Postow MA, Ziegler CG, Kuk D, Panageas KS, Cortez C, et al. Computational algorithm-driven evaluation of monocytic myeloid-derived suppressor cell frequency for prediction of clinical outcomes. Cancer Immunol Res. 2014;2:812–21. doi: 10.1158/2326-6066.CIR-14-0013. [DOI] [PMC free article] [PubMed] [Google Scholar]
- 11.Kelderman S, Heemskerk B, van Tinteren H, van den Brom RR, Hospers GA, van den Eertwegh AJ, et al. Lactate dehydrogenase as a selection criterion for ipilimumab treatment in metastatic melanoma. Cancer Immunol Immunother. 2014;63:449–58. doi: 10.1007/s00262-014-1528-9. [DOI] [PMC free article] [PubMed] [Google Scholar]
- 12.Delyon J, Mateus C, Lefeuvre D, Lanoy E, Zitvogel L, Chaput N, et al. Experience in daily practice with ipilimumab for the treatment of patients with metastatic melanoma: an early increase in lymphocyte and eosinophil counts is associated with improved survival. Ann Oncol. 2013;24:1697–703. doi: 10.1093/annonc/mdt027. [DOI] [PubMed] [Google Scholar]
- 13.Di Giacomo AM, Danielli R, Calabro L, Bertocci E, Nannicini C, Giannarelli D, et al. Ipilimumab experience in heavily pretreated patients with melanoma in an expanded access program at the University Hospital of Siena (Italy) Cancer Immunol Immunother. 2011;60:467–77. doi: 10.1007/s00262-010-0958-2. [DOI] [PMC free article] [PubMed] [Google Scholar]
- 14.Hannani D, Vetizou M, Enot D, Rusakiewicz S, Chaput N, Klatzmann D, et al. Anticancer immunotherapy by CTLA-4 blockade: obligatory contribution of IL-2 receptors and negative prognostic impact of soluble CD25. Cell Res. 2015;25:208–24. doi: 10.1038/cr.2015.3. [DOI] [PMC free article] [PubMed] [Google Scholar]
- 15.Braumuller H, Wieder T, Brenner E, Assmann S, Hahn M, Alkhaled M, et al. T-helper-1-cell cytokines drive cancer into senescence. Nature. 2013;494:361–5. doi: 10.1038/nature11824. [DOI] [PubMed] [Google Scholar]
- 16.Kvistborg P, Shu CJ, Heemskerk B, Fankhauser M, Thrue CA, Toebes M, et al. TIL therapy broadens the tumor-reactive CD8(+) T cell compartment in melanoma patients. Oncoimmunology. 2012;1:409–18. doi: 10.4161/onci.18851. [DOI] [PMC free article] [PubMed] [Google Scholar]
- 17.Yuan J, Adamow M, Ginsberg BA, Rasalan TS, Ritter E, Gallardo HF, et al. Integrated NY-ESO-1 antibody and CD8+ T-cell responses correlate with clinical benefit in advanced melanoma patients treated with ipilimumab. Proc Natl Acad Sci U S A. 2011;108:16723–8. doi: 10.1073/pnas.1110814108. [DOI] [PMC free article] [PubMed] [Google Scholar]
- 18.Weide B, Zelba H, Derhovanessian E, Pflugfelder A, Eigentler TK, Di Giacomo AM, et al. Functional T cells targeting NY-ESO-1 or Melan-A are predictive for survival of patients with distant melanoma metastasis. J Clin Oncol. 2012;30:1835–41. doi: 10.1200/JCO.2011.40.2271. [DOI] [PubMed] [Google Scholar]
- 19.Snyder A, Makarov V, Merghoub T, Yuan J, Zaretsky JM, Desrichard A, et al. Genetic basis for clinical response to CTLA-4 blockade in melanoma. N Engl J Med. 2014;371:2189–99. doi: 10.1056/NEJMoa1406498. [DOI] [PMC free article] [PubMed] [Google Scholar]
- 20.van Rooij N, van Buuren MM, Philips D, Velds A, Toebes M, Heemskerk B, et al. Tumor exome analysis reveals neoantigen-specific T-cell reactivity in an ipilimumab-responsive melanoma. J Clin Oncol. 2013;31:e439–42. doi: 10.1200/JCO.2012.47.7521. [DOI] [PMC free article] [PubMed] [Google Scholar]
- 21.Topalian SL, Hodi FS, Brahmer JR, Gettinger SN, Smith DC, McDermott DF, et al. Safety, activity, and immune correlates of anti-PD-1 antibody in cancer. N Engl J Med. 2012;366:2443–54. doi: 10.1056/NEJMoa1200690. [DOI] [PMC free article] [PubMed] [Google Scholar]
- 22.Brahmer JR, Tykodi SS, Chow LQ, Hwu WJ, Topalian SL, Hwu P, et al. Safety and activity of anti-PD-L1 antibody in patients with advanced cancer. N Engl J Med. 2012;366:2455–65. doi: 10.1056/NEJMoa1200694. [DOI] [PMC free article] [PubMed] [Google Scholar]
- 23.Wilgenhof S, Du Four S, Vandenbroucke F, Everaert H, Salmon I, Lienard D, et al. Single-center experience with ipilimumab in an expanded access program for patients with pretreated advanced melanoma. J Immunother. 2013;36:215–22. doi: 10.1097/CJI.0b013e31828eed39. [DOI] [PubMed] [Google Scholar]
- 24.Ku GY, Yuan J, Page DB, Schroeder SE, Panageas KS, Carvajal RD, et al. Single-institution experience with ipilimumab in advanced melanoma patients in the compassionate use setting: lymphocyte count after 2 doses correlates with survival. Cancer. 2010;116:1767–75. doi: 10.1002/cncr.24951. [DOI] [PMC free article] [PubMed] [Google Scholar]
- 25.Valpione S, Martinoli C, Fava P, Mocellin S, Campana LG, Quaglino P, et al. Personalised medicine: Development and external validation of a prognostic model for metastatic melanoma patients treated with ipilimumab. Eur J Cancer. 2015;51:2086–94. doi: 10.1016/j.ejca.2015.06.130. [DOI] [PubMed] [Google Scholar]
- 26.Ferrucci PF, Gandini S, Battaglia A, Alfieri S, Di Giacomo AM, Giannarelli D, et al. Baseline neutrophil-to-lymphocyte ratio is associated with outcome of ipilimumab-treated metastatic melanoma patients. Br J Cancer. 2015;112:1904–10. doi: 10.1038/bjc.2015.180. [DOI] [PMC free article] [PubMed] [Google Scholar]
- 27.Wang W, Yu D, Sarnaik AA, Yu B, Hall M, Morelli D, et al. Biomarkers on melanoma patient T cells associated with ipilimumab treatment. J Transl Med. 2012;10:146. doi: 10.1186/1479-5876-10-146. [DOI] [PMC free article] [PubMed] [Google Scholar]
- 28.Gabrilovich DI, Ostrand-Rosenberg S, Bronte V. Coordinated regulation of myeloid cells by tumours. Nat Rev Immunol. 2012;12:253–68. doi: 10.1038/nri3175. [DOI] [PMC free article] [PubMed] [Google Scholar]
- 29.Weide B, Martens A, Zelba H, Stutz C, Derhovanessian E, Di Giacomo AM, et al. Myeloid-derived suppressor cells predict survival of patients with advanced melanoma: comparison with regulatory T cells and NY-ESO-1- or melan-A-specific T cells. Clin Cancer Res. 2014;20:1601–9. doi: 10.1158/1078-0432.CCR-13-2508. [DOI] [PubMed] [Google Scholar]
- 30.Meyer C, Cagnon L, Costa-Nunes CM, Baumgaertner P, Montandon N, Leyvraz L, et al. Frequencies of circulating MDSC correlate with clinical outcome of melanoma patients treated with ipilimumab. Cancer Immunol Immunother. 2014;63:247–57. doi: 10.1007/s00262-013-1508-5. [DOI] [PMC free article] [PubMed] [Google Scholar]
- 31.Gebhardt C, Sevko A, Jiang H, Lichtenberger R, Reith M, Tarnanidis K, et al. Myeloid Cells and Related Chronic Inflammatory Factors as Novel Predictive Markers in Melanoma Treatment with Ipilimumab. Clin Cancer Res. 2015 doi: 10.1158/1078-0432.CCR-15-0676. [DOI] [PubMed] [Google Scholar]
- 32.Balch CM, Gershenwald JE, Soong SJ, Thompson JF, Atkins MB, Byrd DR, et al. Final version of 2009 AJCC melanoma staging and classification. J Clin Oncol. 2009;27:6199–206. doi: 10.1200/JCO.2009.23.4799. [DOI] [PMC free article] [PubMed] [Google Scholar]
- 33.Camp RL, Dolled-Filhart M, Rimm DL. X-tile: a new bio-informatics tool for biomarker assessment and outcome-based cut-point optimization. Clin Cancer Res. 2004;10:7252–9. doi: 10.1158/1078-0432.CCR-04-0713. [DOI] [PubMed] [Google Scholar]
- 34.Wolchok JD, Hoos A, O’Day S, Weber JS, Hamid O, Lebbe C, et al. Guidelines for the evaluation of immune therapy activity in solid tumors: immune-related response criteria. ClinCancer Res. 2009;15:7412–20. doi: 10.1158/1078-0432.CCR-09-1624. [DOI] [PubMed] [Google Scholar]
- 35.Harrell FE, Jr, Lee KL, Mark DB. Multivariable prognostic models: issues in developing models, evaluating assumptions and adequacy, and measuring and reducing errors. Stat Med. 1996;15:361–87. doi: 10.1002/(SICI)1097-0258(19960229)15:4<361::AID-SIM168>3.0.CO;2-4. [DOI] [PubMed] [Google Scholar]
- 36.Schindler K, Harmankaya K, Postow MA, Frantal S, Bello D, Ariyan CE, et al. Pretreatment levels of absolute and relative eosinophil count to improve overall survival (OS) in patients with metastatic melanoma under treatment with ipilimumab, an anti CTLA-4 antibody. ASCO Meeting Abstracts. 2013;31:9024. [Google Scholar]
- 37.Schmidt H, Bastholt L, Geertsen P, Christensen IJ, Larsen S, Gehl J, et al. Elevated neutrophil and monocyte counts in peripheral blood are associated with poor survival in patients with metastatic melanoma: a prognostic model. Br J Cancer. 2005;93:273–8. doi: 10.1038/sj.bjc.6602702. [DOI] [PMC free article] [PubMed] [Google Scholar]
- 38.Rochet NM, Kottschade LA, Grotz TE, Porrata LF, Markovic SN. The Prognostic Role of the Preoperative Absolute Lymphocyte Count and Absolute Monocyte Count in Patients With Resected Advanced Melanoma. Am J Clin Oncol. 2013 doi: 10.1097/COC.0b013e31829b5605. [DOI] [PMC free article] [PubMed] [Google Scholar]
- 39.Mao Y, Poschke I, Wennerberg E, Pico de Coana Y, Egyhazi Brage S, Schultz I, et al. Melanoma-educated CD14+ cells acquire a myeloid-derived suppressor cell phenotype through COX-2-dependent mechanisms. Cancer Res. 2013;73:3877–87. doi: 10.1158/0008-5472.CAN-12-4115. [DOI] [PubMed] [Google Scholar]
- 40.Veltman JD, Lambers ME, van Nimwegen M, Hendriks RW, Hoogsteden HC, Aerts JG, et al. COX-2 inhibition improves immunotherapy and is associated with decreased numbers of myeloid-derived suppressor cells in mesothelioma. Celecoxib influences MDSC function. BMC Cancer. 2010;10:464–464. doi: 10.1186/1471-2407-10-464. [DOI] [PMC free article] [PubMed] [Google Scholar]
- 41.Serafini P, Meckel K, Kelso M, Noonan K, Califano J, Koch W, et al. Phosphodiesterase-5 inhibition augments endogenous antitumor immunity by reducing myeloid-derived suppressor cell function. J Exp Med. 2006;203:2691–702. doi: 10.1084/jem.20061104. [DOI] [PMC free article] [PubMed] [Google Scholar]
- 42.Tarhini AA, Edington H, Butterfield LH, Lin Y, Shuai Y, Tawbi H, et al. Immune monitoring of the circulation and the tumor microenvironment in patients with regionally advanced melanoma receiving neoadjuvant ipilimumab. PLoS One. 2014;9:e87705. doi: 10.1371/journal.pone.0087705. [DOI] [PMC free article] [PubMed] [Google Scholar]
- 43.Simson L, Ellyard JI, Dent LA, Matthaei KI, Rothenberg ME, Foster PS, et al. Regulation of carcinogenesis by IL-5 and CCL11: a potential role for eosinophils in tumor immune surveillance. J Immunol. 2007;178:4222–9. doi: 10.4049/jimmunol.178.7.4222. [DOI] [PubMed] [Google Scholar]
- 44.Ikutani M, Yanagibashi T, Ogasawara M, Tsuneyama K, Yamamoto S, Hattori Y, et al. Identification of innate IL-5-producing cells and their role in lung eosinophil regulation and antitumor immunity. J Immunol. 2012;188:703–13. doi: 10.4049/jimmunol.1101270. [DOI] [PubMed] [Google Scholar]
- 45.Carretero R, Sektioglu IM, Garbi N, Salgado OC, Beckhove P, Hammerling GJ. Eosinophils orchestrate cancer rejection by normalizing tumor vessels and enhancing infiltration of CD8(+) T cells. Nat Immunol. 2015;16:609–17. doi: 10.1038/ni.3159. [DOI] [PubMed] [Google Scholar]
- 46.Gabrilovich DI, Nagaraj S. Myeloid-derived suppressor cells as regulators of the immune system. Nat Rev Immunol. 2009;9:162–74. doi: 10.1038/nri2506. [DOI] [PMC free article] [PubMed] [Google Scholar]
- 47.Altman DG, McShane LM, Sauerbrei W, Taube SE. Reporting Recommendations for Tumor Marker Prognostic Studies (REMARK): explanation and elaboration. PLoS Med. 2012;9:e1001216. doi: 10.1371/journal.pmed.1001216. [DOI] [PMC free article] [PubMed] [Google Scholar]
- 48.Kotsakis A, Harasymczuk M, Schilling B, Georgoulias V, Argiris A, Whiteside TL. Myeloid-derived suppressor cell measurements in fresh and cryopreserved blood samples. J Immunol Methods. 2012;381:14–22. doi: 10.1016/j.jim.2012.04.004. [DOI] [PMC free article] [PubMed] [Google Scholar]
- 49.Ascierto PA, Simeone E, Sileni VC, Pigozzo J, Maio M, Altomonte M, et al. Clinical experience with ipilimumab 3 mg/kg: real-world efficacy and safety data from an expanded access programme cohort. J Transl Med. 2014;12:116. doi: 10.1186/1479-5876-12-116. [DOI] [PMC free article] [PubMed] [Google Scholar]
- 50.Schindler K, Harmankaya K, Kuk D, Mangana J, Michielin O, Hoeller C, et al. Correlation of absolute and relative eosinophil counts with immune-related adverse events in melanoma patients treated with ipilimumab. ASCO Meeting Abstracts. 2014;32:9096. [Google Scholar]
Associated Data
This section collects any data citations, data availability statements, or supplementary materials included in this article.