

Abstract
Increased variability of spatio-temporal features while walking is related to increased risk of falls. It is thought that variability in foot placement and timing reflects responses to mechanical instability while walking. The purpose of this study was to determine whether ‘extreme’ values of step length, width and time follow transient periods of low mechanical stability during the single support phase of gait in healthy young adults. We conducted secondary analysis of a portion of an existing dataset. Eleven healthy adults walked on an instrumented treadmill. Participants were outfitted with reflective markers and completed two 1-minute periods of walking at each of 3 speeds (0.8 m/s, 1.2 m/s, and 1.6 m/s). Margins of stability were calculated relative to the anterior, posterior, lateral, and medial boundaries of the base of support, and the value at heel strike and the minimum value during the first half of each single-support phase were extracted. Step length, swing time, and step width were calculated from motion capture and ground reaction force data. Extreme values for consecutive steps were identified using Poincaré plots, and margins of stability in each direction were compared between ‘normal’ and ‘extreme’ steps. Margins of stability in both the anterior and medial direction were lower prior to long and wide steps, respectively. Margins of stability in the anterior and medial directions were lower prior to quick steps, and margins of stability in the posterior and lateral directions were lower prior to slow steps. There were either no significant differences in margin of stability between ‘normal’ and ‘extreme’ steps at heel strike, or the direction of the relationship was reversed to that observed during single support. These data suggest that spatio-temporal variability may reflect adjustments in step placement and timing to compensate for transient periods of low mechanical stability when walking.
Keywords: Gait, Accidental Falls, Kinematics, Motor Control
1. INTRODUCTION
One in three seniors fall annually, with significant consequences such as injury, fear of falling, and increased risk of admission to long-term care (Overstall, 2004). Most falls occur when walking (Berg, Alessio, Mills, & Tong, 1997). Changes in gait patterns are associated with aging and fall risk. Increased stride-to-stride variability in spatio-temporal features of walking is related to increased fall risk in daily life (Callisaya et al., 2011; Hausdorff, Rios, & Edelberg, 2001; Maki, 1997). Gait variability in older adults may result from age-related physiologic changes, such as neurodegeneration, decreased range-of-motion, pain, and skeletal muscle deconditioning (Callisaya, Blizzard, Schmidt, McGinley, & Srikanth, 2010; Hausdorff, 2005; Kang & Dingwell, 2008; Tian et al., 2017). Variability may also reflect repeated adjustments in step placement and timing to correct for periods of low mechanical stability when walking (Callisaya et al., 2010; Hak et al., 2012).
Mechanical stability is defined by the relationship between the state of centre of mass (COM) and base of support (BOS; Pai & Patton, 1997). ‘Margin of stability’ (MOS) has been proposed (Hof, Gazendam, & Sinke, 2005) to quantify mechanical stability during dynamic tasks such as walking (Hof, 2008). MOS is defined as the distance between the BOS and the extrapolated COM, with the extrapolated COM accounting for both COM position and velocity. MOS quantifies how close an inverted pendulum is to falling, and indicates when a control strategy (e.g., taking a step or executing a reach-to-grasp reaction) may be needed to prevent a fall (Bruijn, Meijer, Beek, & van Dieën, 2013). Generally, if the extrapolated COM is within the BOS boundary, the individual is mechanically stable, whereas an extrapolated COM outside the BOS suggests instability. During walking, corrective action to low mechanical stability may include adjusting step length, width, or time. For example, swing duration is shortened following an external pelvic perturbation in either the anterior or lateral directions during walking (Vlutters, van Asseldonk, & van der Kooij, 2016).
Although spatio-temporal gait variability and MOS have been studied independently as measures of balance control during gait, few studies have investigated the relationship between these measures. Previous studies have examined changes in step placement and timing following external perturbations to gait (Hak et al., 2012; Vlutters et al., 2016); however, step placement and timing is variable even in the absence of an apparent external perturbation. The extent to which ‘internal’ perturbations, or transient bouts of low mechanical stability, during normal walking contribute to altered step placement and timing is unknown. It is possible that low, yet positive, values of MOS are sufficient to evoke changes in step placement and timing to preserve mechanical stability in walking. As an initial step towards examining the relationship between mechanical stability, gait variability, and fall risk in older adults, the purpose of the current study was to determine whether ‘extreme’ values of step length, width, or time follow periods of low mechanical stability during the single support phase among healthy young adults. From previous work of external perturbations to gait (Vlutters et al., 2016), we hypothesized that: a) anterior and posterior MOS would be decreased prior to long and short steps, respectively; b) medial and lateral MOS would be decreased prior to wide and narrow steps, respectively; c) anterior and medial MOS would be decreased prior to quick steps; and d) posterior and lateral MOS would be decreased prior to slow steps. Adjustments in step placement and timing should preserve mechanical stability (McAndrew Young & Dingwell, 2012). Therefore, we also aimed to determine the effect of altered step placement and timing on mechanical stability at heel strike. We hypothesized that there would be no differences in MOS at heel strike between short/long and normal steps, between narrow/wide and normal steps, or between quick/slow and normal steps.
2. METHODS
This study involved secondary analysis of a portion of an existing publically-available dataset (J. Moore, Hnat, & van de Bogert, 2014; J. K. Moore, Hnat, & van den Bogert, 2015). Data collection methods are summarized below, with full details in the original paper (J. K. Moore et al., 2015).
2.1 Participants
The dataset from (J. K. Moore et al., 2015) consisted of data from 15 young adults with no neurological or musculoskeletal conditions that limited mobility. Only 11 individuals were included in the present analysis; the first three individuals were tested using a slightly different protocol, and there were problems detecting gait events for another participant (see Data Processing section). Included participants were three women and eight men, with mean (standard deviation) age, height, and weight of 24 (4.4) years, 1.73 (0.1) m, and 73.1 (10.9) kg, respectively.
2.2 Procedures
Participants were instrumented with 47 reflective markers positioned over anatomical landmarks on the head, arms, trunk, pelvis, legs, and feet. Participants’ knee- and ankle widths were measured and recorded. A 10-camera Osprey motion capture system with Cortex software was used to measure marker movement (100 Hz sampling rate; Motion Analysis, Santa Rosa, California, USA). Participants walked on an R-Mill treadmill (Forcelink, Culemborg, Netherlands) with one built-in 6-degree-of-freedom force plate under each foot; force plate data were sampled at 100 Hz. Participants wore a safety harness during all trials, which likely had no influence on characteristics of walking (Stout, Wittstein, LoJacono, & Rhea, 2016). A calibration pose was initially completed. Participants then completed 10-minute walks at each of three predetermined speeds (0.8 m/s, 1.2 m/s, 1.6 m/s). Each 10-minute walk consisted of 1 minute of unperturbed walking, 8 minutes of perturbed walking (pseudo-random fluctuations in the speed of the treadmill belt, such that perturbations were in the antero-posterior direction), and another minute of unperturbed walking (Figure 1). A rest break was provided before the next speed.
Figure 1.
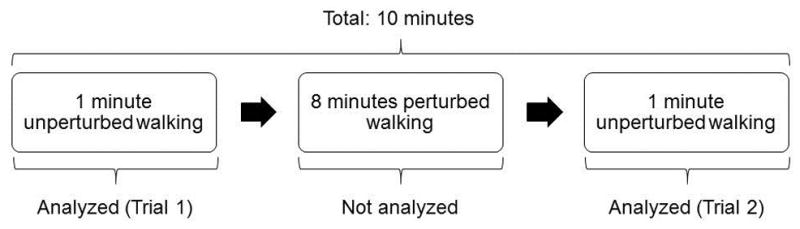
Breakdown of each 10 minute period of walking. The two 1 minute walking periods at either end of the collection were analyzed for the present study, while the perturbed walking period in the middle was not analyzed. The 10 minute period was repeated at each of three walking speeds (0.8 m/s, 1.2 m/s, and 1.6 m/s). Each of the 1 minute walking periods at each walking speed was considered as a separate trial, resulting in two trials for each walking speed (total of six trials). Data were collected and made publicly available by Moore et al. (2015).
2.3 Data processing
Motion capture and force plate data were filtered in Matlab v.R2014a (The Mathworks, Natick, Massachusetts, USA) using dual-pass, 2nd order, low-pass Butterworth filters with cut-off frequencies of 6 Hz and 10 Hz (Winter, 2005), respectively. For the purpose of the current study, only unperturbed portions of each walk were included in the analysis (Figure 1). For each participant, the two 1-minute periods of unperturbed walking at each speed (one before, one after the perturbed walking) were considered separate trials. Therefore, each participant completed up to six trials for analysis – one before, one after the perturbed walking, at each of three speeds.
The toolbox provided by Moore et al (2014) was used to obtain heel strike and toe-off events in Python (version 2.7.9, Python Software Foundation, Beaverton, Oregon, USA). The toolbox identified heel strike and toe-off based on vertical ground reaction forces (>20 N for heel strike and <5 N for toe-off). Gait events could not be detected for 14 trials, which was resolved for six trials by increasing the toe-off detection threshold to 20 N. Gait events for the remaining eight trials were still undetectable; therefore, these trials were excluded from further analysis. Four of the eight trials were from one participant, so this participant was excluded entirely from analysis, leaving 11 participants in the final analysis.
Further processing was performed with a custom routine implemented in Matlab (version R2014a, The Mathworks, Inc., Natick, Massachusetts, USA). Steps taken while the treadmill was accelerating and decelerating (treadmill speed less than the target speed minus 0.02 m/s) were removed from analysis. Additionally, the first and last two steps of constant velocity walking were removed from each trial to ensure that participants had fully adapted to the target treadmill speed. Step length and width were calculated as the antero-posterior and medio-lateral distances between the heel markers at heel strike, respectively. Swing time was defined as the duration between toe-off and heel strike of the swing leg. Whole-body COM was calculated using a 14-segment model (i.e., head, trunk, upper arm, forearm, hand, thigh, shank, foot) based on marker and anthropometric data (de Leva, 1996). The extrapolated COM (XCOM) was calculated using Equation 1 (Hof et al., 2005):
| (1) |
where PCOM was the horizontal position of the COM, VCOM was the horizontal velocity of the COM (calculated by differentiating PCOM), g was the gravity constant (9.81 m/s2), and l was participant leg length multiplied by 1.2 (Hof et al., 2005). Leg length was calculated as the vertical distance between the greater trochanter and the lateral malleolus during the calibration trial (i.e., standing posture).
The XCOM was used to calculate the MOS using Equation 2 (Hof et al., 2005):
| (2) |
where BOS was the boundary of the base of support. The BOS was defined by four borders (anterior, posterior, medial, and lateral). The anterior, posterior, and lateral BOS borders were defined by the toe, heel, and lateral malleolus markers, respectively; the medial BOS border was defined as the estimated medial edge of the foot based on the position of the 5th metatarsal marker and the foot width, which was determined by multiplying participant height by 0.055 (Winter, 2005). The anterior (MOSA), posterior (MOSP), medial (MOSM), and lateral (MOSL) margins of stability were defined as the distance between the XCOM and the anterior, posterior, medial, and lateral BOS boundaries, respectively (Figure 2). The MOS equation was adjusted to account for the direction of the coordinate system, such that positive and negative MOS values indicated stable (XCOM within BOS) and unstable (XCOM outside BOS) states, respectively (Figure 2; Bruijn et al., 2013). The minimum MOS relative to each of the four boundaries during the first half of the single-support phase and MOS at heel contact were calculated. The first half of single-support was examined as mechanical stability during this interval is expected to influence both the spatial and temporal aspects of the step taken with the swing limb. If individuals experienced low mechanical stability in the latter portion of single-support they likely would not have enough time before heel strike to make corrections. For example, median single-support time within the dataset was 370 ms; therefore, transient low stability within the first half of single support would allow participants at least 185 ms to adjust step placement or timing to correct for this low stability. Previous research suggests that such on-line corrections to walking can be initiated in approximately 100–120 ms (Potocanac & Duysens, 2017).
Figure 2.

Margin of stability (MOS) calculated as the minimum distance from each boundary of the base of support (BOS) to the extrapolated centre of mass (XCOM), during single support (Panel A), and at heel strike (Panel B). Each black circle indicates a BOS boundary, while the grey circle indicates the location of the XCOM. The coordinate system was such that positive X pointed to the participants’ right and positive Z pointed to the participants’ posterior. The anterior, posterior, medial, and lateral margins of stability were specifically defined using as MOSA = −(BOSAZ – XCOMz), MOSP = (BOSPZ – XCOMZ), MOSM = −(BOSMX – XCOMX), and MOSL = (BOSLX – XCOMX).
2.4 Statistical analysis
We estimated the short-term variability of swing time, step length, and step width using the Poincaré plot method described previously (Hollman et al., 2016; Figure 3). Scatter plots were created for each trial, with swing time, step length, or step width for each step on the x-axis, and swing time, step length, or step width for the next step on the y-axis. Principal component analysis (Oliveira, Simpson, & Nada, 1996) was used to fit an ellipse to the data, centred at the mean swing time, step length, or step width; the length and width of the ellipse were defined by one standard deviation along the major and minor axes, respectively (Hollman et al., 2016). Two lines were drawn tangent to the ellipse and parallel to the positive axis. Points outside of these lines were identified as ‘extreme’ steps; that is, consecutive steps that were much slower, longer, or wider or much faster, shorter, or narrower than the previous step. One-way repeated-measures analyses of covariance (ANCOVAs) were used to determine if MOS during the first half of the swing phase and at heel contact differed between ‘extreme’ and ‘normal’ steps, controlling for walking speed. Specific comparisons were: MOSA between long and normal steps (step length); MOSP between short and normal steps (step length); MOSM between wide and normal steps (step width); MOSL between narrow and normal steps (step width); MOSA and MOSM between quick and normal steps (swing time); and lastly, MOSP and MOSL between slow and normal steps (swing time). To adjust for multiple comparisons, alpha was adjusted from 0.05 to 0.0083 using the Holm-Bonferroni method (Holm, 1979).
Figure 3.
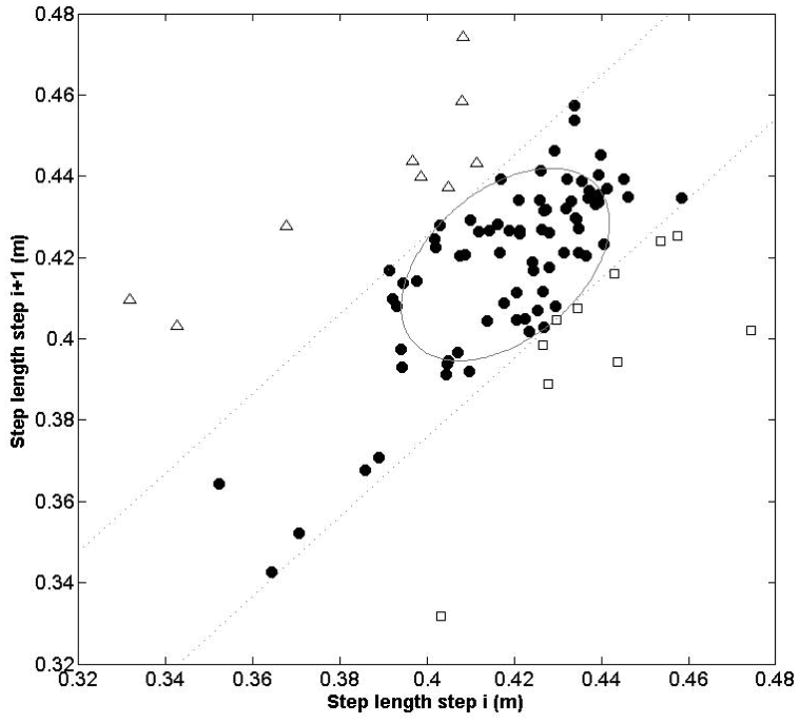
This Poincaré plot illustrates the step length time series data for a representative trial (1-minute of walking at a constant speed) for one participant. Each point represents the step length for a given step (i) on the x-axis, and the subsequent step (i+1) on the y-axis. The ellipse was created by calculating one standard deviation along the major and minor axes, and is centred at the average step length. The dashed lines are tangent to the ellipse and parallel to the major axis; these lines represent the boundaries where consecutive steps are similar lengths, much longer, or much shorter. That is, points in the upper left of the graph outside the boundary line (white triangles) represent steps that were much longer than the previous step. Points in the lower right of the graph outside the boundary line (white squares) represent steps that were much shorter than the previous step. Points within the boundary lines (black circles) represent steps that were a similar length to the previous step.
3. RESULTS
Minimum MOSA in single support was lower prior to long steps compared to normal steps (F1,10=29.45, p=0.0003; Table 1), but higher at heel strike for long steps compared to normal steps (F1,10=17.75, p=0.0018). No significant difference was found in minimum MOSP in single support prior to normal steps and short steps (F1,10=0.06, p=0.82). MOSP at heel strike was lower for short steps compared to normal steps (F1,10=78.04, p<0.0001). Minimum MOSM in single support was significantly lower prior to wide steps than prior to normal steps (F1,10=41.77, p<0.0001); however, when adjusted for multiple comparisons, there was no difference in MOSM at heel strike between wide steps and normal steps (F1,10=7.89, p=0.019). There was no significant difference in minimum MOSL in single support prior to normal and narrow steps (F1,10=0.09, p=0.77), whereas MOSL at heel strike was lower for narrow steps compared to normal steps (F1,10=22.50, p=0.0008).
Table 1.
Margin of stability (MOS) values during the first half of the swing phase (minimum value) and at heel strike for ‘normal’ and extreme steps (both length and width). Values presented are least square means (adjusted for walking speed) with 95% confidence intervals in brackets.
| Extreme steps | ||||
|---|---|---|---|---|
|
|
||||
| Normal steps | Long steps | Short steps | p-value | |
| Min. MOSA in swing (cm) | −21.4 [−21.7, −21.1] | −22.2 [−22.5, −21.9] | 0.0003* | |
| MOSA at heel strike (cm) | 10.3 [10.0, 10.6] | 10.8 [10.5, 11.1] | 0.0018* | |
| Min. MOSP in swing (cm) | 32.3 [31.8, 32.8] | 32.4 [31.9, 32.9] | 0.82 | |
| MOSP at heel strike (cm) | 71.0 [70.6, 71.3] | 69.3 [69.0, 69.7] | <0.0001* | |
|
| ||||
| Normal steps | Wide steps | Narrow steps | p-value | |
|
| ||||
| Min. MOSM in swing (cm) | −4.3 [−4.6, −4.0] | −5.1 [−5.4, −4.8] | <0.0001* | |
| MOSM at heel strike (cm) | 17.1 [16.9, 17.2] | 17.3 [17.2, 17.5] | 0.019 | |
| Min. MOSL in swing (cm) | 11.1 [10.8, 11.4] | 11.1 [10.8, 11.3] | 0.77 | |
| MOSL at heel strike (cm) | 19.0 [18.7, 19.4] | 18.4 [18.1, 18.8] | 0.0008* | |
Statistically significant at p<0.0083.
MOSA=MOS in the anterior direction, MOSM=MOS in the medial direction, MOSP=MOS in the posterior direction, MOSL=MOS in the lateral direction.
Minimum MOSA (F1,10=25.93, p=0.0005) and MOSM (F1,10=30.06, p=0.0003) in single support were significantly lower prior to quick steps than normal steps (Table 2). However, there were no significant differences in MOSA or MOSM at heel strike between quick and normal steps (F1,10<1.96, p>0.18). Minimum MOSP (F1,10=71.44, p<0.0001) and MOSL (F1,10=16.05, p=0.0025) in single support were significantly lower prior to slow steps than normal steps. MOSP at heel strike was significantly higher for slow steps than normal steps (F1,10=14.80, p=0.0032). There was no significant difference in MOSL at heel strike between slow and normal steps (F1,10=3.15, p=0.11).
Table 2.
Margin of stability (MOS) values during the first half of the swing phase (minimum value) and at heel strike for ‘normal’, quick, and slow steps. Values presented are least square means (adjusted for walking speed) with 95% confidence intervals in brackets.
| Normal steps | Quick steps | Slow steps | p-value | |
|---|---|---|---|---|
| Min. MOSA in swing (cm) | −21.2 [−22.3, −20.1] | −25.7 [−26.8, −24.6] | 0.0005* | |
| MOSA at heel strike (cm) | 10.2 [8.4, 12.0] | 8.2 [6.4, 10.0] | 0.19 | |
| Min. MOSP in swing (cm) | 31.9 [31.7, 32.2] | 31.1 [30.8, 31.3] | <0.0001* | |
| MOSP at heel strike (cm) | 71.0 [70.6, 71.3] | 71.4 [71.0, 71.7] | 0.0032* | |
| Min. MOSM in swing (cm) | −4.4 [−4.6, −4.1] | −5.3 [−5.6, −5.0] | 0.0003* | |
| MOSM at heel strike (cm) | 17.1 [16.9, 17.3] | 17.0 [16.8, 17.1] | 0.30 | |
| Min. MOSL in swing (cm) | 11.1 [10.6, 11.5] | 10.6 [10.2, 11.1] | 0.0025* | |
| MOSL at heel strike (cm) | 19.1 [18.6, 19.6] | 18.9 [18.4, 19.4] | 0.11 |
Statistically significant at p<0.0083.
MOSA=MOS in the anterior direction, MOSM=MOS in the medial direction, MOSP=MOS in the posterior direction, MOSL=MOS in the lateral direction.
4. DICUSSION
This study aimed to determine if ‘extreme’ values of step length, width, and time followed bouts of low mechanical stability. Our hypotheses were partially supported.
Margins of stability in the anterior and medial directions were lower prior to long and wide steps, respectively. These findings suggest that the XCOM moved farther forward or medially than usual during the first half of single-support, such that a longer or wider step than usual with the swing limb may have been necessary to preserve mechanical stability. That is, foot position changed in the same direction of the falling centre of mass (i.e., in the direction of low mechanical stability; Wang & Srinivasan, 2014). These findings are in agreement with others who examined changes in step length and width following external postural perturbations during walking; step length increased when an ‘elevating strategy’ was used following a trip (Eng, Winter, & Patla, 1994) and step width increased following continuous pseudo-random medio-lateral perturbations (Hak et al., 2012), compared to unperturbed walking. Other studies found that, during unperturbed walking, trunk or hip position and velocity or acceleration during mid-stance of normal walking were positively correlated with step width (Hurt, Rosenblatt, Crenshaw, & Grabiner, 2010; Wang & Srinivasan, 2014).
Conversely, mechanical stability in the posterior direction was not lower prior to short steps relative to normal steps, and mechanical stability in the lateral direction was not lower prior to narrow steps relative to normal steps. It is, perhaps, noteworthy that significant effects on step placement were found for the dimensions where the system is naturally unstable in single support (i.e., negative MOS in the anterior and medial directions), but not those dimensions where the system is naturally stable (i.e., positive in the posterior and lateral directions). Thus, it is possible that relatively small perturbations to XCOM are sufficient to evoke adjustments in step placement when the body is already unstable (i.e., anterior and medial directions). Conversely, perhaps much larger perturbations to XCOM in directions where the body is naturally stable (i.e., posterior or lateral directions) are required to evoke adjustments in step placement.
The hypotheses regarding the relationship between mechanical stability during single support and step timing were supported. Specifically, in agreement with previous research using external perturbations (Vlutters et al., 2016), low mechanical stability in the anterior and medial directions preceded quick steps, and low mechanical stability in the posterior and lateral directions preceded slow steps. It is likely that low mechanical stability in the anterior and medial directions necessitates shortening swing duration in order to quickly establish the more stable double-support (Cordero, Koopman, & van der Helm, 2003). Vlutters et al (2016) suggested increasing swing duration may function to provide time to regain forward velocity, and that increased swing time following lateral perturbations may be due to the XCOM being pushed laterally but not over the lateral border; thus, no direct correction is needed for this lateral instability.
At heel strike, there were either no differences in MOS between ‘normal’ and ‘extreme’ steps, or the direction of the relationship was reversed from that observed during single support. For example, while MOS in the anterior direction was lower during single support prior to long steps than normal steps, MOS in the anterior direction was actually higher at heel strike for long steps than normal steps. Following a perturbation to mechanical stability, as defined by the MOS, stability can either be preserved by adjusting the position/velocity of the COM, or by adjusting the BOS. Our findings suggest that altered placement or timing of the swing limb did, indeed, successfully preserve mechanical stability.
MOS during gait has typically been quantified during double support (Curtze, Hof, Postema, & Otten, 2011; McAndrew Young & Dingwell, 2012). Conversely, the present study examined minimum MOS during the first half of single-support, due to the expectation that transient periods of low mechanical stability during this phase would influence placement and timing of swing-limb steps. It is also important to note that most studies have used the anterior and/or lateral border to define the BOS (Curtze et al., 2011; McAndrew Young & Dingwell, 2012). For the present study, all four borders (anterior, posterior, medial, lateral) were used to quantify MOS, recognizing that the XCOM can, theoretically, pass the border of the BOS in any direction, and enabling a better understanding of the location of the XCOM relative to the entire BOS. Examining MOS during single support and using all four edges of the BOS led to calculating negative MOS values in the medial and anterior directions. Negative MOS values suggest that gait is inherently unstable in these directions (Bruijn et al., 2013; Hof et al., 2005). However, the negative value is interpreted to mean that the individual will fall if a corrective action (e.g., a step) is not taken (Hof et al., 2005). Since these values were calculated during continuous walking, participants had already planned to correct for this instability by stepping in the direction of instability (i.e., anterior and medial to the stance limb).
Results of this study provide insight into how healthy individuals adapt gait in response to low mechanical stability. This work clarifies how the placement and timing of steps during walking can preserve stability following periods of low mechanical stability, or ‘internal’ postural perturbations, when walking among healthy young adults. Thus, transient periods of low mechanical stability may be a source of gait variability, which could explain the relationship between gait variability and fall risk among older adults (Callisaya et al., 2011; Hausdorff et al., 2001; Maki, 1997). That is, high spatio-temporal gait variability among older adults at risk of falling may be reflective of unstable walking. However, these findings will need to be replicated among older adults. It is important to note that the differences in MOS between normal and extreme steps were very low (<1 cm), yet statistically significant. Other studies have found similar small (<1 cm), yet statistically significant, differences in MOS between conditions (Marone, Patel, Hurt, & Grabiner, 2014) (McAndrew Young & Dingwell, 2012) or between groups of participants (Gates, Scott, Wilken, & Dingwell, 2013). Combined, these findings support the notion that human gait is finely tuned (Hausdorff, 2005), and that even very small deviations from the ‘optimal’ pattern can require correction.
4.1 Limitations
This study involved treadmill walking as opposed to overground walking. Treadmill walking is less variable than overground walking (Hollman et al., 2016), potentially due to the mechanical constraints of the treadmill (e.g., constant speed). Future studies should investigate the relationship between mechanical stability and variability during overground walking. We did not analyse the perturbed walking parts of the trials. Previous studies have examined the effect of external perturbations on mechanical stability and step placement and timing during walking (Hak et al., 2012; Vlutters et al., 2016). Within this dataset, perturbations were only applied in the antero-posterior direction (J. K. Moore et al., 2015); therefore, we would not have been able to examine the effect of these perturbations on medio-lateral stability. Trials were only one minute long; greater variability of spatio-temporal measures may have been observed with longer trial durations (Hollman et al., 2010). As this study involved secondary analysis of another dataset, we were unable to control how data were collected to optimize the current analysis. Specifically, a lack of medial foot marker necessitated estimating the medial boundary of the BOS using participants’ foot width, and the force plate sample frequency (100 Hz) was such that gait events (heel strike and toe off) could be determined with only a 10 ms resolution.
5. CONCLUSIONS
Low mechanical stability when walking may contribute to step length, step width, and swing time variability. In particular, mechanical stability in the anterior and medial directions was lower prior to long and wide steps, respectively; mechanical stability in the anterior and medial directions were lower prior to quick steps; and mechanical stability in the posterior and lateral directions were lower prior to slow steps. There were either no differences in mechanical stability between ‘normal’ and ‘extreme’ steps at heel strike, or the direction of the relationship observed during single support reversed, indicating that adjusting step placement or timing helped to preserve mechanical stability. These findings suggest that experiencing transient periods of low mechanical stability when walking may at least partially explain the relationship between spatiotemporal gait variability and falls in daily life. That is, higher spatio-temporal variability suggests increased mechanical instability during walking.
Acknowledgments
We thank Jason Moore, Sandra Hnat, and Antonie van den Bogert for making their dataset publicly available.
8. FUNDING
SS was supported by an Undergraduate Student Research Award from the Natural Sciences and Engineering Research Council of Canada. ASI was supported by a Trainee Award from the Heart and Stroke Foundation Canadian Partnership for Stroke Recovery and an Interdisciplinary Fellowship from the Canadian Frailty Network. AM holds a New Investigator Award from the Canadian Institutes of Health Research (MSH-141983). The views expressed do not necessarily reflect those of the funders.
Footnotes
6. CONFLICT OF INTEREST STATEMENT
The authors declare that there is no conflict of interest associated with the present research.
References
- Berg WP, Alessio HM, Mills EM, Tong C. Circumstances and consequences of falls in independent community-dwelling older adults. Age Ageing. 1997;26(4):261–268. doi: 10.1093/ageing/26.4.261. [DOI] [PubMed] [Google Scholar]
- Bruijn SM, Meijer OG, Beek PJ, van Dieën JH. Assessing the stability of human locomotion: a review of current measures. J R Soc Interface. 2013;10:20120999. doi: 10.1098/rsif.2012.0999. [DOI] [PMC free article] [PubMed] [Google Scholar]
- Callisaya ML, Blizzard L, Schmidt MD, Martin KL, McGinley JL, Sanders LM, Srikanth VK. Gait, gait variability and the risk of multiple incident falls in older people: a population-base study. Age Ageing. 2011;40(4):481–487. doi: 10.1093/ageing/afr055. [DOI] [PubMed] [Google Scholar]
- Callisaya ML, Blizzard L, Schmidt MD, McGinley JL, Srikanth VK. Ageing and gait variability - a population-based study of older people. Age Ageing. 2010;39(2):191–197. doi: 10.1093/ageing/afp250. [DOI] [PubMed] [Google Scholar]
- Cordero AF, Koopman HFJM, van der Helm FCT. Multiple-step strategies to recover from stumbling perturbations. Gait Posture. 2003;18:47–59. doi: 10.1016/s0966-6362(02)00160-1. [DOI] [PubMed] [Google Scholar]
- Curtze C, Hof AL, Postema K, Otten B. Over rough and smooth: amputee gait on an irregular surface. Gait Posture. 2011;33(2):292–296. doi: 10.1016/j.gaitpost.2010.11.023. [DOI] [PubMed] [Google Scholar]
- de Leva P. Adjustments to Zatsiorsky-Seluyanov’s segement inertia parameters. J Biomech. 1996;29(9):1223–1230. doi: 10.1016/0021-9290(95)00178-6. [DOI] [PubMed] [Google Scholar]
- Eng JJ, Winter DA, Patla AE. Strategies for recovery from a trip in early and late swing during human walking. Exp Brain Res. 1994;102:339–349. doi: 10.1007/BF00227520. [DOI] [PubMed] [Google Scholar]
- Gates DH, Scott SJ, Wilken JM, Dingwell JB. Frontal plane dynamic margins of stability in individuals with and without transtibial amputation walking on a loose rock surface. Gait Posture. 2013;38(4):570–575. doi: 10.1016/j.gaitpost.2013.01.024. [DOI] [PMC free article] [PubMed] [Google Scholar]
- Hak L, Houdijk H, Steenbrink F, Mert A, van der Wurff P, Beek PJ, van Dieën JH. Speeding up or slowing down? Gait adaptations to preserve gait stability in response to balance perturbations. Gait Posture. 2012;36(2):260–264. doi: 10.1016/j.gaitpost.2012.03.005. [DOI] [PubMed] [Google Scholar]
- Hausdorff JM. Gait variability: methods, modeling and meaning. J Neuroeng Rehabil. 2005;2:19. doi: 10.1186/1743-0003-2-19. [DOI] [PMC free article] [PubMed] [Google Scholar]
- Hausdorff JM, Rios DA, Edelberg HK. Gait variability and fall risk in community-living older adults: a 1-year prospective study. Arch Phys Med Rehabil. 2001;82:1050–1056. doi: 10.1053/apmr.2001.24893. [DOI] [PubMed] [Google Scholar]
- Hof AL. The ‘extrapolated center of mass’ concept suggests a simple control of balance in walking. Hum Mov Sci. 2008;27:112–125. doi: 10.1016/j.humov.2007.08.003. [DOI] [PubMed] [Google Scholar]
- Hof AL, Gazendam MGJ, Sinke WE. The condition for dynamic stability. J Biomech. 2005;38:1–8. doi: 10.1016/j.jbiomech.2004.03.025. [DOI] [PubMed] [Google Scholar]
- Hollman JH, Childs KB, McNeil ML, Mueller AC, Quilter CM, Youdas JW. Number of strides required for reliability measurements of pace, rhythm and variability parameters of gait during normal and dual task walking in older individuals. Gait Posture. 2010;32(1):23–28. doi: 10.1016/j.gaitpost.2010.02.017. [DOI] [PubMed] [Google Scholar]
- Hollman JH, Watkins MK, Imhoff AC, Braun CE, Akervik KA, Ness DK. A comparison of variability in spatiotemporal gait parameters between treadmill and overground walking conditions. Gait Posture. 2016;43:204–209. doi: 10.1016/j.gaitpost.2015.09.024. [DOI] [PubMed] [Google Scholar]
- Holm S. A simple sequentially rejective multiple test procedure. Scand J Statist. 1979;6:65–70. [Google Scholar]
- Hurt CP, Rosenblatt N, Crenshaw JR, Grabiner MD. Variation in trunk kinematics influences variation in step width during treadmill walking by older and younger adults. Gait Posture. 2010;31:461–464. doi: 10.1016/j.gaitpost.2010.02.001. [DOI] [PubMed] [Google Scholar]
- Kang HG, Dingwell JB. Separating the effects of age and walking speed on gait variability. Gait Posture. 2008;27(4):572–577. doi: 10.1016/j.gaitpost.2007.07.009. [DOI] [PubMed] [Google Scholar]
- Maki BE. Gait changes in older adults: predictors of falls or indicators of fear? J Am Geriatr Soc. 1997;45:313–320. doi: 10.1111/j.1532-5415.1997.tb00946.x. [DOI] [PubMed] [Google Scholar]
- Marone JR, Patel PB, Hurt CP, Grabiner MD. Frontal plane margin of stability is increased during texting while walking. Gait Posture. 2014;40(1):243–246. doi: 10.1016/j.gaitpost.2014.04.188. [DOI] [PubMed] [Google Scholar]
- McAndrew Young PM, Dingwell JB. Voluntary changes in step width and step length during human walking affect dynamic margins of stability. Gait Posture. 2012;36:219–224. doi: 10.1016/j.gaitpost.2012.02.020. [DOI] [PMC free article] [PubMed] [Google Scholar]
- Moore J, Hnat S, van de Bogert A. An elaborate data set on human gait and the effect of mechanical perturbations. 2014 doi: 10.7717/peerj.918. Retrieved 30 April, 2015, from https://zenodo.org/record/13030#.VsXbvkB-OGW. [DOI] [PMC free article] [PubMed]
- Moore JK, Hnat SK, van den Bogert AJ. An eleborate data set on human gait and the effect of mechanical perturbations. PeerJ. 2015;3:e918. doi: 10.7717/peerj.918. [DOI] [PMC free article] [PubMed] [Google Scholar]
- Moore JK, Nwanna O, Hnat SK, van den Bogert A. GaitAnalysisToolKit: Version 0.1.2. 2014 Retrieved 30 April, 2015, from https://zenodo.org/record/13159#.VsXhVEB-OGU.
- Oliveira LF, Simpson DM, Nada J. Calculation of area of stabilometric signals using principal component analysis. Physiol Meas. 1996;17:305–312. doi: 10.1088/0967-3334/17/4/008. [DOI] [PubMed] [Google Scholar]
- Overstall P. Falls and gait disorders in the elderly - principles of rehabilitation. In: Bronstein AM, Brandt T, Woollacott MH, Nutt JG, editors. Clinical disorders of balance, posture and gait. 2. London: Arnold; 2004. pp. 404–421. [Google Scholar]
- Pai YC, Patton J. Center of mass velocity-position for balance control. J Biomech. 1997;30(4):347–354. doi: 10.1016/s0021-9290(96)00165-0. [DOI] [PubMed] [Google Scholar]
- Potocanac Z, Duysens J. Online adjustment of leg movements in healthy young and old. Exp Brain Res. 2017 doi: 10.1007/s00221-017-4967-7. [DOI] [PubMed] [Google Scholar]
- Stout RD, Wittstein MW, LoJacono CT, Rhea CK. Gait dynamics when wearing a treadmill safety harness. Gait Posture. 2016;44:100–102. doi: 10.1016/j.gaitpost.2015.11.012. [DOI] [PubMed] [Google Scholar]
- Tian Q, Chastan N, Bair WN, Resnick SM, Ferrucci L, Studenski SA. The brain map of gait variability in aging, cognitive impairment and dementia - a systematic review. Neurosci Biobehav Rev. 2017;74:149–162. doi: 10.1016/j.neubiorev.2017.01.020. [DOI] [PMC free article] [PubMed] [Google Scholar]
- Vlutters M, van Asseldonk EH, van der Kooij H. Center of mass velocity-based predictions in balance recovery following pelvis perturbations during human walking. J Exp Biol. 2016;219(Pt 10):1514–1523. doi: 10.1242/jeb.129338. [DOI] [PubMed] [Google Scholar]
- Wang Y, Srinivasan M. Stepping in the direction of the fall: the next foot placement can be predicted from current upper body state in steady-state walking. Biol Lett. 2014;10(9):20140405. doi: 10.1098/rsbl.2014.0405. [DOI] [PMC free article] [PubMed] [Google Scholar]
- Winter DA. Biomechanics and motor control of human movement. 3. Hoboken, NJ, USA: John Wiley & Sons; 2005. [Google Scholar]