Fig. 3.
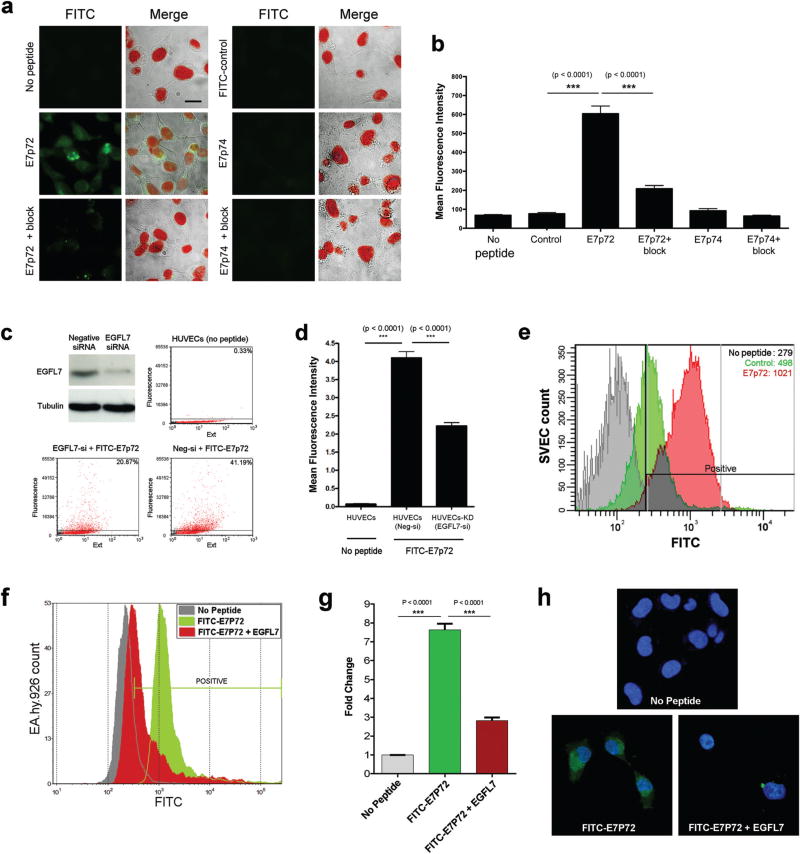
E7p72 targets endothelial cells in an EGFL7-dependent manner. (a) Fluorescence images showing the uptake of FITC-conjugated E7-p72, E7-p74 and a control peptide (final concentration = 3.3 microM) by HT1080 cells. Left panels: FITC signal from peptide uptake (green). Right panels: Merged images of brightfield image, nuclei staining (red) and FITC-conjugated peptide (green). A blocking study was conducted by adding 100× molar excess of non-labeled peptides. Scale bar, 10 microns. (b) Bar graph showing the mean fluorescence intensity of cells from each group. The perimeter of each cell was selected, and the mean FITC intensity within each selected region was measured using Volocity software. The uptake of FITC-E7p72, but not FITC-E7p74 was significantly higher than that of control peptide (n = 30, p < 0.001). FITC-E7p72 binding was significantly reduced in the presence of 100× excess unlabeled E7p72 peptide (n = 30, p < 0.001). (c) Western blot analysis showing EGFL7 expression and EGFL7 knockdown (by siRNA) in HUVECs using the EGFL7 polyclonal antibody (top left). Dot plots show the uptake of FITC-E7p72 by HUVECs or HUVECs-KD (EGFL7 knockdown). Flow cytometry analysis was performed using the COPAS flow cytometer (Union Biometrica) and the plots were generated using FCS express (version 3). (d) Bar graph showing the uptake of FITC-E7p72 by HUVECs or HUVECs-KD. All statistics were performed using a one-way ANOVA and Tukey post hoc test. (e) Histogram showing the uptake of FITC-conjugated E7p72 (red) or control peptide (green) (final concentration = 3.3 mM) by mouse endothelial cells (SVEC). The mean fluorescence intensity of each group is indicated in the plot. (f) Histogram showing the uptake of FITC-conjugated E7p72 by human endothelial cells (EA.hy926) in the presence or absence of EGFL7 (final concentration = 3.3 mM) using the Fortessa X-20 flow cytometer. (g) Bar graph showing a 64.5% decrease in the uptake of FITC-E7p72 in the presence of EGFL7 by EA.hy926 cells. All statistics were performed using a one-way ANOVA and Tukey post hoc test. (h) Confocal images showing uptake of FITC-E7p72 (green) by EA.hy926 cells were captured at 63× magnification. FITC-E7p72 (in green) and Hoechst 33342 stained nuclei staining (in blue) are shown here. Scale bar, 20 microns.

