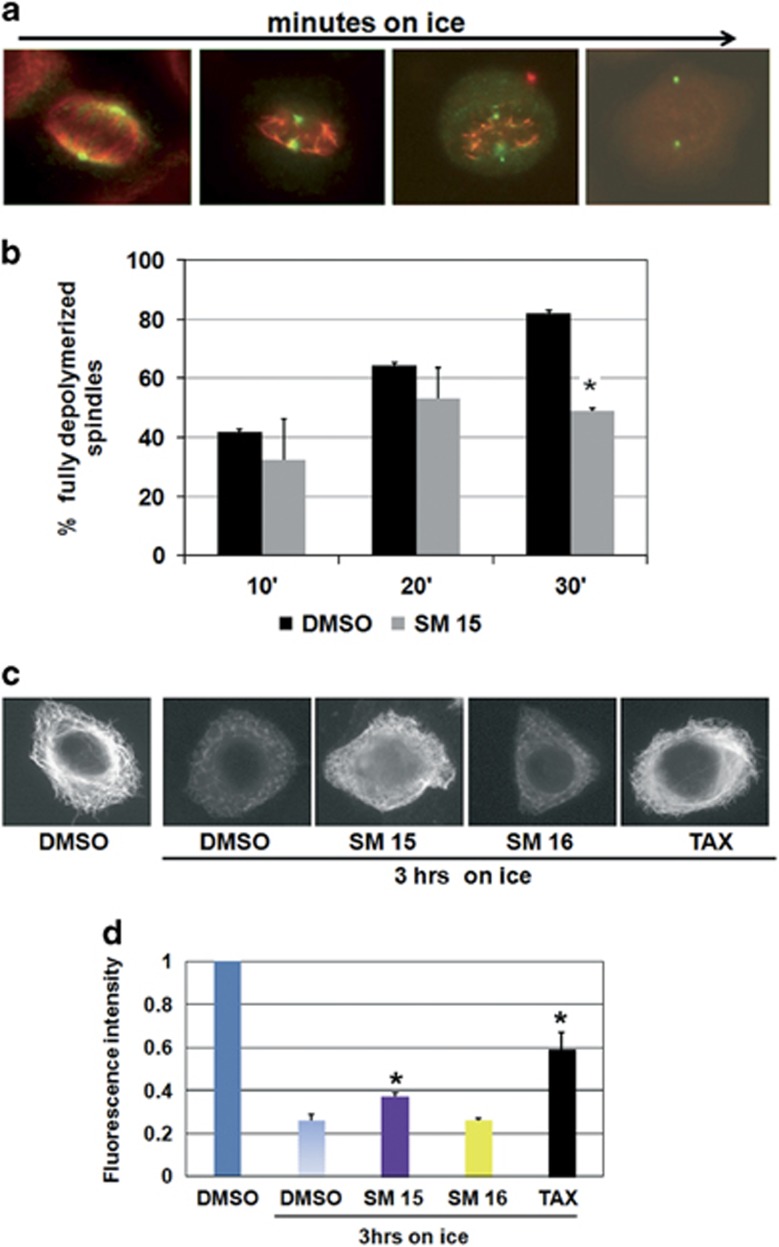
Figure 5.
Mitotic and interphase MTs are stabilized by SM15 treatment. (a) Representative images of MT depolymerization during incubation on ice. After short incubation times on ice, non-KT MTs depolymerize leaving behind only K-fibers, that is, the bundle of MTs attached to KTs; for longer times on ice also K-fibers depolymerize leading to fully depolymerized spindles (third and forth image in the row). MTs (red) and spindle poles (green) are visualized by α-tubulin and γ-tubulin immunostaining. (b) Quantitative analysis of the percentage of fully depolymerized spindles in cells exposed to DMSO or 10 μM SM15 for 3 h prior and during 10, 20 or 30 min incubation on ice. The graph shows means±s.e.m. by scoring 240 mitoses per condition in three independent experiments. (c) Representative images of the interphase MT network in the different treatment conditions as visualized by α-tubulin immunostaining. (d) Quantitative analysis of interphase MT depolymerization in cells exposed to 1% DMSO, SM15, SM16 (10 μM) or 0.1 μM taxol (TAX) for 3 h prior and during 3 h of incubation on ice. The graph shows means of α-tubulin fluorescence intensity±s.e.m. (in arbitrary units) by measuring 20 cells per condition from two independent experiments. α-tubulin fluorescence intensity in untreated cells is set as 1. *P<0.05.

