

Abstract
Alzheimer's disease (AD) is characterized by severe neuronal loss as well as the accumulation of amyloid‐β (Aβ), which ultimately leads to plaque formation. Although there is now a general agreement that the aggregation of Aβ can be initiated by prion‐like seeding, the impact and functional consequences of induced Aβ deposits (Aβ seeding) on neurons still remain open questions. Here, we find that Aβ seeding, representing early stages of plaque formation, leads to a dramatic decrease in proliferation and neurogenesis in two APP transgenic mouse models. We further demonstrate that neuronal cell death occurs primarily in the vicinity of induced Aβ deposits culminating in electrophysiological abnormalities. Notably, environmental enrichment and voluntary exercise not only revives adult neurogenesis and reverses memory deficits but, most importantly, prevents Aβ seeding by activated, phagocytic microglia cells. Our work expands the current knowledge regarding Aβ seeding and the consequences thereof and attributes microglia an important role in diminishing Aβ seeding by environmental enrichment.
Keywords: adult neurogenesis, Alzheimer's disease, Aβ seeding, environmental enrichment, microglia
Subject Categories: Molecular Biology of Disease, Neuroscience
Introduction
Alzheimer's disease (AD) is a neurodegenerative disease that is characterized by cognitive decline and memory impairment. The most prominent neuropathological hallmark is extracellular aggregates of the amyloid‐β peptide (Aβ), so‐called amyloid plaques that accumulate amongst other brain regions predominantly in the hippocampus (Selkoe, 1999). Thus, several studies have examined the fate of neurogenesis in AD and in transgenic mouse models of AD, all of which provided inconclusive and contradictory results (Jin et al, 2004a,b; Zhang et al, 2007; Ermini et al, 2008; Demars et al, 2010; Moon et al, 2014; Ekonomou et al, 2015). In an attempt to link amyloid pathology specifically to alterations in adult neurogenesis, we performed intra‐hippocampal injections of Aβ‐containing brain extracts into 5xFAD transgenic mice that previously have been shown to robustly induce Aβ plaque formation in vivo (Kane et al, 2000; Meyer‐Luehmann et al, 2006; Bachhuber et al, 2015). Most recently published studies focused on the identification of the seed‐inducing factor (Langer et al, 2011; Hamaguchi et al, 2012; Fritschi et al, 2014a,b). However, the impact of seed‐induced Aβ deposits on neurons has not yet been investigated. Interestingly, the localization of those induced Aβ deposits is unique and appears in a very specific pattern confined to the subgranular zone (SGZ) and granular cell layer (GCL) of the hippocampus (Meyer‐Luehmann et al, 2006), which makes this model ideal to study the immediate impact of Aβ plaque formation on the fate of newborn neurons.
Multipotent neural stem cells have been proposed to be the source of adult neurogenesis (Gage, 2000; Kriegstein & Alvarez‐Buylla, 2009; Bonaguidi et al, 2011; Ming & Song, 2011), a lifelong production of new neurons, occurring in the SGZ of the dentate gyrus and in the subventricular zone (SVZ) of the lateral ventricles (Lois & Alvarez‐Buylla, 1993; Doetsch et al, 1999; Seri et al, 2001). Given the fact that newly generated cells in the SGZ are functionally integrated in the GCL, it is assumed that they are crucial for hippocampal‐dependent spatial learning and memory throughout life (Ge et al, 2007; Kee et al, 2007; Tashiro et al, 2007). However, numerous studies suggest that neurogenesis declines with age (Kuhn et al, 1996; Kempermann et al, 1998; Cameron & McKay, 1999), raising the possibility that this reduction accounts for impaired learning and memory (Kempermann et al, 1998). Intriguingly, exposure to an enriched environment increases adult neurogenesis in the dentate gyrus (Kempermann et al, 1997, 1998; Nilsson et al, 1999; van Praag et al, 1999a,b) and reduces Aβ plaque pathology in APP transgenic mice (Lazarov et al, 2005; Hu et al, 2010).
Here, we report that the generation and maturation of newborn neurons in the SGZ is affected by seed‐induced Aβ deposits, resulting in an excitatory/inhibitory synaptic imbalance in the GCL. We further show that cell death and apoptosis occur in conjunction with Aβ seeding and that exposure to enriched environment and voluntary running reduces Aβ seeding via activated microglia, vivifies neurogenesis, and reverses memory impairment.
Results
Adult hippocampal neurogenesis and cell proliferation are increased in pre‐depositing 5xFAD mice
We determined proliferation and neurogenesis in 5xFAD transgenic mice at different ages (6 weeks, 4 and 8 months) and compared them to their WT littermates. 5xFAD transgenic mice were used in this study since they develop Aβ deposition early, starting at around 4 months of age in the hippocampus (Oakley et al, 2006). For this purpose, we used doublecortin (DCX) as a marker for neurogenesis that is expressed in immature granule cells but turned off before neurons reach maturity and Ki67 as a cellular marker for proliferation. While the number of DCX‐ and Ki67‐positive cells dramatically declined with age in WT mice (Fig 1A–E), the number of DCX‐positive neuroblasts and immature neurons was significantly increased in 4‐month‐old 5xFAD mice when compared to WT controls at the same age (Fig 1A and B). Immunoblotting also confirmed higher hippocampal DCX levels in 4‐month‐old 5xFAD mice (Fig 1C). Likewise, the number of Ki67‐positive proliferating cells in 5xFAD mice was significantly increased (Fig 1D and E). At this age, 5xFAD mice just start to develop plaques, whereas plenty of Aβ deposits could be detected by 6E10 immunoreactivity in 8‐month‐old 5xFAD mice (Fig 1A, white arrows).
Figure 1. Characterization of adult neurogenesis in the hippocampus of 5xFAD mice.
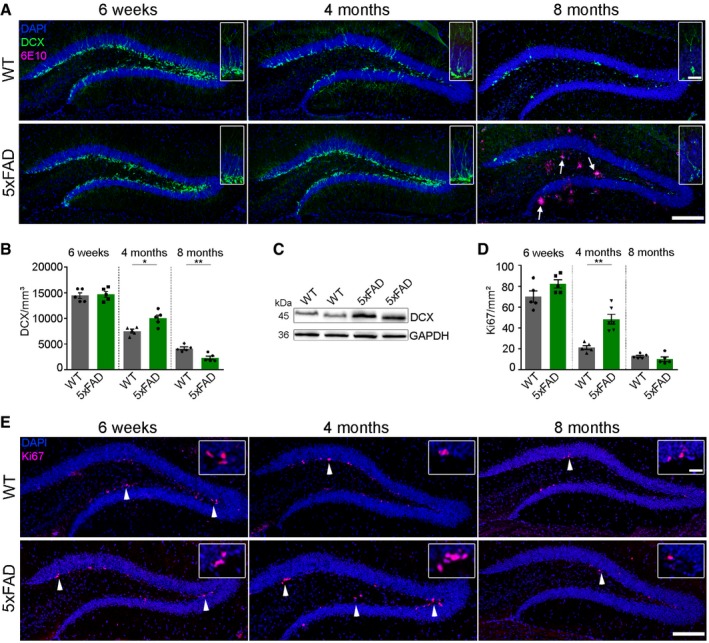
- Fluorescence microscopy of DCX (green), 6E10 (purple), and DAPI (blue). Shown are representative images of hippocampi from male WT mice (upper lane) and 5xFAD mice (lower lane) sacrificed at the age of 6 weeks, 4 or 8 months. White arrows indicate the presence of Aβ plaques. Scale bar represents 100 μm in the overview and 20 μm in the insert.
- Quantification of DCX‐positive cells in the dentate gyrus of WT and 5xFAD mice. Each symbol represents data from one mouse, with five to six mice per group. Ten sections per mouse were examined. Data are presented as mean ± s.e.m. Significant differences were determined by the Mann–Whitney test (4 months: *P = 0.03, 8 months: **P = 0.008).
- Immunoblot analysis of hippocampal homogenates for DCX of 4‐month‐old WT and 5xFAD mice.
- Quantification of Ki67‐positive cells in the dentate gyrus of WT and 5xFAD mice. Each symbol represents data from one mouse, with five to six mice per group. Ten sections per mouse were examined. Data are presented as mean ± s.e.m. Significant differences were determined by the Mann–Whitney test (**P = 0.004).
- Fluorescence microscopy of Ki67 (purple) and DAPI (blue). Shown are representative images of hippocampi from male WT mice (upper lane) and 5xFAD mice (lower lane) sacrificed at the age of 6 weeks, 4 or 8 months. Inserts show higher magnification of proliferating cells. Scale bar represents 100 μm in the overview and 20 μm in the insert. White arrowheads indicate the presence of Ki67‐positive cells.
Aβ seeding impairs adult hippocampal neurogenesis
Our hypothesis predicts that Aβ deposition will lead to a decline in immature neurons and proliferation. Therefore, we injected Aβ‐containing brain homogenate from a depositing 5xFAD mouse into the hippocampus of young male 5xFAD mice in order to induce Aβ deposits as previously published (Kane et al, 2000; Meyer‐Luehmann et al, 2006). At this age, these mice exhibit numerous dense‐cored plaques in several brain regions such as the cortex, thalamus, brainstem, or subiculum (Oakley et al, 2006) but notably do not appear to contain any plaques in the dorsal region of the hippocampus close to the injection site (Fig EV1). Nevertheless, to exclude the possibility that induced Aβ deposits represented endogenous plaques, we included a group of 5xFAD mice injected with WT homogenate as controls. In addition, we used WT littermates and injected them with either WT or 5xFAD homogenate to confirm the lack of Aβ seeding in WT mice (Kane et al, 2000; Meyer‐Luehmann et al, 2006). After 10 weeks of incubation, all mice were sacrificed at an age of 4 months (Fig 2A). 5xFAD mice that had been infused with Aβ‐containing brain homogenate developed numerous seeded Aβ plaques within the dentate gyrus of the hippocampus (Fig 2B, white arrowheads and Fig 2C). Importantly, no Aβ plaques could be found in all the other groups tested. Concomitantly, the number of DCX‐positive cells was substantially decreased in those seeded mice (Fig 2B and D) and correlated negatively with the seeding area (Fig 2E). This finding is of particular relevance in light of the increase in DCX‐positive cells in 5xFAD mice (uninjected) at the same age (Fig 1B). To investigate the proliferative activity of the remaining cells, we first provided the DNA base analog BrdU in the drinking water for 2 weeks. The incidence of BrdU‐labeled cells and BrdU‐labeled neurons was significantly decreased in seeded 5xFAD mice relative to controls (Fig 2F–H). Next, we used an antibody against proliferating cell nuclear antigen (PCNA) and Ki67. Indeed, the lowest number of proliferating cells was obtained in seeded 5xFAD mice (Fig 2J and K) consistent with the limited number of DXC‐ and BrdU‐positive cells in those mice (Fig 2D–H). To better define the cellular identity of the proliferating cells, we carried out double immunofluorescent stainings of PCNA together with marker either for astrocytes (GFAP), microglia (Iba1), or neurons (Tbr2; Fig 2I and L). Quantification of co‐localized staining revealed the highest percentage of PCNA/Tbr2 double‐positive cells (70%), whereas PCNA‐positive microglia (10%) and astrocytes (20%) represented only a minor fraction, indicating that most proliferating cells in the SGZ give rise to neurons.
Figure EV1. Aβ plaques in the brain of 4‐month‐old 5xFAD mice.
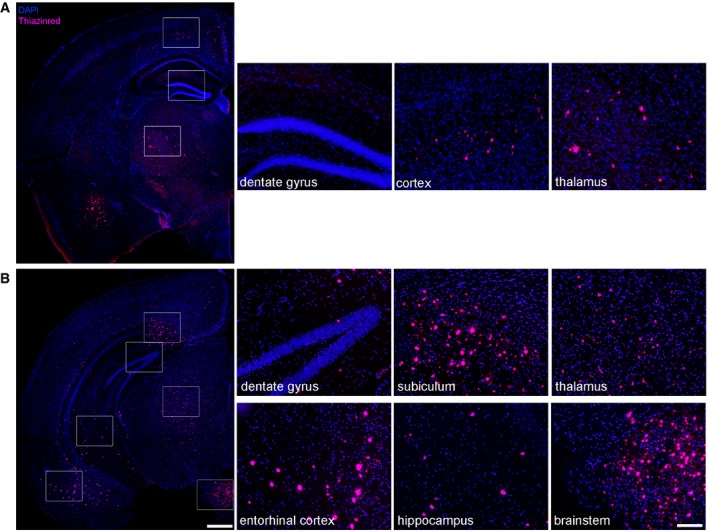
- Fluorescence microscopy of Aβ plaques (Thiazinred, purple) and DAPI (blue). Shown are representative images of a 4‐month‐old uninjected male 5xFAD mouse. There are several Aβ plaques in the cortex and thalamus (higher magnifications). In the dentate gyrus close to the injection site, Aβ plaques are completely absent.
- Fluorescence microscopy of Aβ plaques (Thiazinred, purple) and DAPI (blue) of caudal brain sections of a 4‐month‐old uninjected male 5xFAD mouse. There are numerous Aβ plaques in the entorhinal cortex, subiculum, thalamus, and brainstem but only few plaques in the dentate gyrus (see also higher magnifications). Scale bar represents 500 μm in the overview image on the left side and the scale bar on the right side represents 100 μm.
Figure 2. Seed‐induced Aβ deposits reduce adult hippocampal neurogenesis and proliferation.
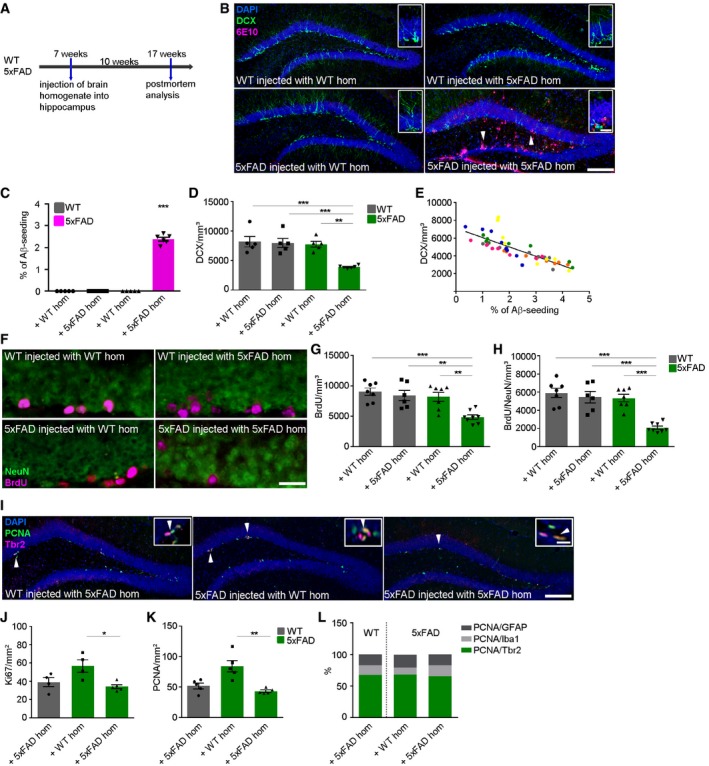
- Scheme of Aβ seeding experiments with WT and 5xFAD mice.
- Fluorescence microscopy of Aβ plaques (6E10, purple), DCX (green), and DAPI (blue). Shown are representative images of hippocampi from male mice sacrificed at the age of 4 months. Mice were WT or 5xFAD mice injected with WT or 5xFAD brain homogenate. White arrowheads indicate the presence of seed‐induced Aβ deposits. Scale bar represents 100 μm in the overview and 20 μm in the insert.
- Quantification of % of Aβ load in the dentate gyrus of WT and 5xFAD mice injected with WT or 5xFAD homogenate. Each symbol represents data from one mouse, with five mice per group. Data are presented as mean ± s.e.m. Significant differences were determined by the one‐way ANOVA, followed by Tukey's multiple comparison test, F(3, 18) = 650.1 (***P < 0.0001).
- Quantification of DCX‐positive cells in the dentate gyrus of WT and 5xFAD mice injected with WT or 5xFAD homogenate. Each symbol represents data from one mouse, with five to six mice per group. Data are presented as mean ± s.e.m. Significant differences were determined by one‐way ANOVA followed by Tukey's multiple comparison test, F(3, 17) = 12.14 (***P = 0.0005, ***P = 0.0009, **P = 0.0015).
- Pearson correlation between Aβ seeding and DCX‐positive cells in 5xFAD mice injected with 5xFAD brain homogenate. Each symbol represents data from one section, and one color represents one mouse (r = −0.819, P = < 0.0001).
- Fluorescence microscopy of BrdU (purple) and NeuN (green). Shown are representative images from male WT mice and 5xFAD mice injected with WT or 5xFAD brain homogenate. Scale bar represents 50 μm.
- Quantification of BrdU‐positive cells in the dentate gyrus of WT and 5xFAD mice injected with WT or 5xFAD homogenate. Each symbol represents data from one mouse, with six to eight mice per group. Data are presented as mean ± s.e.m. Significant differences were determined by one‐way ANOVA followed by Tukey's multiple comparison test, F(3, 24) = 9.665 (***P = 0.0004, **P = 0.003, **P = 0.003).
- Quantification of and BrdU/NeuN double‐positive cells in the dentate gyrus of WT and 5xFAD mice injected with WT or 5xFAD homogenate. Each symbol represents data from one mouse, with six to eight mice per group. Data are presented as mean ± s.e.m. Significant differences were determined by one‐way ANOVA followed by Tukey's multiple comparison test, F(3, 24) = 18.11 (***P < 0.0001).
- Fluorescence microscopy of PCNA (green), Tbr2 (purple), and DAPI (blue). Shown are representative images of hippocampi from male WT mice and 5xFAD mice either injected with WT or 5xFAD brain homogenate. White arrowheads and inserts indicate double‐positive cells. Scale bar represents 100 μm in the overview and 20 μm in the insert.
- Quantification of Ki67‐positive cells in the dentate gyrus of 4‐month‐old WT and 5xFAD mice injected with WT or 5xFAD homogenate. Each symbol represents data from one mouse, with four to five mice per group. Data are presented as mean ± s.e.m. Significant differences were determined by the Kruskal–Wallis test followed by Dunn's multiple comparison test (*P = 0.04).
- Quantification of PCNA‐positive cells in the dentate gyrus of 4‐month‐old WT and 5xFAD mice injected with WT or 5xFAD homogenate. Each symbol represents data from one mouse, with five to six mice per group. Data are presented as mean ± s.e.m. Significant differences were determined by the Kruskal–Wallis test followed by Dunn's multiple comparison test (**P = 0.0071).
- Percentage of PCNA‐positive cells coexpressing the astrocytic marker GFAP, microglial marker Iba1 or neuronal marker Tbr2.
In order to prove that the decline of DCX‐positive cells in the SGZ is not caused by the injection itself but instead is rather a direct consequence of the induced Aβ deposits, we performed a time‐course experiment. First signs of Aβ plaques were already evident 6 weeks post‐injection and increased significantly with time, while no Aβ plaques were observed at an earlier time‐point (Fig EV2A and B). This finding confirms in 5xFAD mice the previously described phenomenon that Aβ seeding is a time‐dependent process (Meyer‐Luehmann et al, 2006). Strikingly, neurogenic capacity as well as proliferation dramatically decreased during the course of Aβ seeding (Fig EV2C–E), further corroborating the direct effect of induced Aβ depositions on adult hippocampal neurogenesis.
Figure EV2. Aβ seeding is a time‐dependent process.
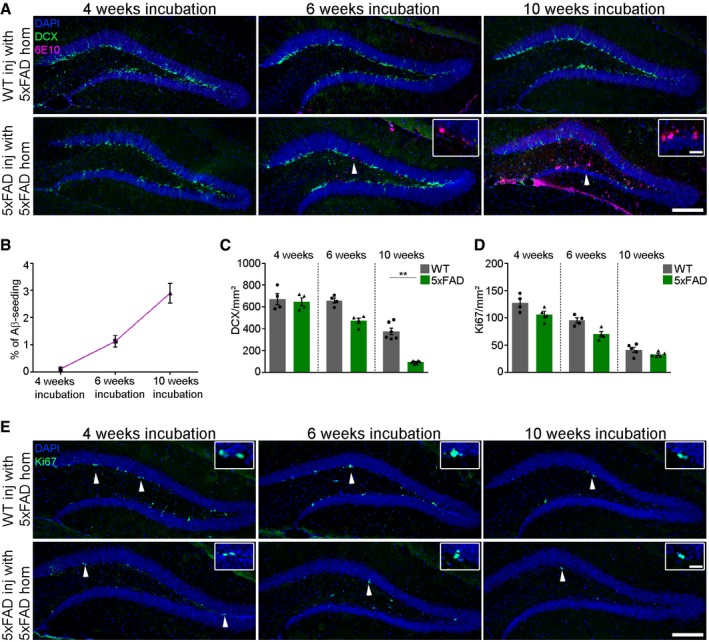
- Fluorescence microscopy of Aβ plaques (6E10, purple), DCX (green), and DAPI (blue). WT (upper) and 5xFAD (lower) mice were injected with 5xFAD brain homogenate and incubated for 4, 6, or 10 weeks. White arrowheads indicate the presence of seed‐induced Aβ deposits. Scale bar represents 100 μm in the overview and 20 μm in the insert.
- Quantification of Aβ load in the dentate gyrus of WT and 5xFAD mice 4, 6, or 10 weeks post‐injection. Five mice per group and 10 sections per mouse were examined. Data are presented as mean ± s.e.m.
- Quantification of DCX‐positive cells in the dentate gyrus of WT and 5xFAD mice. Each symbol represents data from one mouse, with four to five mice per group. Ten sections per mouse were examined. Data are presented as mean ± s.e.m. Significant differences were determined by the Mann–Whitney test (**P = 0.002).
- Quantification of Ki67‐positive cells in the dentate gyrus of WT and 5xFAD mice. Each symbol represents data from one mouse, with four to five mice per group. Ten sections per mouse were examined. Data are presented as mean ± s.e.m.
- Fluorescence microscopy of Ki67 (green) and DAPI (blue). WT (upper) and 5xFAD (lower) mice were injected with 5xFAD brain homogenate and incubated for 4, 6, or 10 weeks. White arrowheads indicate proliferating cells in the dentate gyrus. Scale bar represents 100 μm in the overview and 20 μm in the insert.
Next, we intended to study whether these alterations in neurogenesis are limited to the 5xFAD mouse model and included APP23 mice in our analysis, a mouse model that starts to develop plaques in the hippocampus at a much later time‐point (around 10 months of age; Sturchler‐Pierrat et al, 1997). We repeated the seeding experiments with APP23 mice to rule out the possibility that the effect of induced Aβ deposits on adult neurogenesis in 5xFAD mice was due to the mutant forms of presenilin (PS). Therefore, 6‐month‐old APP23 mice were injected into the hippocampus either with WT or APP23 brain homogenate and sacrificed 12 weeks thereafter (at 9 months of age; Fig EV3A). Again, similar to the results obtained in 5xFAD mice, massive Aβ depositions were found exclusively in mice that received Aβ‐containing brain homogenate (Fig EV3B and C). Likewise, the number of DCX‐positive cells was drastically reduced (Fig EV3D). Despite the lack of seeding activity in mice infused with WT homogenate, we observed a reduction in the number of proliferating cells in those mice as well, indicating that this drop in Ki67‐positive cell count could not be attributed to induced Aβ deposition but rather to the injection procedure itself (Fig EV3E). Nevertheless, these findings suggest that the immediate effect of induced amyloid deposits on adult neurogenesis is not influenced by mutations in PS1 and therefore not restricted to a single mouse model.
Figure EV3. Adult neurogenesis and induced Aβ deposits in the hippocampus of APP23 mice.
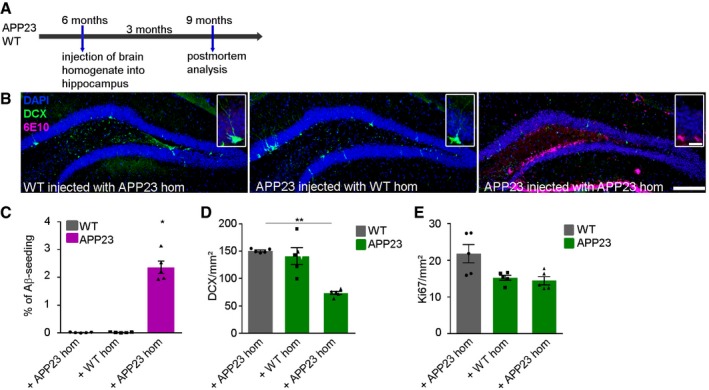
- Experimental setup for Aβ seeding experiments in WT and APP23 mice.
- Fluorescence microscopy of Aβ (6E10, purple), DCX (green), and DAPI (blue). Shown are representative images of 9‐month‐old male WT and APP23 mice either injected with WT or APP23 brain homogenate. Scale bar represents 100 μm in the overview and 20 μm in the insert.
- Quantification of Aβ load in the dentate gyrus of WT or APP23 mice injected with WT or APP23 brain homogenate. Each symbol represents data from one mouse, with five mice per group. Ten sections per mouse were examined. Data are presented as mean ± s.e.m. Significant differences were determined by the Kruskal–Wallis test followed by Dunn's multiple comparison test (*P = 0.01).
- Quantification of DCX‐positive cells in the dentate gyrus of 9‐month‐old WT and APP23 mice injected with WT or APP23 homogenate. Each symbol represents data from one mouse, with five mice per group. Ten sections per mouse were examined. Data are presented as mean ± s.e.m. Significant differences were determined by the Kruskal–Wallis test followed by Dunn's multiple comparison test (**P = 0.007).
- Quantification of Ki67‐positive cells in the dentate gyrus of WT and APP23 mice injected with WT or APP23 homogenate. Each symbol represents data from one mouse, with five mice per group. Ten sections per mouse were examined. Data are presented as mean ± s.e.m.
Cell death occurs in the vicinity of induced Aβ deposits
Since amyloid mouse models are often criticized because of their failure to exhibit proper neurodegeneration, it was of obvious interest to find out whether our inoculation model would be a suitable tool for modeling neurodegeneration. In the following, we investigated whether induced Aβ deposition was associated with neuronal cell death and apoptosis by quantifying the number of TUNEL‐positive cells and measuring activated caspase‐3 levels via immunoblotting. First, we performed cresyl violet stainings and observed a thinning of the whole GCL, indicating that cells might indeed be dying in the vicinity of seed‐induced Aβ deposits (Fig 3A black arrowheads and B). Closer examination using a TUNEL assay revealed significantly more counts of TUNEL‐positive cells within the seeded area that also correlated with the magnitude of seeding (Fig 3C–E), while no TUNEL‐positive cells were found in mice lacking seeding activities (Fig 3C and D). Noteworthy, caspase‐3 activity was only detectable in 5xFAD mice that had been injected with 5xFAD brain homogenate (Fig 3F), supporting the idea of selective cell death and hence neurodegeneration in the seeding area.
Figure 3. Neuronal cell death occurs in the vicinity of seed‐induced Aβ deposits.
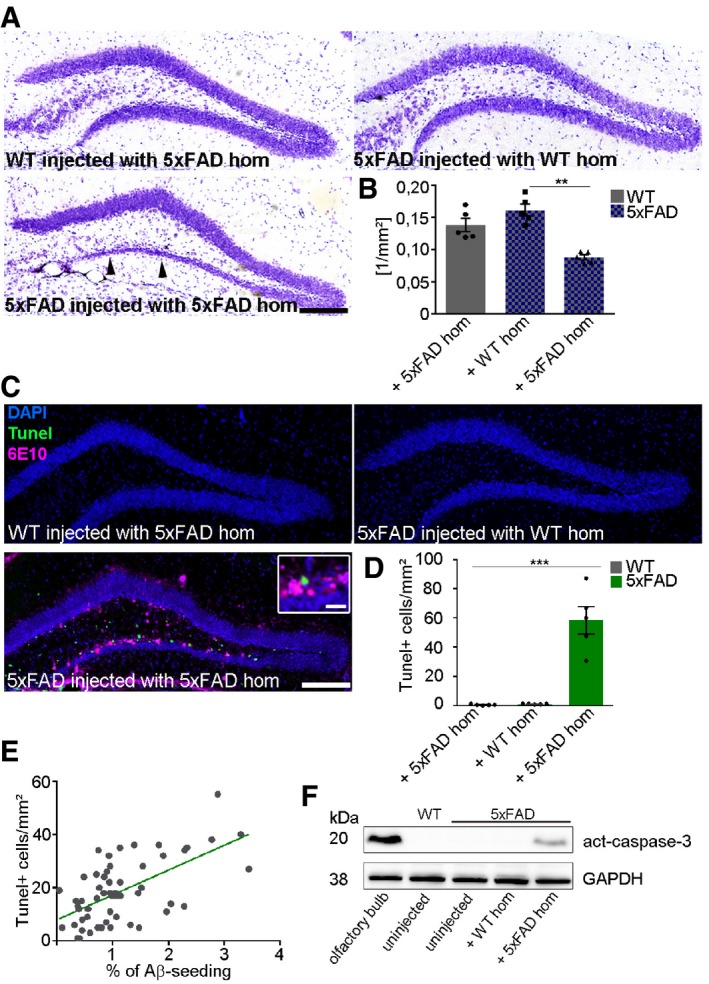
- Representative images of cresyl violet staining of 4‐month‐old WT mice injected with 5xFAD homogenate (upper left) and 5xFAD mice, injected with WT (upper right) or 5xFAD homogenate (lower left). Black arrowheads indicate neuronal loss in the granular cell layer. Scale bar represents 100 μm.
- Quantification of the area of the granular cell layer of 4‐month‐old WT and 5xFAD mice injected with WT or 5xFAD homogenate. Each symbol represents data from one mouse, with five mice per group. Data are presented as mean ± s.e.m. Significant differences were determined by the Kruskal–Wallis test followed by Dunn's multiple comparison test (**P = 0.004), F(2, 12) = 20.8.
- Fluorescence microscopy of TUNEL (green), 6E10 (purple), and DAPI (blue). Shown are representative images from male mice sacrificed at the age of 4 months. WT and 5xFAD mice were injected with WT or 5xFAD brain homogenate. Insert shows higher magnification. Scale bar represents 100 μm in the overview and 20 μm in the insert.
- Quantification of TUNEL‐positive cells in the dentate gyrus of WT or 5xFAD mice injected with WT or 5xFAD homogenate. Each symbol represents data from one mouse, with five to six mice per group. Data are presented as mean ± s.e.m. Significant differences were determined by one‐way ANOVA followed by Tukey's multiple comparison test (***P < 0.0001), F(2, 12) = 37.24.
- Pearson correlation between Aβ seeding area and TUNEL‐positive cells in the dentate gyrus of 4‐month‐old 5xFAD mice injected with 5xFAD homogenate (r = 0.6, P < 0.0001). Each symbol represents data from one section.
- Representative immunoblot of hippocampal homogenates for active caspase‐3 of 4‐month‐old WT and 5xFAD mice, uninjected, injected with WT or 5xFAD homogenate. Olfactory bulb homogenate was used as positive control for active caspase‐3.
To establish whether induced Aβ deposition would alter dendritic arborization of newborn neurons, we carried out a detailed analysis on dendritic morphology. By using confocal microscopy, we quantified the complexity of DCX‐positive dendrites. DCX‐positive cells in 5xFAD mice either uninjected or injected with WT homogenate maintained nicely elaborated dendrites with highly branched and complex dendritic trees. In contrast, DCX‐labeled cells in seeded 5xFAD mice exhibited shorter dendrite length, reduced dendrite number, and displayed less elaborated cells (Fig 4A–D). Overall, most of the DCX‐positive cells in seeded mice were morphologically impaired (73%; Fig 4E). These morphological alterations were only evident in the vicinity of seed‐induced Aβ deposits and absent in areas devoid of seeding (Fig 4A–D), emphasizing again the impact of induced Aβ deposits on neuronal maturation. In order to determine the functional significance of impaired neurogenesis and neurodegeneration, we performed whole‐cell patch‐clamp recordings of granule cells in acute slice preparations of the dentate gyrus (Fig 4F–H). In comparison with uninjected 5xFAD mice, granule cells of seeded 5xFAD animals displayed a reduced frequency of spontaneous inhibitory postsynaptic currents (IPSCs; Fig 4H). In contrast, the frequency of excitatory postsynaptic currents (EPSCs) measured at the reversal potential of IPSCs was unchanged, indicating a significant increase in the excitation/inhibition ratio in dentate gyrus granule cells of seeded 5xFAD animals (Fig 4H).
Figure 4. Seed‐induced Aβ deposits alter dendritic morphology.
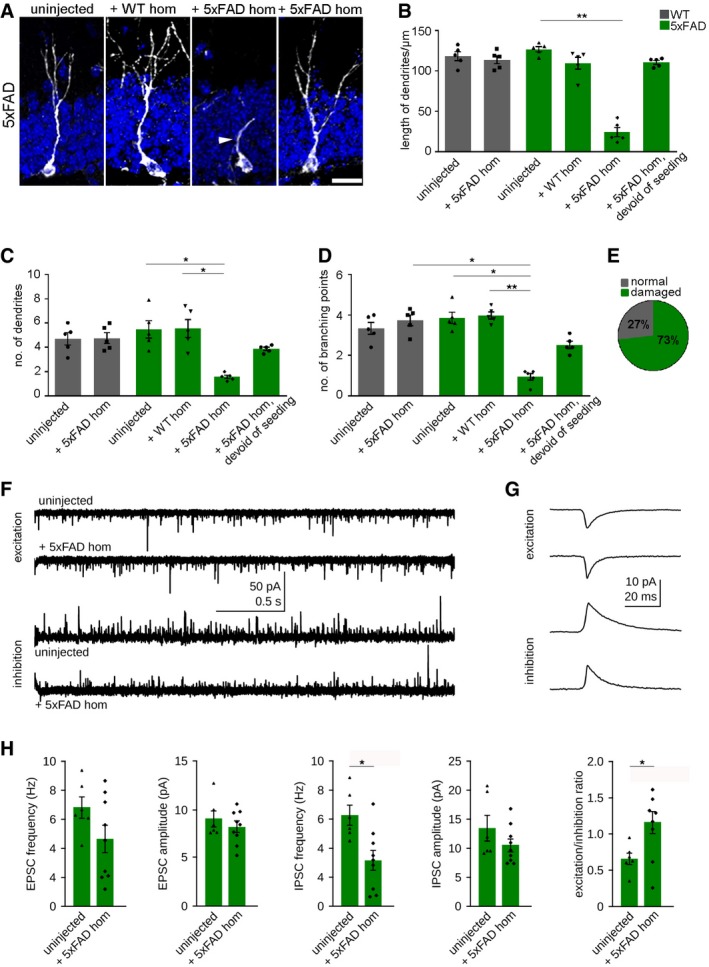
- Representative fluorescence confocal micrographs of newborn neurons labeled with DCX (white) of 4‐month‐old 5xFAD mice, uninjected (left), injected with WT (middle), or 5xFAD homogenate [in Aβ seeding area (middle) or devoid of seeding area (right)]. Scale bar represents 10 μm. The white arrowhead indicates an altered dendrite.
- Quantification of dendritic length of newborn DCX‐positive neurons. Each symbol represents data from one mouse, with five mice per group. Ten cells per mouse were examined. Data are presented as mean ± s.e.m. Significant differences were determined by the Kruskal–Wallis test followed by Dunn's multiple comparison test (**P = 0.001).
- Quantification of the number of dendrites of newborn neurons. Each symbol represents data from one mouse, with five mice per group. Ten cells per mouse were examined. Data are presented as mean ± s.e.m. Significant differences were determined by the Kruskal–Wallis test followed by Dunn's multiple comparison test (*P = 0.01).
- Quantification of the number of branching points of DCX‐labeled cells. Each symbol represents data from one mouse, with five mice per group. Ten cells per mouse were examined. Data are presented as mean ± s.e.m. Significant differences were determined by the Kruskal–Wallis test (*P = 0.01, *P = 0.02, **P = 0.005).
- Percentage of DCX‐positive cells with altered morphology in seeded 5xFAD mice.
- Examples of spontaneously occurring excitatory (top) and inhibitory (bottom) postsynaptic currents (EPSCs and IPSCs, respectively) in granule cells of uninjected and seeded 5xFAD mice.
- Average EPSC and IPSC waveforms obtained from the recordings shown in (F).
- Quantification of amplitude and frequency of EPSCs and IPSCs as well as excitation/inhibition ratio of uninjected and seeded 5xFAD mice. Six to nine neurons were examined in four mice. Data are presented as mean ± s.e.m. Significant differences were determined by the Mann–Whitney test (*P = 0.01).
We next aimed to generalize our findings and repeated the experiments with APP23 mice. Indeed, neuron loss can be found in both 5xFAD and APP23 mice (Fig EV4A and B), and APP23 mice injected with APP23 brain homogenate possessed TUNEL‐positive cells in the dentate gyrus that again correlated with the seeding area (Fig EV4C–E). DCX‐expressing cells in close contact with induced Aβ deposits developed concisions similar to the morphological changes found in 5xFAD mice (Fig EV4F–I). We thus conclude that seed‐induced Aβ deposits are able to drive neurodegeneration and induce neuronal maturation deficits independently of the mouse model used.
Figure EV4. Neuronal cell death and altered dendritic development in APP23 mice.
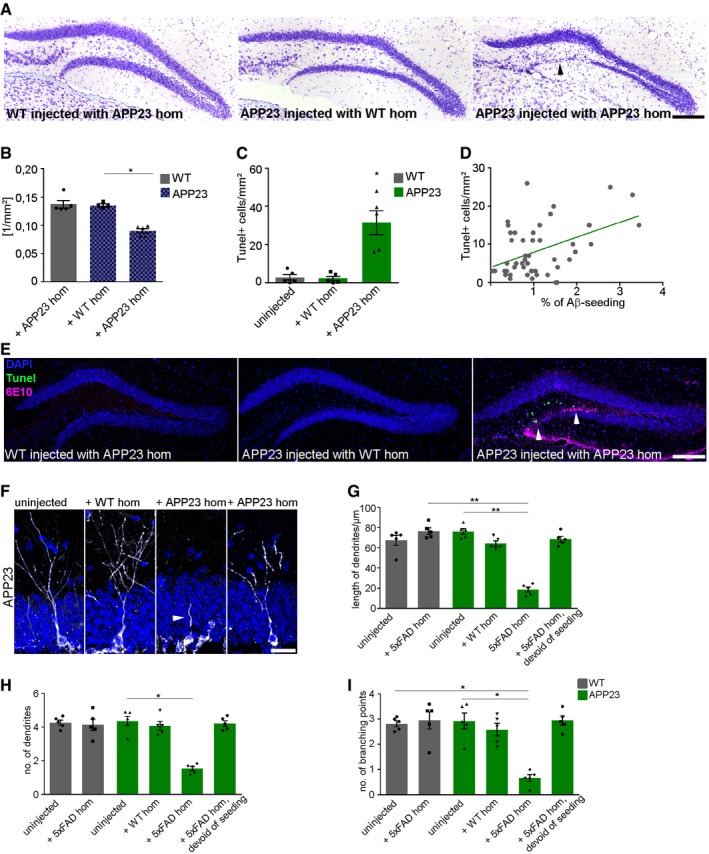
- Representative images of cresyl violet staining of 9‐month‐old WT and APP23 mice injected with WT or APP23 homogenate. Black arrowhead indicates neuronal loss in the granular cell layer. Scale bar represents 100 μm.
- Quantification of the area of the granular cell layer. Each symbol represents data from one mouse, with five mice per group. Ten sections per mouse were examined. Data are presented as mean ± s.e.m. Significant differences were determined by the Kruskal–Wallis test followed by Dunn's multiple comparison test (*P = 0.02).
- Quantification of TUNEL‐positive cells in the dentate gyrus of WT or APP23 mice injected with WT or APP23 homogenate. Each symbol represents data from one mouse, with five mice per group. Ten sections per mouse were examined. Data are presented as mean ± s.e.m. Significant differences were determined by the Kruskal–Wallis test followed by Dunn's multiple comparison test (*P = 0.02).
- Pearson correlation between Aβ seeding area and TUNEL‐positive cells in the dentate gyrus of 9‐month‐old APP23 mice injected with APP23 homogenate (r = 0.4, P = 0.001).
- Fluorescence microscopy of TUNEL (green), 6E10 (purple), and DAPI (blue). Shown are representative images of 9‐month‐old WT or APP23 mice injected with WT or APP23 homogenate. White arrowheads indicate TUNEL‐positive cells. Scale bar represents 100 μm.
- Representative fluorescent confocal images of newborn neurons labeled with DCX (white) in 9‐month‐old APP23 mice, uninjected (left), injected with WT (middle) or APP23 homogenate [within Aβ seeding area (middle) or devoid of seeding area (right)]. Scale bar represents 10 μm. The white arrowhead indicates an altered dendrite.
- Quantification of dendritic length of newborn neurons. Each symbol represents data from one mouse, with five mice per group. Ten cells per mouse were examined. Data are presented as mean ± s.e.m. Significant differences were determined by the Kruskal–Wallis test followed by Dunn's multiple comparison test (**P = 0.004, **P = 0.005).
- Quantification of the number of dendrites of newborn neurons. Each symbol represents data from one mouse, with five mice per group. Ten cells per mouse were examined. Data are presented as mean ± s.e.m. Significant differences were determined by the Kruskal–Wallis test followed by Dunn's multiple comparison test (*P = 0.02).
- Quantification of the number of branching points of DCX‐labeled cells. Each symbol represents data from one mouse, with five mice per group. Ten cells per mouse were examined. Data are presented as mean ± s.e.m. Significant differences were determined by the Kruskal–Wallis test followed by Dunn's multiple comparison test (*P = 0.02, *P = 0.01).
Exposure to environmental enrichment and voluntary running circumvents Aβ seeding, vivifies neurogenesis, and rescues apoptosis
Inspired by studies that report beneficial effects on adult hippocampal neurogenesis upon exposure to an environmental enrichment (EE; Kempermann et al, 1997, 1998) and voluntary running (van Praag et al, 1999a,b), we exposed seeded 5xFAD mice for 6 weeks to EE prior to the induction of Aβ deposition (4 weeks post‐injection, Fig EV2A and B) and compared them with seeded 5xFAD mice housed in standard cages (SH; Fig 5A). Assessment of the body weight at the end of either housing condition revealed similar values for both groups (Fig 5B). In accordance with the literature (Kempermann et al, 1997), uninjected control WT mice housed under standard conditions had significantly less DCX‐labeled cells, while in the respective uninjected 5xFAD mice, housing conditions had no effect on adult hippocampal neurogenesis (Fig 5C and E). Astonishingly, more cells immunoreactive for DCX were found in the group of 5xFAD mice that had been infused with 5xFAD brain homogenate and kept in EE (Fig 5C and E). Moreover, by quantifying Ki67‐positive cells, it was clearly evident that all groups of mice housed in EE had significantly more proliferation compared to their counterparts in SH (Fig 5F). Since an earlier study reported that exposure to EE reduces Aβ plaque burden in APP transgenic mice (Lazarov et al, 2005), we focused on the question whether EE could also prevent the induction of Aβ plaque formation in our model system. Intriguingly, Aβ seeding was detectable only to a lesser extent although it was not completely abolished (Fig 5C, white arrowheads). Stereological analysis confirmed the dramatic reduction in Aβ seeding in mice after their exposure to EE (Fig 5D). Given the positive effects of EE, we next tested whether the Aβ seeding‐dependent cell death and apoptosis could be reduced or even halted. Indeed, qualitative assessment of cresyl violet and TUNEL staining indicated a normalization and regeneration of the GCL (Fig 5G, black arrowheads, and Fig 5H) and a robust decrease in TUNEL‐positive cells (Fig 5I, white arrowheads, and Fig 5J), suggesting an overall beneficial effect of EE on the survival of neurons. These data further support the concept that physical exercise and enriched housing may play a significant role in modulating the onset and early phase of Aβ plaque pathology, thereby stimulating the survival and maturation of newborn neurons which culminates in the prevention of neurodegeneration.
Figure 5. EE diminishes Aβ seeding and stimulates adult hippocampal neurogenesis.
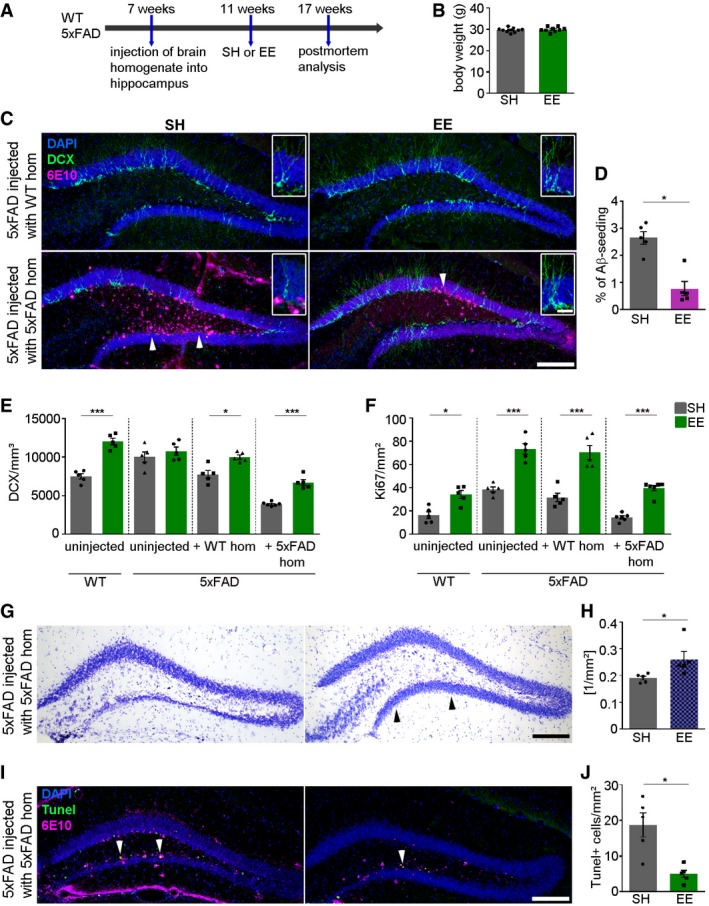
- Scheme of the experimental protocol for housing mice in SH or EE.
- Body weight of mice housed in SH or EE. SH, standard housing, EE, environmental enrichment. Each symbol represents data from one mouse with nine mice per group. Data are presented as mean ± s.e.m.
- Fluorescence microscopy of Aβ plaques (6E10, purple), DCX (green), and DAPI (blue). Shown are representative images from male mice sacrificed at the age of 4 months. 5xFAD mice were injected with WT or 5xFAD homogenate and housed under SH (left) or EE (right) conditions. White arrowheads indicate the presence of seed‐induced Aβ deposits. Inserts show higher magnifications. Scale bar represents 100 μm in the overview and 20 μm in the insert.
- Quantification of induced Aβ plaque load in dentate gyri of 5xFAD mice housed in SH or EE. Each symbol represents data from one mouse, with five mice per group. Data are presented as mean ± s.e.m. Significant differences were determined by the Mann–Whitney test (*P = 0.0159).
- Quantification of DCX‐positive cells in the dentate gyrus of WT and 5xFAD mice either uninjected or injected with WT or 5xFAD homogenate and housed under SH or EE conditions. Each symbol represents data from one mouse, with five to six mice per group. Data are presented as mean ± s.e.m. Significant differences were determined by one‐way ANOVA followed by Tukey′s multiple comparison test, F(7, 34) = 22.53 (***P < 0.0001, *P = 0.032, ***P < 0.0001).
- Quantification of Ki67‐positive cells in the dentate gyrus of WT and 5xFAD mice either uninjected or injected with WT or 5xFAD brain homogenate and housed under SH or EE conditions. Each symbol represents data from one mouse, with five mice per group. Data are presented as mean ± s.e.m. Significant differences were determined by one‐way ANOVA followed by Tukey′s multiple comparison test, F(7, 34) = 39.01 (*P = 0.0131, ***P = 0.0001, ***P = 0.0001, ***P = 0.0001).
- Representative images of cresyl violet staining of 5xFAD mice injected with Aβ‐containing brain homogenate housed in SH (left) or EE (right). Black arrowheads indicate the granule cell layer. Scale bar represents 100 μm.
- Quantification of the area of the granular cell layer of 5xFAD mice injected with 5xFAD brain homogenate housed in SH or EE. Each symbol represents data from one mouse, with five mice per group. Data are presented as mean ± s.e.m. Significant differences were determined by the Mann–Whitney test (*P = 0.0159).
- Fluorescence microscopy of TUNEL (green), 6E10 (purple), and DAPI (blue). Shown are representative images from seeded 5xFAD mice exposed to SH (left) or EE (right). White arrowheads indicate the presence of TUNEL‐positive cells. Scale bar represents 100 μm.
- Quantification of TUNEL‐positive cells in the dentate gyrus of 5xFAD mice injected with 5xFAD homogenate housed in SH or EE. Each symbol represents data from one mouse, with five mice per group. Data are presented as mean ± s.e.m. Significant differences were determined by the Mann–Whitney test (*P = 0.0159).
Environmental stimuli restore memory deficits and activate phagocytic microglia
Spatial learning and memory abilities were assessed in mice of all different groups by the Morris Water Maze test. Since adult neurogenesis appears to be specifically relevant for reversal learning (Dupret et al, 2008; Garthe et al, 2009; Garthe & Kempermann, 2013), a combined water maze protocol was used that included additionally a platform reversal after animals learned to navigate to a given position. Neither the genotype nor the intracerebral injection procedure had an effect on the escape latency during the learning phase (Fig 6A), although seeded 5xFAD mice showed a trend that did not reach significance toward impaired reversal learning (Fig 6C), seeded 5xFAD mice spent significantly less time in the target quadrant when compared to non‐injected WT or 5xFAD mice or mice that had been injected with brain homogenate (Fig 6B and D). This memory impairment was completely reversed when seeded 5xFAD mice had been housed in an enriched environment before being tested in the Morris Water Maze (Fig 6B and D). Because the swim speed of the mice (Fig 6E) and the time to reach the visible platform (latency to platform; Fig 6F) were comparable in all groups tested, it is unlikely that the observed differences in escape latencies were caused by differences in locomotor abilities, motivation, or visual performance.
Figure 6. EE reverses memory deficits in seeded 5xFAD mice.
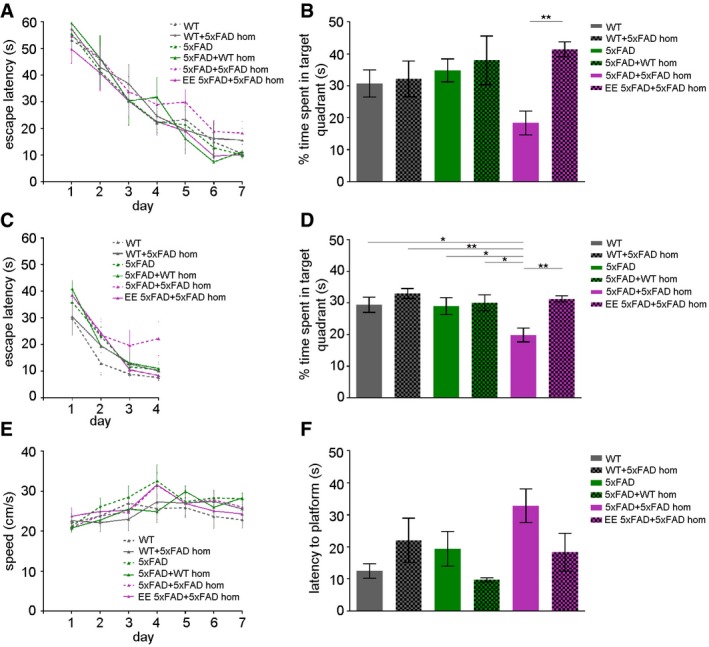
- Escape latency to find the hidden platform in the Morris Water Maze test in WT and 5xFAD mice uninjected, injected with WT homogenate or with 5xFAD homogenate and exposed to SH or EE. Mice were trained daily with four trials until day 7 (n = 6–9). Latency to reach the platform decreased in every group as the training sessions progressed. Data are presented as mean ± s.e.m.
- Spatial memory retention was evaluated 24 h after the last training day (n = 6–9). Time spent searching for the target quadrant in the probe test (on days 8). Data are presented as mean ± s.e.m. Significant differences were determined by one‐way ANOVA followed by Tukey's multiple comparison test, F(5, 38) = 4.189 (**P = 0.018).
- Latency to reach the platform during the reversal phase of the Morris Water Maze task of WT and 5xFAD mice uninjected, injected with WT homogenate or with 5xFAD homogenate and exposed to SH or EE. Mice were trained daily with four trials per day from day 9 to day 12 (n = 6–9). Latency to reach the platform decreased in every group as the training sessions progressed. Data are presented as mean ± s.e.m.
- Time spent in each quadrant during a single probe trial following reversal training. Data are presented as mean ± s.e.m. Significant differences were determined by one‐way ANOVA followed by Tukey's multiple comparison test, F(5, 39) = 5.253 (*P = 0.027, **P = 0.0017, *P = 0.027, *P = 0.024, **P = 0.0023).
- Swim speed in the Morris Water Maze test of all groups during the learning phase (n = 6–9). Data are presented as mean ± s.e.m.
- Latency to reach the visible platform to test for visual ability and motivation of all mice. Data are presented as mean ± s.e.m. Significant differences were determined by one‐way ANOVA, F(5, 38) = 2.389.
Finally, we asked the question to which extent microglia may be relevant for diminished seeding activity after EE and voluntary running (Meyer‐Luehmann & Prinz, 2015). Recent studies showed that exposure to EE can have a pivotal role for microglia activation and maintenance of adult neurogenesis that was dependent on the presence of PS mutations (Ziv et al, 2006; Choi et al, 2008). Therefore, we hypothesized that Aβ seeding was alleviated after EE exposure through effective phagocytosis performed by activated microglia. To identify microglia, we first used immunofluorescent labeling with the antibody Iba1 and quantified the cell number of Iba1‐positive microglia in the dentate gyrus. Consistent with the above‐mentioned studies, WT mice housed in EE had significantly higher numbers of Iba1‐positive cells compared to WT mice in SH, while this effect was not apparent in 5xFAD transgenic mice most likely due to multiple mutations in PS (Fig 7B). Compared to control mice, there was a significant increase in the number of microglia (Iba1 positive) in the dentate gyri of 5xFAD mice that had been injected with 5xFAD brain homogenate and kept in the EE (Fig 7A and B). Upon closer examination, we detected numerous fluorescently labeled Aβ particles within the processes and soma of microglia especially under EE condition (Fig 7C). These microglia had characteristic features of activated cells, such as enlarged soma with shorter processes, traditionally associated with increased phagocytic capacity. Quantitative assessment of CD68 immunoreactivity revealed indeed a significant increase in seeded 5xFAD mice after housing in EE compared to mice in SH (Fig 7D and E). Comparably, a higher percentage of cells were double positive for Iba1 and CD68, indicative of more phagocytic microglia, as well as a more intense CD68‐positive signal per microglia cell was evident in higher magnification confocal images (Fig 7F and G). Next, we analyzed the phagocytic capacity of microglia in vivo by administering intraperitoneally methoxy‐XO4 3 h before microglial cells were isolated and further analyzed for methoxy‐XO4 fluorescence by flow cytometry. FACS dot plots and respective histograms from uninjected WT and seeded 5xFAD mice housed in SH or EE (Fig EV5A–C) revealed a significant increase in Aβ phagocytosis in seeded 5xFAD mice exposed to EE (Fig 7H and I). This increased uptake of methoxy‐XO4 labeled Aβ was associated with a slightly enhanced yet not significant CD36 expression (Fig 7J and K) and a significantly enhanced CD45 expression in plaque‐associated microglia (Fig 7L and M). Postmortem examination of Iba1‐positive microglia confirmed methoxy‐XO4 uptake as well as CD45 expression (Fig EV5D and E). Thus, EE may activate microglia with greater Aβ‐clearing capabilities that diminished Aβ seeding.
Figure 7. EE increases microglial density and phagocytic activity.
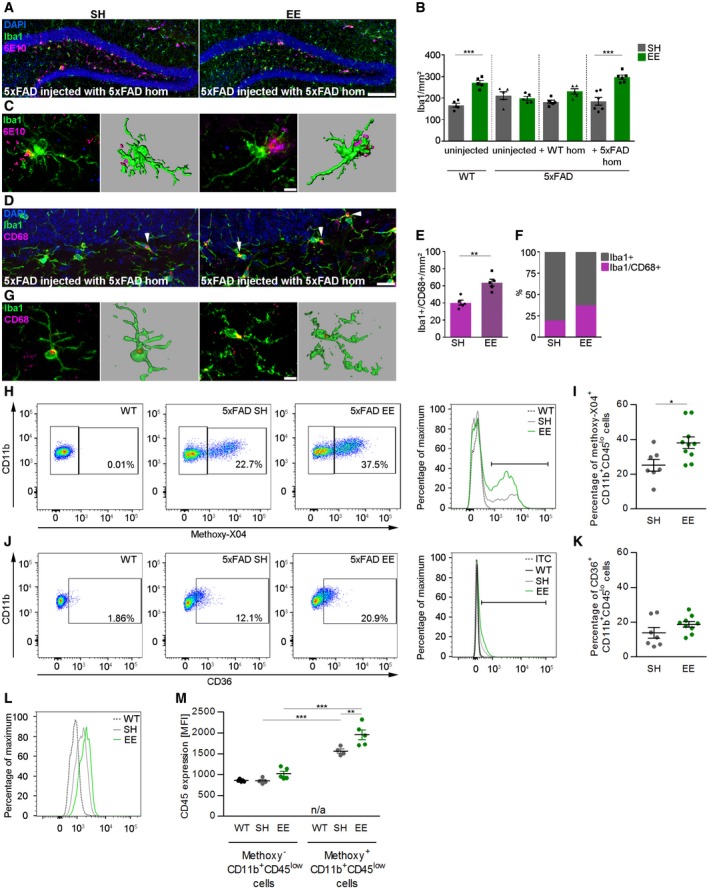
- Fluorescence microscopy of Aβ plaques (6E10, purple), Iba1 (green), and DAPI (blue). Shown are representative images from seeded 5xFAD mice sacrificed at the age of 4 months. Mice were either housed in SH (left) or EE (right). Scale bar represents 100 μm.
- Quantification of Iba1‐positive cells in the dentate gyrus of WT and 5xFAD mice either uninjected or injected with WT or 5xFAD homogenate and housed under SH or EE conditions. Each symbol represents data from one mouse, with five to six mice per group. Data are presented as mean ± s.e.m. Significant differences were determined by one‐way ANOVA followed by Tukey's multiple comparison test, F(7, 34) = 13.48 (***P < 0.0001).
- Confocal images of microglial cells in the dentate gyrus of 5xFAD mice injected with Aβ‐containing brain homogenate and Imaris reconstruction of Iba1‐positive cells. Scale bar represents 10 μm.
- Fluorescence microscopy of Iba1 (green) and CD68 (purple). Shown are representative images from seeded 5xFAD mice. Mice were either housed in SH (left) or EE (right). White arrowheads indicate double‐positive cells. Scale bar represents 20 μm.
- Quantification of Iba1/CD68 double‐positive cells in the dentate gyrus of 5xFAD mice injected with Aβ‐containing brain homogenate. Each symbol represents data from one mouse, with five mice per group. Data are presented as mean ± s.e.m. Significant differences were determined by the Mann–Whitney test (**P = 0.008).
- Percentage of Iba1‐ and CD68‐positive cells in the dentate gyrus of 5xFAD mice injected with Aβ‐containing brain homogenate. Ten sections per mouse and five mice per group were examined.
- Confocal images of microglia double labeled with Iba1 and CD68. Imaris reconstruction of Iba1‐positive cells. Scale bar represents 10 μm.
- Representative FACS dot plots (left) and cytometry graphs (right) from uninjected WT or seeded 5xFAD mice housed in SH or EE are shown.
- Quantification of the percentage (%) of methoxy‐XO4 CD11b+CD45low hippocampal microglial cells by flow cytometry isolated from seeded 5xFAD mice either housed in SH or EE 3 h after the injection of methoxy‐XO4. Each symbol represents data from one mouse, with 7–10 mice per group. Data are presented as mean ± s.e.m. Significant differences were determined by the Mann–Whitney test (*P = 0.01).
- Representative FACS dot plots (left) and cytometry graphs (right) for CD36 from uninjected WT or seeded 5xFAD mice housed in SH or EE are shown.
- Quantifications of the percentages (%) of CD36 positively labeled microglial cells are depicted. Each symbol represents data from one mouse, with 7–10 mice per group. Data are presented as mean ± s.e.m.
- Representative cytometry graph for CD45 on microglia from uninjected WT or seeded 5xFAD mice housed in SH or EE is shown.
- Quantifications of the expression (MFI) of CD45 from methoxy‐O4‐positive and methoxy‐O4‐negative CD11b+CD45lo microglial cells are depicted. Each symbol represents data from one mouse, with four to five mice per group. Data are presented as ±s.e.m. Significant differences were determined by two‐way ANOVA followed by Bonferroni's multiple comparison test, F(2, 11) = 458.9 (**P = 0.0007, ***P < 0.0001).
Figure EV5. Analysis of phagocytic microglia after exposure to EE.
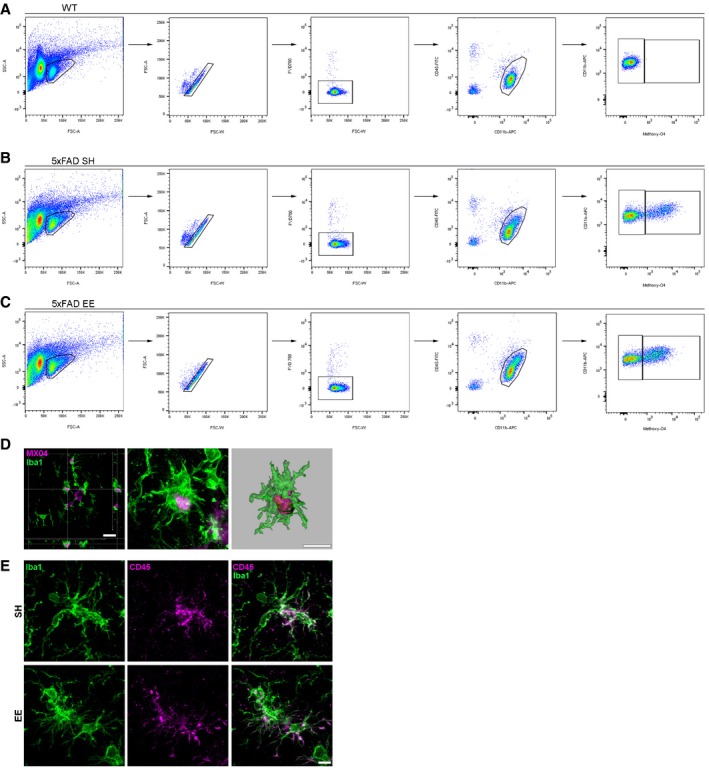
- Gating strategy for flow cytometric analysis of single viable CD11b+ CD45lo methoxy‐04− and single viable CD11b+ CD45lo methoxy‐04+ microglia from 4‐month‐old WT mice.
- Gating strategy for flow cytometric analysis of single viable CD11b+ CD45lo methoxy‐04− and single viable CD11b+ CD45lo methoxy‐04+ microglia from 4‐month‐old 5xFAD mice housed in SH. SH, standard housing.
- Gating strategy for flow cytometric analysis of single viable CD11b+ CD45lo methoxy‐04− and single viable CD11b+ CD45lo methoxy‐04+ microglia from 4‐month‐old seeded 5xFAD mice housed in EE. EE, environmental enrichment. FSC, forward scatter. SSC, side scatter. FVD780, fixable viability dye 780.
- Confocal pictures and Imaris reconstruction of microglial cells labeled with Iba1 (green) with phagocytosed methoxy‐XO4 (purple)‐positive Aβ material. Scale bar represents 20 (left) and 10 μm (right).
- Representative confocal images of microglial cells labeled with Iba1 (green) and CD45 (purple) of 4‐month‐old seeded 5xFAD mice housed in SH or EE. Scale bar represents 10 μm.
Together, these findings demonstrate that seed‐induced Aβ deposits are capable to elicit a pathogenic cascade that leads to impaired neurogenesis, pronounced neurodegeneration, and memory deficits all of which is counteracted by EE and voluntary physical activity most likely through the abundance of phagocytic microglia.
Discussion
Adult neurogenesis is critically involved in learning and memory and seems to be altered under disease conditions. Here, we discuss our findings in the context of previous work on Aβ associated pathology and present an integrative view on the consequences of seed‐induced Aβ depositions. In this study, we provide evidence that seed‐induced Aβ deposits evoke a pathogenic cascade leading to aberrant adult neurogenesis and pronounced neurodegeneration in two independent mouse models of AD. Furthermore, we uncovered a possible link between seeded Aβ deposits and EE, with seed‐induced Aβ plaques being especially sensitive to the lifestyle factor EE as well as voluntary exercise.
Studies on the effect of Aβ pathology on neural progenitor proliferation in the hippocampus of transgenic mice have produced different outcomes, with either an increase or decrease in neurogenesis (Zhang et al, 2007; Ermini et al, 2008; Demars et al, 2010; Moon et al, 2014). We found a significant increase in neurogenesis and cell proliferation in pre‐depositing 5xFAD at 4 months of age. This increase in neurogenesis may reflect a compensatory mechanism to the onset of developing Aβ pathology and the loss of neurons, as has been reported before for patients (Jin et al, 2004b). In contrast, we found reduced hippocampal neurogenesis and cell proliferation in aged 8‐month‐old 5xFAD mice with higher endogenous plaque load. This result is consistent with the findings of Ermini et al (2008), leading to the assumption that disease progression impairs adult hippocampal neurogenesis.
These data raise the question as to whether Aβ plaques directly alter adult neurogenesis. With its unique distribution in the dentate gyrus (Meyer‐Luehmann et al, 2006), the pattern of seeded Aβ plaques is predestined to directly link Aβ pathology to adult neurogenesis. Importantly, the full extent of seed‐induced Aβ plaques was evident in both mouse models at an age when APP transgenic mice are still devoid of endogenous plaques in the dentate gyrus but display increased adult neurogenesis as mentioned above. We provide several lines of evidence implicating Aβ plaques as the main culprit in the process of adult neurogenesis and neurodegeneration. First, Aβ plaques might directly affect adult hippocampal neurogenesis as we were able to detect a significant inverse correlation between seeded Aβ deposits and DCX‐positive cells in the hippocampus of 5xFAD and APP23 transgenic mice. Second, the morphology of immature neurons was dramatically changed mainly in the Aβ seeding area to shorter dendritic length, reduced dendrite numbers, and branching points altogether leading to an excitatory/inhibitory synaptic imbalance. Besides an imbalance of synaptic input, increased excitability of hippocampal cells could also occur due to increased intrinsic excitability as has been described before (Busche et al, 2008). A more in‐depth analysis of action potential responses would provide evidence for such an intrinsic hyperexcitability. Third, time‐course experiments clearly support this notion as we observed significant differences in the number of DCX‐positive cells only after longer incubation times and after Aβ seeding occurred. Lastly, seeded Aβ deposits induced pronounced neuronal cell death that was ascertained by the thinning of the GCL, the presence of numerous TUNEL‐positive cells, and higher activated caspase‐3 levels, indicating that it was not a prefibrillar form of Aβ nor an oligomeric species but rather the seed‐induced Aβ plaque itself that was toxic to neurons and that altered the maturation of newborn neurons. This is in line with our own previous findings (Meyer‐Luehmann et al, 2008, 2009) and suggests that Aβ plaques most likely act in concert with the penumbra of Aβ oligomers (Meyer‐Luehmann et al, 2008; Shankar et al, 2008; Koffie et al, 2009), trigger neurodegeneration, and alter adult neurogenesis. The observation that the majority of TUNEL‐positive cells were located in the SGZ and stained positive for calretinin (data not shown) may indicate that the survival of newborn neurons is affected and that predominantly those immature neurons undergo apoptosis (Brandt et al, 2003). Therefore, we established an Aβ injection model that can be used as a valuable and reliable tool for further studies on neurodegeneration.
Previous work has demonstrated beneficial effects of voluntary running and EE on Aβ plaque pathology (Lazarov et al, 2005; Hu et al, 2010) as well as on cell proliferation and adult hippocampal neurogenesis (Kempermann et al, 1997; van Praag et al, 1999b; Brown et al, 2003; Hu et al, 2010), although no mechanistic explanation of these observations was presented. We hence set out to investigate the link between Aβ plaques and adult neurogenesis upon EE conditions, specifically whether EE and voluntary running are sufficient to arrest Aβ seeding and if so, which mechanism might be involved. Indeed, seeded 5xFAD mice exposed to EE showed significantly less pronounced Aβ seeding compared to those housed in SH, although the seeding activity was not completely abolished, indicating that the formation of Aβ plaques was diminished. It still remains an open question if earlier exposure to EE, for example, at the time of the injection would completely prevent Aβ seeding.
In agreement with other studies, the number of proliferating neural precursor and progenitor cells strongly increased in seeded 5xFAD mice after exposure to EE and physical activity. Two scenarios have been previously discussed in the literature that might possibly account for this observation: either more stem cell recruitment or reduced cell death (Overall et al, 2016). Our data support the latter hypothesis, as we found less TUNEL‐positive cells in those mice. It seems likely that adult neurogenesis and neurodegeneration deficits in seeded mice were rescued upon EE due to the lesser extent of Aβ seeding. However, we need to take into consideration that PS1 mutations can circumvent the beneficial effects of EE (Choi et al, 2008), and thus, we cannot exclude that the results obtained in this study are influenced by mutations in the PS1 gene as well.
Given that seed‐induced pathologies were most severe in the hippocampus, we performed the hippocampus‐dependent Morris Water Maze test to determine potential cognitive deficits. Consistent with the literature, we found that uninjected 5xFAD mice and age‐matched WT control mice performed equally well in the Water Maze test. These APP transgenic mice used are known to exhibit impairments in hippocampus‐dependent memory formation only at a later age (at 6 months of age; Oakley et al, 2006; Kimura & Ohno, 2009; Ohno, 2009; Jawhar et al, 2012). Aβ seeding though triggered not only Aβ and associated pathologies, but it also lowered significantly hippocampal cognitive performance of these mice, establishing this injection‐based model as a reliable tool to study therapeutic strategies. EE as a non‐pharmacological intervention had indeed beneficial effects on cognition and reversed memory deficits in seeded 5xFAD mice.
Exposure of mice to EE has a pivotal role for microglia activation and maintenance of adult neurogenesis because induced hippocampal neurogenesis by EE was associated with recruitment and activation of microglia cells (Ziv et al, 2006; Choi et al, 2008). The number of microglia was increased in WT mice as expected (Xu et al, 2016) but was unaffected in 5xFAD transgenic mice in accordance with the claim that the capability of microglia to respond to EE is dependent on the presence or absence of PS1 mutations (Choi et al, 2008). Only 5xFAD mice which had been injected with 5xFAD brain homogenate and subsequently exposed to EE revealed higher numbers of Iba1‐ and CD68‐positive cells despite the existence of PS1 mutations in those mice. Furthermore, our Aβ phagocytosis data strongly argue for the following: due to exposure to EE, more microglia cells are activated and capable of Aβ phagocytosis, finally leading to less Aβ seeding. Thus, our data highlight the interrelation between microglia and their mode of action and induced Aβ deposition in an amyloid‐reducing approach.
Taken together, our results demonstrate that cell proliferation, adult neurogenesis, neurodegeneration, and Aβ seeding are dynamic processes, which can be influenced and reversed by a non‐pharmacological approach such as EE. Future studies could help elucidate whether lifelong physical exercise can improve cognition and delay the onset of neurodegenerative diseases such as AD.
Material and Methods
Animals
We used heterozygous 5xFAD transgenic mice coexpressing human APPK670N/M671L (Sw)+I716V (Fl)+V717I(Lo) and PS1M146L+L286V under the control of the neuron‐specific Thy‐1 promoter (Oakley et al, 2006) and heterozygous APP23 transgenic mice expressing human APPK670N (Sturchler‐Pierrat et al, 1997). We backcrossed heterozygous 5xFAD and APP23 mice to C57BL/6 mice to generate heterozygous 5xFAD or APP23 mice and non‐transgenic littermates. All mice were on a C57BL/6 background. For the present study, only male mice were used because female mice have a faster and earlier onset of Aβ plaque formation. To minimize variability and reduce sample size, only one gender was used. Animals were group‐housed under specific pathogen‐free conditions. Mice were kept under a 12‐h light, 12‐h dark cycle with food and water ad libitum. All animal experiments were carried out in accordance with the policies of the state of Baden‐Württemberg under license number G13‐093 and G15‐123.
Preparation of brain homogenates for intracerebral injections
Mouse brain homogenates were derived from 10‐month‐old plaque‐bearing heterozygous 5xFAD transgenic mice and age‐matched non‐transgenic littermates or from a 21‐month‐old APP23 transgenic mouse. Homogenates were obtained from the whole mouse brain. Brain tissue samples were fresh‐frozen and stored at −80°C until use. Samples were homogenized in sterile phosphate‐buffered saline (PBS) at 10% (w/v) and sonicated 3 × 5 s (30% amplitude, Digital Sonifier W‐250D, Branson Ultrasonics). The crude brain homogenate was centrifuged for 5 min (at 3,000 g, 4°C), and the supernatant was stored at −80°C until use.
Intracerebral stereotactic injections
Mice were anesthetized via intraperitoneal injection of a mixture of ketamine (100 mg/kg body weight) and xylazine (10 mg/kg body weight) in saline. For bilateral stereotactic injections of brain homogenates, a Hamilton syringe was placed into the hippocampus (AP – 2.3 mm; L ±2.0 mm; DV – 2.0 mm), as described previously (Bachhuber et al, 2015) of 7‐week‐old male 5xFAD mice or 6‐month‐old APP23 mice. Mice were either injected with 5xFAD transgenic brain homogenate or WT brain homogenate (2.5 μl per hemisphere at an injection speed of 1.25 μl/min) or were uninjected controls. After each injection, the needle was kept in place for additional 2 min before it was slowly withdrawn. The surgical site was cleaned with sterile saline and the incision sutured. Mice were monitored until recovery from anesthesia and incubated either for 4, 6, or 10 weeks (5xFAD) and 12 weeks (APP23).
BrdU administration
For detection of slow dividing cells in the adult SGZ, 5‐bromo‐2‐deoxyuridine (BrdU; Sigma, B5002) was given in the drinking water (1 mg/ml) 6 weeks post‐injection for 2 weeks. BrdU solution was prepared in sterile water, protected from light exposure, and changed once a week. Then, BrdU was replaced with normal water for 2 weeks and mice were perfused after BrdU treatment was stopped.
Histology
Mice were transcardially perfused with 20 ml of ice‐cold PBS followed by 20 ml of ice‐cold 4% paraformaldehyde in PBS. Brains were isolated and postfixed in 4% PFA (Roti®‐Histofix, Roth) for 24 h, followed by incubation in 30% sucrose (in PBS, pH 7.5) for a further 48 h. Frozen brains were cut into 25‐μm‐thick coronal sections on a sliding microtome (SM2000R, Leica Biosystems, Wetzlar, Germany) and collected in PBS. Immunohistochemistry was performed using the following antibodies diluted in PBS containing 5% normal goat serum and 0.5% Triton X‐100: anti‐doublecortin (rabbit, DCX; 1:5,000, abcam, ab18723), anti‐Ki67 (rabbit, 1:500, abcam, ab15580), anti‐PCNA (mouse, 1:1,000, DAKO), anti‐Iba1 (rabbit, 1:3,000, Wako, 019‐19741), anti‐GFAP (mouse, 1:1,000, Sigma‐Aldrich, GA5), anti‐calretinin (mouse, 1:200; Swant, 6B3), anti‐Tbr2 (rabbit, 1:300, abcam, ab23345), anti‐Aβ (mouse, 1:3,000, Covance, 6E10), anti‐CD68 (rat, 1:500, Bio‐Rad, FA11), CD45 (rat, abcam 1:500), NeuN (mouse, Millipore, 1:200, MAB377), BrdU (rat, AbDSerotec, 1:200, OBT00030). Appropriate secondary antibodies conjugated to Alexa 488 or 555 (1:1,500) were used. For PCNA, pretreatment with citrate buffer for 20 min on 80°C was performed. For BrdU staining, sections were pre‐treated with 2 N HCl at 37°C for 30 min before starting the staining protocol. To detect apoptosis, a commercially available fluorescent terminal deoxynucleotidyl transferase nick‐end labeling kit (TUNEL) was used, according to the manufacturer's protocol (Roche Diagnostics Corporation, Indianapolis, IN, USA). As a positive control, sections were incubated with recombinant DNase I. Some additional sections were double labeled, and first antibody staining was done, followed by labeling with the TUNEL kit. Cresyl violet and Thiazinred (Sigma, T3272) stainings were done according to standard protocols. Sections were counterstained with DAPI (Sigma, D9542, 1:10,000) and mounted with fluorescence mounting medium (DAKO, S3023).
Assessment of Aβ and cell analysis
Fluorescence images of brain slices were taken using a Zeiss fluorescent microscope (Axio Imager M2M). For analysis, every tenth brain section of one hemisphere was immunostained. The area of the dentate gyrus was defined based on the mouse brain atlas (Paxinos & Franklin, 2001). Total Aβ load was determined by calculating the percent areal fraction occupied by Aβ‐positive staining in the dentate gyrus using the imaging software ImageJ (National Institutes of Health freeware); 5–6 animals per group and 10 sections per animal were analyzed.
Cell number was quantified by counting the number of positive labeled cells in the whole dentate gyrus of the animals; 5–6 animals per group and 10 sections per animal were analyzed. Cell counting was done in the dentate gyrus, and the area of the dentate gyrus was measured with the ImageJ software. All analyses were conducted in a blinded manner. For the correlation of the seeding area with TUNEL‐ or DCX‐positive cells, only sections with seed‐induced Aβ deposits were included in the analysis. Each data point represents one section in the histogram. Analysis of dendrites was performed as previously described (He et al, 2014). Confocal images of 10 DCX‐positive cells in the dentate gyrus per animal were taken with an Olympus confocal microscope (Fluoview FV 1000), and the length of dendrites was measured with ImageJ; the number of dendrites and the branching points was counted. Cells devoid of Aβ seeding were randomly chosen in areas of the dentate gyrus without any Aβ seeding pattern.
Semi‐stereological quantification
Immunoreactive cells in the dentate gyrus were counted in a 1 in 10 series of sections throughout the whole hippocampus. The volume of the dentate gyrus in each section was calculated by measuring the DAPI region of the dentate gyrus using ImageJ and multiplying it with the thickness of the Z‐stack (25 μm). For the quantification of DCX‐ and BrdU‐positive cells, Z‐series stacks of images of eight sections per mouse and 5–6 animals per group were taken.
Cell densities in the dentate gyrus were calculated as the number of immunopositive cells in the dentate gyrus divided by the volume of the dentate gyrus and expressed as number of immunopositive cells per mm³.
Environmental enrichment
Four weeks after intracerebral injections into the hippocampus transgenic mice and their non‐transgenic siblings were housed in an enriched environment (EE) or in standard conditions (SH) during 6 weeks. The enriched environment consisted of larger cages (40 × 60 cm) that contained one running wheel, tunnel systems, small plastic houses, and extra nesting material. The animals had free access to the running wheel. At the end of the experiment at the age of 16 weeks, all mice were sacrificed.
Electrophysiology
Uninjected or seeded 5xFAD mice were deeply anesthetized with isoflurane and killed by decapitation. Brains were transferred to ice‐cold slicing solution containing (in mM) NaCl 87, NaHCO3 25, KCl 2.5, NaH2PO4 1.25, glucose 10, sucrose 75, CaCl2 0.5, and MgCl2 7 (aerated with 95%O2/5%CO2). Transverse hippocampal slices (300 μm) were cut with a vibratome; recovered (30 min, 34°C) in artificial cerebrospinal fluid (ACSF) consisting of (in mM) NaCl 125, NaHCO3 25, KCl 2.5, NaH2PO4 1.25, glucose 25, CaCl2 2, and MgCl2 1 (equilibrated with 95%O2/5%CO2); and then stored at room temperature. Patch pipettes for whole‐cell recordings were filled with internal solution composed of (in mM) HEPES 10, MgCl2 2, Na2ATP 2, EGTA 10, tetraethylammonium‐Cl 2, CsCl 4, Cs‐Gluconated 135, and QX314 5. Whole‐cell voltage‐clamp recordings were obtained with a Multiclamp700B amplifier (Molecular Devices) at a recording temperature of 29–32°C. Granule cells were visually identified under infrared differential interference contrast microscopy. To isolate IPSCs, cells were voltage‐clamped at the reversal potential of EPSCs at 0 mV. EPSCs of the same neuron were recorded by holding the cell close to the calculated reversal potential of IPSCs (calculated: −62 mV at 32°C, recorded at −70 mV). Spontaneous synaptic events were visually identified after applying a 1–1,000 Hz band‐pass filter to the data. In case of EPSCs, the analysis was based on 327 ± 34 events (range: 77–526 events per cell), and for the analysis of IPSCs, 295 ± 36 events per cell (range: 72–491) were used. Excitation/inhibition ratio was defined as the product of EPSC amplitude and frequency divided by the product of IPSC amplitude and frequency.
Morris Water Maze (MWM) test
The MWM test was used to measure spatial learning and memory (Morris, 1984) and was conducted in a black plastic pool with a diameter of 120 cm. The temperature of the water was kept at 21°C throughout the experiment. The maze was virtually divided into four quadrants, with one containing a hidden escape platform (10 × 10 cm) present 1 cm below the water surface. The training consisted of 7 consecutive days of testing with four trials per day. There was a recovery period of 10 min between the training trials. Mice were placed into the water with their nose pointing toward the wall in a random way to prevent strategy learning. Mice were allowed to search for the platform for 60 s. If the mice failed to find the escape platform within this time, the animal was placed on the platform for 15 s by the experimenter. For spatial probe trials, 24 h after the last training period, the platform was removed and mice were allowed to swim for 60 s to determine their search bias. Data are presented as the time the mice spent in the quadrant Q1, representing the quadrant where the platform had been located during all the training periods. The reversal training started on day 9, for 4 consecutive days, and the platform (hidden) was moved to the opposite quadrant of the pool (SQ). The platform remained in this location for all training trials. On day 13, the platform was removed and the mice were allowed to search for the platform for 60 s. Data are given as the time the mice spent in the quadrant SQ, representing the quadrant where the platform had been located during all the reversal training periods. One hour after the testing, a visible platform test was performed with the platform being flagged and new positioned. Timing of the latency to find the visible platform was started and ended by the experimenter. A computer running the BIOBSERVE software (BIOBSERVE) analyzed all variables of the MWM test. Mice were tested in a random order.
Immunoblot analysis of hippocampi
Mouse hippocampal tissue was dissected on ice and homogenized in 4× volume RIPA buffer. After passing the sample 10 times through a syringe needle and incubation at 4°C for 30 min, the samples were centrifuged at 7,600 g for 10 min at 4°C. The supernatant was stored at −20°C until use. Brain homogenates from the hippocampus were subjected to SDS–PAGE using 10% SDS gels. Proteins were transferred onto a nitrocellulose membrane (0.2 μm pore size; Protran, Whatman) and immunoblotted with antibodies specific to DCX (rabbit, 1:3,000, abcam, ab18723), active caspase‐3 (rabbit, 1:500 BD Bioscience, C92‐605), or GAPDH (mouse, 1:5,000, Millipore, 6C5). Samples of the olfactory bulb were used as positive control for the detection of active caspase‐3.
In vivo amyloid‐β phagocytosis assay
Mice were injected intraperitoneally with methoxy‐XO4 (Tocris) at 10 mg/kg bodyweight in a DMSO/PBS mixture at 1:10 ratio as described previously with slight modifications (Heneka et al, 2013). Hippocampi were isolated 3 h after methoxy‐XO4 injection and processed into single‐cell suspension with a potter. The homogenate was filtered through a cell strainer (70 μm) and was separated by 37% Percoll gradient centrifugation at 800 g for 30 min at 4°C. The myeloid containing phase was collected and washed once with PBS. Fc receptor blocking antibody CD16/CD32 (1:200, clone 2.4G2, BD Bioscience) was applied in order to prevent unspecific binding, and dead cells were stained using the Fixable Viability Dye eFluor® 780 (1:1,000, eBioscience) at 4°C for 20 min. Cells were washed once and then stained with primary antibodies directed against CD11b (1:200, clone M1/70, eBioscience), CD45 (1:200, clone 30‐F11, eBioscience), and CD36 (1:200, clone 72‐1, eBioscience) at 4°C for 20 min. Cells were washed again, and then, frequencies of viable methoxy‐XO4+ CD11b+CD45low microglia cells were determined by flow cytometry using a FACS Canto II (BD Biosciences) and analyzed using FlowJo (Tree Star). WT mice injected with methoxy‐XO4 were used as controls to determine the methoxy‐XO4 threshold for non‐phagocytosing cells. Corresponding isotype control antibodies were used.
Statistical analysis
GraphPad Prism 6 (GraphPad Software, Inc) and the stats package of SciPy (www.scipy.org) running under Python 2.7 were used for statistical analysis. All data sets were tested for normality with the D'Agostino‐Pearson omnibus K2 normality test with a significance level set to P = 0.05 before the appropriate parametric or nonparametric statistical comparison test was carried out. Student's t‐test or Mann–Whitney test or one‐way ANOVA or Kruskal–Wallis test followed by Dunn's post hoc test or Tukey's multiple comparison test was applied. For correlation, the Pearson correlation was used. Reported values are means ± SEM. Significance level α was set to 0.05. *P < 0.05; **P < 0.01; ***P < 0.001.
Author contributions
SZ‐W and MM‐L conceived and designed the experiments. SZ‐W contributed to all aspects of the experiments and data analysis. Pd′E, DE, DL, NK, and TB assisted with the experimental work. J‐FS and SS performed the patch‐clamp recordings and analysis. MB supervised the patch‐clamp experiments. SZ‐W, MP, and MM‐L discussed the results. SZ‐W and MM‐L wrote the manuscript; MM‐L supervised the project. All authors edited the paper.
Conflict of interest
The authors declare that they have no conflict of interest.
Supporting information
Expanded View Figures PDF
Review Process File
Acknowledgements
We are particularly grateful to J. Göldner and Jana Neuber for technical assistance and L. Dimou for advice and discussions. This work was supported by the Emmy Noether Program of the Deutsche Forschungsgemeinschaft (M.M‐L.) and the Hans and Ilse Breuer Foundation (M.M‐L.).
The EMBO Journal (2018) 37: 167–182
References
- Bachhuber T, Katzmarski N, McCarter JF, Loreth D, Tahirovic S, Kamp F, Abou‐Ajram C, Nuscher B, Serrano‐Pozo A, Muller A, Prinz M, Steiner H, Hyman BT, Haass C, Meyer‐Luehmann M (2015) Inhibition of amyloid‐beta plaque formation by alpha‐synuclein. Nat Med 21: 802–807 [DOI] [PubMed] [Google Scholar]
- Bonaguidi MA, Wheeler MA, Shapiro JS, Stadel RP, Sun GJ, Ming GL, Song H (2011) In vivo clonal analysis reveals self‐renewing and multipotent adult neural stem cell characteristics. Cell 145: 1142–1155 [DOI] [PMC free article] [PubMed] [Google Scholar]
- Brandt MD, Jessberger S, Steiner B, Kronenberg G, Reuter K, Bick‐Sander A , von der Behrens W, Kempermann G (2003) Transient calretinin expression defines early postmitotic step of neuronal differentiation in adult hippocampal neurogenesis of mice. Mol Cell Neurosci 24: 603–613 [DOI] [PubMed] [Google Scholar]
- Brown J, Cooper‐Kuhn CM, Kempermann G, Van Praag H, Winkler J, Gage FH, Kuhn HG (2003) Enriched environment and physical activity stimulate hippocampal but not olfactory bulb neurogenesis. Eur J Neurosci 17: 2042–2046 [DOI] [PubMed] [Google Scholar]
- Busche MA, Eichhoff G, Adelsberger H, Abramowski D, Wiederhold KH, Haass C, Staufenbiel M, Konnerth A, Garaschuk O (2008) Clusters of hyperactive neurons near amyloid plaques in a mouse model of Alzheimer's disease. Science 321: 1686–1689 [DOI] [PubMed] [Google Scholar]
- Cameron HA, McKay RD (1999) Restoring production of hippocampal neurons in old age. Nat Neurosci 2: 894–897 [DOI] [PubMed] [Google Scholar]
- Choi SH, Veeraraghavalu K, Lazarov O, Marler S, Ransohoff RM, Ramirez JM, Sisodia SS (2008) Non‐cell‐autonomous effects of presenilin 1 variants on enrichment‐mediated hippocampal progenitor cell proliferation and differentiation. Neuron 59: 568–580 [DOI] [PMC free article] [PubMed] [Google Scholar]
- Demars M, Hu YS, Gadadhar A, Lazarov O (2010) Impaired neurogenesis is an early event in the etiology of familial Alzheimer's disease in transgenic mice. J Neurosci Res 88: 2103–2117 [DOI] [PMC free article] [PubMed] [Google Scholar]
- Doetsch F, Caille I, Lim DA, Garcia‐Verdugo JM, Alvarez‐Buylla A (1999) Subventricular zone astrocytes are neural stem cells in the adult mammalian brain. Cell 97: 703–716 [DOI] [PubMed] [Google Scholar]
- Dupret D, Revest JM, Koehl M, Ichas F, De Giorgi F, Costet P, Abrous DN, Piazza PV (2008) Spatial relational memory requires hippocampal adult neurogenesis. PLoS One 3: e1959 [DOI] [PMC free article] [PubMed] [Google Scholar]
- Ekonomou A, Savva GM, Brayne C, Forster G, Francis PT, Johnson M, Perry EK, Attems J, Somani A, Minger SL, Ballard CG (2015) Stage‐specific changes in neurogenic and glial markers in Alzheimer's disease. Biol Psychiatry 77: 711–719 [DOI] [PubMed] [Google Scholar]
- Ermini FV, Grathwohl S, Radde R, Yamaguchi M, Staufenbiel M, Palmer TD, Jucker M (2008) Neurogenesis and alterations of neural stem cells in mouse models of cerebral amyloidosis. Am J Pathol 172: 1520–1528 [DOI] [PMC free article] [PubMed] [Google Scholar]
- Fritschi SK, Cintron A, Ye L, Mahler J, Buhler A, Baumann F, Neumann M, Nilsson KP, Hammarstrom P, Walker LC, Jucker M (2014a) Abeta seeds resist inactivation by formaldehyde. Acta Neuropathol 128: 477–484 [DOI] [PMC free article] [PubMed] [Google Scholar]
- Fritschi SK, Langer F, Kaeser SA, Maia LF, Portelius E, Pinotsi D, Kaminski CF, Winkler DT, Maetzler W, Keyvani K, Spitzer P, Wiltfang J, Kaminski Schierle GS, Zetterberg H, Staufenbiel M, Jucker M (2014b) Highly potent soluble amyloid‐beta seeds in human Alzheimer brain but not cerebrospinal fluid. Brain 137: 2909–2915 [DOI] [PMC free article] [PubMed] [Google Scholar]
- Gage FH (2000) Mammalian neural stem cells. Science 287: 1433–1438 [DOI] [PubMed] [Google Scholar]
- Garthe A, Behr J, Kempermann G (2009) Adult‐generated hippocampal neurons allow the flexible use of spatially precise learning strategies. PLoS One 4: e5464 [DOI] [PMC free article] [PubMed] [Google Scholar]
- Garthe A, Kempermann G (2013) An old test for new neurons: refining the Morris water maze to study the functional relevance of adult hippocampal neurogenesis. Front Neurosci 7: 63 [DOI] [PMC free article] [PubMed] [Google Scholar]
- Ge S, Yang CH, Hsu KS, Ming GL, Song H (2007) A critical period for enhanced synaptic plasticity in newly generated neurons of the adult brain. Neuron 54: 559–566 [DOI] [PMC free article] [PubMed] [Google Scholar]
- Hamaguchi T, Eisele YS, Varvel NH, Lamb BT, Walker LC, Jucker M (2012) The presence of Abeta seeds, and not age per se, is critical to the initiation of Abeta deposition in the brain. Acta Neuropathol 123: 31–37 [DOI] [PMC free article] [PubMed] [Google Scholar]
- He Y, Zhang H, Yung A, Villeda SA, Jaeger PA, Olayiwola O, Fainberg N, Wyss‐Coray T (2014) ALK5‐dependent TGF‐beta signaling is a major determinant of late‐stage adult neurogenesis. Nat Neurosci 17: 943–952 [DOI] [PMC free article] [PubMed] [Google Scholar]
- Heneka MT, Kummer MP, Stutz A, Delekate A, Schwartz S, Vieira‐Saecker A, Griep A, Axt D, Remus A, Tzeng TC, Gelpi E, Halle A, Korte M, Latz E, Golenbock DT (2013) NLRP3 is activated in Alzheimer's disease and contributes to pathology in APP/PS1 mice. Nature 493: 674–678 [DOI] [PMC free article] [PubMed] [Google Scholar]
- Hu YS, Xu P, Pigino G, Brady ST, Larson J, Lazarov O (2010) Complex environment experience rescues impaired neurogenesis, enhances synaptic plasticity, and attenuates neuropathology in familial Alzheimer's disease‐linked APPswe/PS1DeltaE9 mice. FASEB J 24: 1667–1681 [DOI] [PMC free article] [PubMed] [Google Scholar]
- Jawhar S, Trawicka A, Jenneckens C, Bayer TA, Wirths O (2012) Motor deficits, neuron loss, and reduced anxiety coinciding with axonal degeneration and intraneuronal Abeta aggregation in the 5XFAD mouse model of Alzheimer's disease. Neurobiol Aging 33: 196 e129–140 [DOI] [PubMed] [Google Scholar]
- Jin K, Galvan V, Xie L, Mao XO, Gorostiza OF, Bredesen DE, Greenberg DA (2004a) Enhanced neurogenesis in Alzheimer's disease transgenic (PDGF‐APPSw, Ind) mice. Proc Natl Acad Sci USA 101: 13363–13367 [DOI] [PMC free article] [PubMed] [Google Scholar]
- Jin K, Peel AL, Mao XO, Xie L, Cottrell BA, Henshall DC, Greenberg DA (2004b) Increased hippocampal neurogenesis in Alzheimer's disease. Proc Natl Acad Sci USA 101: 343–347 [DOI] [PMC free article] [PubMed] [Google Scholar]
- Kane MD, Lipinski WJ, Callahan MJ, Bian F, Durham RA, Schwarz RD, Roher AE, Walker LC (2000) Evidence for seeding of beta ‐amyloid by intracerebral infusion of Alzheimer brain extracts in beta‐amyloid precursor protein‐transgenic mice. J Neurosci 20: 3606–3611 [DOI] [PMC free article] [PubMed] [Google Scholar]
- Kee N, Teixeira CM, Wang AH, Frankland PW (2007) Preferential incorporation of adult‐generated granule cells into spatial memory networks in the dentate gyrus. Nat Neurosci 10: 355–362 [DOI] [PubMed] [Google Scholar]
- Kempermann G, Kuhn HG, Gage FH (1997) More hippocampal neurons in adult mice living in an enriched environment. Nature 386: 493–495 [DOI] [PubMed] [Google Scholar]
- Kempermann G, Kuhn HG, Gage FH (1998) Experience‐induced neurogenesis in the senescent dentate gyrus. J Neurosci 18: 3206–3212 [DOI] [PMC free article] [PubMed] [Google Scholar]
- Kimura R, Ohno M (2009) Impairments in remote memory stabilization precede hippocampal synaptic and cognitive failures in 5XFAD Alzheimer mouse model. Neurobiol Dis 33: 229–235 [DOI] [PMC free article] [PubMed] [Google Scholar]
- Koffie RM, Meyer‐Luehmann M, Hashimoto T, Adams KW, Mielke ML, Garcia‐Alloza M, Micheva KD, Smith SJ, Kim ML, Lee VM, Hyman BT, Spires‐Jones TL (2009) Oligomeric amyloid beta associates with postsynaptic densities and correlates with excitatory synapse loss near senile plaques. Proc Natl Acad Sci USA 106: 4012–4017 [DOI] [PMC free article] [PubMed] [Google Scholar]
- Kriegstein A, Alvarez‐Buylla A (2009) The glial nature of embryonic and adult neural stem cells. Annu Rev Neurosci 32: 149–184 [DOI] [PMC free article] [PubMed] [Google Scholar]
- Kuhn HG, Dickinson‐Anson H, Gage FH (1996) Neurogenesis in the dentate gyrus of the adult rat: age‐related decrease of neuronal progenitor proliferation. J Neurosci 16: 2027–2033 [DOI] [PMC free article] [PubMed] [Google Scholar]
- Langer F, Eisele YS, Fritschi SK, Staufenbiel M, Walker LC, Jucker M (2011) Soluble Abeta seeds are potent inducers of cerebral beta‐amyloid deposition. J Neurosci 31: 14488–14495 [DOI] [PMC free article] [PubMed] [Google Scholar]
- Lazarov O, Robinson J, Tang YP, Hairston IS, Korade‐Mirnics Z, Lee VM, Hersh LB, Sapolsky RM, Mirnics K, Sisodia SS (2005) Environmental enrichment reduces Abeta levels and amyloid deposition in transgenic mice. Cell 120: 701–713 [DOI] [PubMed] [Google Scholar]
- Lois C, Alvarez‐Buylla A (1993) Proliferating subventricular zone cells in the adult mammalian forebrain can differentiate into neurons and glia. Proc Natl Acad Sci USA 90: 2074–2077 [DOI] [PMC free article] [PubMed] [Google Scholar]
- Meyer‐Luehmann M, Coomaraswamy J, Bolmont T, Kaeser S, Schaefer C, Kilger E, Neuenschwander A, Abramowski D, Frey P, Jaton AL, Vigouret JM, Paganetti P, Walsh DM, Mathews PM, Ghiso J, Staufenbiel M, Walker LC, Jucker M (2006) Exogenous induction of cerebral beta‐amyloidogenesis is governed by agent and host. Science 313: 1781–1784 [DOI] [PubMed] [Google Scholar]
- Meyer‐Luehmann M, Spires‐Jones TL, Prada C, Garcia‐Alloza M, de Calignon A, Rozkalne A, Koenigsknecht‐Talboo J, Holtzman DM, Bacskai BJ, Hyman BT (2008) Rapid appearance and local toxicity of amyloid‐beta plaques in a mouse model of Alzheimer's disease. Nature 451: 720–724 [DOI] [PMC free article] [PubMed] [Google Scholar]
- Meyer‐Luehmann M, Mielke M, Spires‐Jones TL, Stoothoff W, Jones P, Bacskai BJ, Hyman BT (2009) A reporter of local dendritic translocation shows plaque‐ related loss of neural system function in APP‐transgenic mice. J Neurosci 29: 12636–12640 [DOI] [PMC free article] [PubMed] [Google Scholar]
- Meyer‐Luehmann M, Prinz M (2015) Myeloid cells in Alzheimer's disease: culprits, victims or innocent bystanders? Trends Neurosci 38: 659–668 [DOI] [PubMed] [Google Scholar]
- Ming GL, Song H (2011) Adult neurogenesis in the mammalian brain: significant answers and significant questions. Neuron 70: 687–702 [DOI] [PMC free article] [PubMed] [Google Scholar]
- Moon M, Cha MY, Mook‐Jung I (2014) Impaired hippocampal neurogenesis and its enhancement with ghrelin in 5XFAD mice. J Alzheimers Dis 41: 233–241 [DOI] [PubMed] [Google Scholar]
- Morris R (1984) Developments of a water‐maze procedure for studying spatial learning in the rat. J Neurosci Methods 11: 47–60 [DOI] [PubMed] [Google Scholar]
- Nilsson M, Perfilieva E, Johansson U, Orwar O, Eriksson PS (1999) Enriched environment increases neurogenesis in the adult rat dentate gyrus and improves spatial memory. J Neurobiol 39: 569–578 [DOI] [PubMed] [Google Scholar]
- Oakley H, Cole SL, Logan S, Maus E, Shao P, Craft J, Guillozet‐Bongaarts A, Ohno M, Disterhoft J, Van Eldik L, Berry R, Vassar R (2006) Intraneuronal beta‐amyloid aggregates, neurodegeneration, and neuron loss in transgenic mice with five familial Alzheimer's disease mutations: potential factors in amyloid plaque formation. J Neurosci 26: 10129–10140 [DOI] [PMC free article] [PubMed] [Google Scholar]
- Ohno M (2009) Failures to reconsolidate memory in a mouse model of Alzheimer's disease. Neurobiol Learn Mem 92: 455–459 [DOI] [PMC free article] [PubMed] [Google Scholar]
- Overall RW, Walker TL, Fischer TJ, Brandt MD, Kempermann G (2016) Different mechanisms must be considered to explain the increase in hippocampal neural precursor cell proliferation by physical activity. Front Neurosci 10: 362 [DOI] [PMC free article] [PubMed] [Google Scholar]
- Paxinos G, Franklin KBJ (2001) The mouse brain in stereotaxic coordinates, 2nd edn San Diego, CA: Academic Press; [Google Scholar]
- van Praag H, Christie BR, Sejnowski TJ, Gage FH (1999a) Running enhances neurogenesis, learning, and long‐term potentiation in mice. Proc Natl Acad Sci USA 96: 13427–13431 [DOI] [PMC free article] [PubMed] [Google Scholar]
- van Praag H, Kempermann G, Gage FH (1999b) Running increases cell proliferation and neurogenesis in the adult mouse dentate gyrus. Nat Neurosci 2: 266–270 [DOI] [PubMed] [Google Scholar]
- Selkoe DJ (1999) Translating cell biology into therapeutic advances in Alzheimer's disease. Nature 399: A23–A31 [DOI] [PubMed] [Google Scholar]
- Seri B, Garcia‐Verdugo JM, McEwen BS, Alvarez‐Buylla A (2001) Astrocytes give rise to new neurons in the adult mammalian hippocampus. J Neurosci 21: 7153–7160 [DOI] [PMC free article] [PubMed] [Google Scholar]
- Shankar GM, Li S, Mehta TH, Garcia‐Munoz A, Shepardson NE, Smith I, Brett FM, Farrell MA, Rowan MJ, Lemere CA, Regan CM, Walsh DM, Sabatini BL, Selkoe DJ (2008) Amyloid‐beta protein dimers isolated directly from Alzheimer's brains impair synaptic plasticity and memory. Nat Med 14: 837–842 [DOI] [PMC free article] [PubMed] [Google Scholar]
- Sturchler‐Pierrat C, Abramowski D, Duke M, Wiederhold KH, Mistl C, Rothacher S, Ledermann B, Burki K, Frey P, Paganetti PA, Waridel C, Calhoun ME, Jucker M, Probst A, Staufenbiel M, Sommer B (1997) Two amyloid precursor protein transgenic mouse models with Alzheimer disease‐like pathology. Proc Natl Acad Sci USA 94: 13287–13292 [DOI] [PMC free article] [PubMed] [Google Scholar]
- Tashiro A, Makino H, Gage FH (2007) Experience‐specific functional modification of the dentate gyrus through adult neurogenesis: a critical period during an immature stage. J Neurosci 27: 3252–3259 [DOI] [PMC free article] [PubMed] [Google Scholar]
- Xu H, Gelyana E, Rajsombath M, Yang T, Li S, Selkoe D (2016) Environmental enrichment potently prevents microglia‐mediated neuroinflammation by human amyloid beta‐protein oligomers. J Neurosci 36: 9041–9056 [DOI] [PMC free article] [PubMed] [Google Scholar]
- Zhang C, McNeil E, Dressler L, Siman R (2007) Long‐lasting impairment in hippocampal neurogenesis associated with amyloid deposition in a knock‐in mouse model of familial Alzheimer's disease. Exp Neurol 204: 77–87 [DOI] [PMC free article] [PubMed] [Google Scholar]
- Ziv Y, Ron N, Butovsky O, Landa G, Sudai E, Greenberg N, Cohen H, Kipnis J, Schwartz M (2006) Immune cells contribute to the maintenance of neurogenesis and spatial learning abilities in adulthood. Nat Neurosci 9: 268–275 [DOI] [PubMed] [Google Scholar]
Associated Data
This section collects any data citations, data availability statements, or supplementary materials included in this article.
Supplementary Materials
Expanded View Figures PDF
Review Process File