Fig. 2.

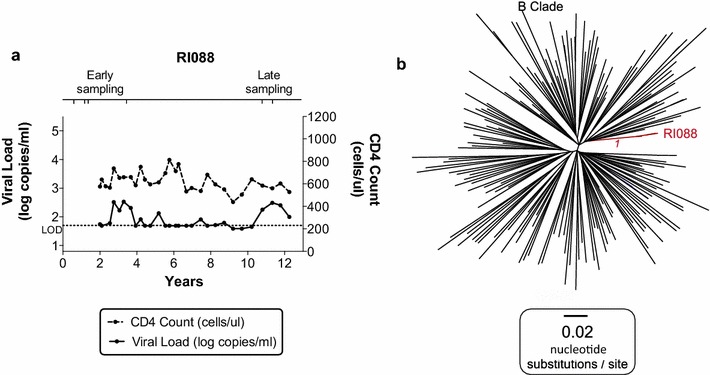
Clinical course of infection and phylogenetic analysis of viral sequences from HLA-B*27:05/57:01-positive controller RI088. a Plasma HIV viral load and CD4+ T cell count for HLA-B*27:05/B*57:01-positive recipient RI088. ‘Time 0’ represents the time of diagnosis. The horizontal dotted line represents the limit of detection (LOD) of the viral load assay (40 copies/ml). b Maximum likelihood phylogenetic tree of a 1089 bp alignment of the Gag gene sequenced from proviral DNA (consensus of clonal sequences shown in Table 4). Subject RI088 (n = 6) sequences spanning 10 years are shown in red. 180 B clade reference sequences from the US and UK collected between 2003 and 2011 from the Los Alamos database (http://www.hiv.lanl.gov/) are shown in black. Bootstrap values for the RI088 sequence cluster based on 1000 bootstrap replicates are shown in italics
