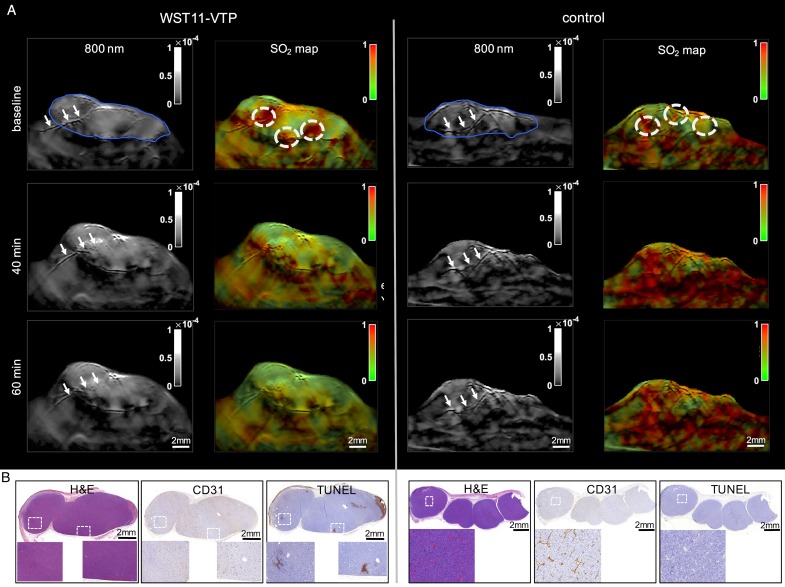
Figure 1.
First 60 min VTP effect monitoring by MSOT. A. The tumors could be depicted clearly by MSOT (800 nm single wavelength images shown here; blue outline) and did not markedly change over the course of the first hour after WST11-VTP or sham treatment. However, a prominent vessel that is seen to cross the tumor before treatment onset, appeared morphologically destructed in its intratumoral course over the course of 60 min (arrows left panel) while the crossing tumor vessel in the control mouse appeared morphologically unchanged (arrows right panel). On SO2 mapping, reduced oxygen saturation in the perivascular tumor ROI (dotted circles) was monitored by MSOT relative to baseline, while in comparison no reduction was observed after saline-VTP sham treatment as control. B. On histological examination 1 h after VTP there was no sign of tumor necrosis in either group, but reduction of CD31-positive endothelial cells was observed as the corresponding sign of vessel destruction (see Supplemental Figure S3 for enlarged images).

