Abstract.
The purpose of this study was to develop a dynamic physical cardiac phantom with a realistic coronary plaque to investigate stenosis measurement accuracy under clinically relevant heart-rates. The coronary plaque model (5 mm diameter, 50% stenosis, and 32 mm long) was designed and 3D-printed with tissue equivalent materials (calcified plaque with iodine-enhanced lumen). Realistic cardiac motion was modeled by converting computational cardiac motion vectors into compression and rotation profiles executed by a commercial base cardiac phantom. The phantom was imaged on a dual-source CT system applying a retrospective gated coronary CT angiography (CCTA) protocol using synthesized motion-synchronized electrocardiogram (ECG) waveforms. Multiplanar reformatted images were reconstructed along vessel centerlines. Enhanced lumens were segmented by five independent operators. On average, stenosis measurement accuracy was 0.9% positively biased for the motion-free condition. Average measurement accuracy monotonically decreased from 0.9% positive bias for the motion-free condition to 18.5% negative bias at 90 beats per minute. Contrast-to-noise ratio, lumen circularity, and segmentation conformity also decreased monotonically with increasing heart-rate. These results demonstrate successful implementation of a base cardiac phantom with a 3D-printed coronary plaque model, relevant motion profile, and coordinated ECG waveform. They further show the utility of the model to ascertain metrics of CCTA accuracy and image quality under realistic plaque, motion, and acquisition conditions.
Keywords: coronary CT angiography, coronary plaque, dynamic cardiac phantom, 3D-printed, stenosis
1. Introduction
Coronary artery disease (CAD) is the leading cause of death in the United States.1 Imaging the vessels of the heart for CAD evaluation continues to be a difficult problem. The pulsating cardiac motion introduces temporal blur and motion artifact, ultimately reducing the certainty of image interpretation and potential obscuration of disease. Imaging modalities have been improved to overcome these limitations and provide more accurate diagnosis. Among them, CT holds much promise for precise cardiac evaluation, due to its noninvasive potential, volumetric acquisition, and high spatial and temporal resolution.2
Coronary computed tomography angiography (CCTA) is a well-established clinical technique used to assess the extent of coronary stenosis in intermediate risk patients. CCTA has a high negative predictive value (NPV: 95%) and a relatively low positive predictive value (PPV: 80%)3,4 for detecting significant stenosis (NPV and PPV vary depending on prevalence, population, and method). CCTA’s high NPV has established CCTA as the standard method to rule out significant stenosis and thereby avoid unnecessary intervention. CCTA’s low PPV is reflective of the tendency to overestimate the degree of stenosis when accommodating for motion-induced image quality degradation and measurement uncertainty, especially in high heart-rate patients and those with calcified plaque. Fundamental characteristics of CT acquisition and cardiac motion result in decreasing accuracy of stenosis measurement with increasing heart rate.5 There is also quantitative evidence of this relationship using coronary angiography as the gold standard for accuracy evaluation.6–9 But, there are few quantitative studies investigating this relationship using a known ground truth with dynamic anatomic realism.10–13 Reasons for this include the challenge of developing suitable phantoms to realistically mimic cardiac and plaque anatomy, and heart motion with a corresponding electrocardiogram (ECG) signal.
The purpose of this study was to develop a physical cardiac phantom platform with a dynamic, anatomically realistic, ground truth coronary stenosis. This platform includes realistic cardiac and plaque anatomy, variable heart motion, and utilizes ECG signals for gated CT acquisition. To demonstrate the utility of the phantom platform, we also quantified stenosis measurement accuracy across a range of clinically relevant heart-rates.
2. Methods
This study included the development of a dynamic physical heart phantom followed by an investigation on the accuracy of CCTA stenosis measurements. For the phantom, we first designed and manufactured an anatomically accurate coronary plaque model. We then designed and integrated cardiac motion at variable heart rates. And finally, we synthesized motion synchronized ECG signals compatible with clinical CT machines. The developed phantom was then scanned on a clinical CT system using a standard CCTA protocol. The resultant images were evaluated by a group of readers in a consensus design, and quantitative image quality metrics were derived through image analysis.
2.1. Dynamic Heart Phantom
A commercial dynamic cardiac phantom (Shelley Medical Imaging DHP-01) served as the base for our cardiac motion execution. The base dynamic cardiac phantom includes an anthropomorphic hydrogel heart, two programmable motion stages that actuate the heart along and around its long axis (i.e., compression and rotation), and an acrylic rectangular case (Fig. 1). To better simulate body habitus tissue attenuation properties, the rectangular acrylic case was filled with distilled water. The software module of the base cardiac phantom included example heart motion profiles, but these profiles were neither realistic nor adaptable and were not used in this study.
Fig. 1.
Commercial dynamic cardiac phantom (Shelley Medical Imaging DHP-01) with 3D-printed coronary plaque model positioned in right atrioventricular groove.
2.2. Coronary Plaque Model
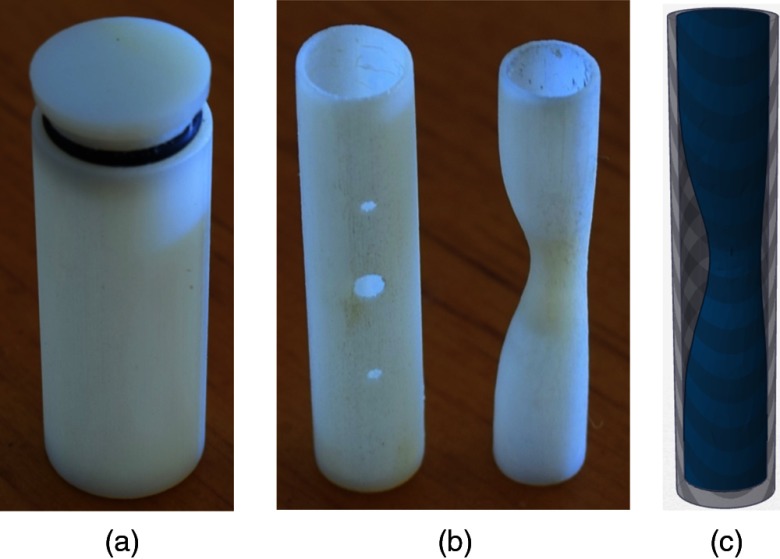
The coronary vessel and plaque model was designed and manufactured according to the parameters in Table 1, and as seen in Fig. 2. The cylindrical vessel shape was chosen because coronary vessels are nominally cylindrical with minor dynamic deformations and distal tapering. The model’s inner diameter closely matched that of a typical left main coronary artery under maximum vasodilation. This large diameter provided a best-case scenario for stenosis measurement accuracy. The chosen wall thickness was slightly greater than typical anatomy due to a limitation in manufacturing resolution. The length of the vessel fit a normal-sized plaque while also allowing for an additional 6 mm length (3 mm on either end) of normal lumen diameter (5 mm). This section of unblocked “healthy lumen” served as the reference diameter for subsequent stenosis calculations. To simulate a standard contrast-enhanced CCTA protocol, the vessel was filled with an iodinated contrast material. The chosen concentration of iodinated contrast material provided a clinically relevant luminal enhancement.12
Table 1.
Vessel and plaque design parameters.
| Parameter | Value |
|---|---|
| Vessel shape | Cylinder |
| Vessel diameter | 5 mm |
| Vessel wall thickness | 1 mm |
| Vessel length | 32 mm |
| Luminal enhancement | (120 kVp) |
| Plaque shape | Eccentric Gaussian |
| Maximum stenosis | 50% (2.5 mm) |
| Plaque length | 24 mm |
| Plaque type | Calcified |
| Plaque density | (120 kVp) |
Fig. 2.
(a) Concentric enclosing cylinder. (b) Coronary vessel (left) and stenosed lumen (right). Combined vessel-lumen fits inside enclosing cylinder. (c) Surface rendering of stenosed lumen placed within cylindrical vessel.
The Gaussian shape of the plaque allowed for a best-case measurement scenario while also maintaining substantial anatomic realism.14,15 The smoothly varying Gaussian plaque profile mitigated any artificial reconstructed slice phase or volume averaging effects. A maximum blockage of 50% stenosis was applied because of its significance as a principal clinical threshold for determining the need for invasive imaging or intervention. The length of the plaque was set to match the size found in a typical intermediate calcified stenosis.16 A calcified plaque was chosen because its highly attenuating calcium accentuates the motion artifacts intended for analysis and quantification. Although a calcified plaque may also induce calcium blooming and beam hardening making the stenosis measurement task more difficult, our choice of lumen enhancement and plaque calcium concentration provided ample differentiation in attenuation between vessel and plaque components.
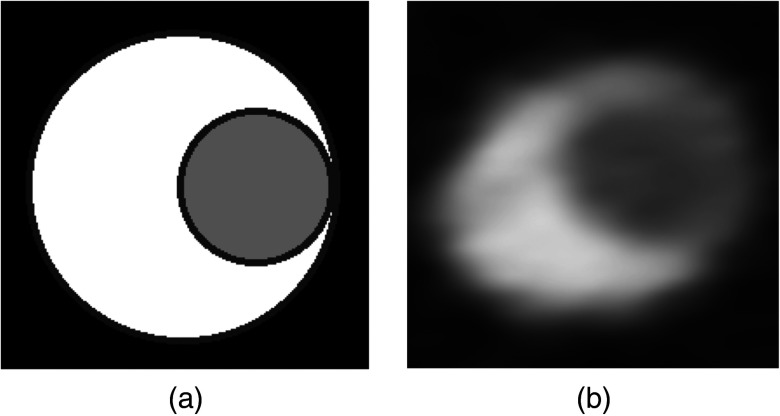
The model was 3D-printed using a polyjet technique employing vessel-equivalent material (VeroWhite, Stratasys). The calcified plaque was inserted into the vessel by back filling a printed void with a dental resin mixture (40% amorphous calcium phosphate) and curing it with ultraviolet light (Fig. 2). The lumen was filled with an iodinated contrast material (ISOVUE-300 and gelatin mixture) diluted to a concentration of . The plaque model was then glued inside a concentric cylinder (13 mm diameter) filled with canola oil ( Hounsfield unit [HU] at 120 kVp) to mimic the epicardial fat that surrounds coronary vessels (Fig. 3).
Fig. 3.
(a) Axial cross section of virtual plaque model at maximum stenosis (WW: 1000, WL: 300). Black represents epicardial fat, gray represents enhanced lumen, and white represents calcified plaque. (b) CTA image of 3D-printed model at maximum stenosis. Black is canola oil (), gray is elemental iodine concentration of (200 HU), and white is dental resin mixture composed of 40% amorphous calcium phosphate (500 HU).
The completed plaque model was secured on the surface of a dynamic heart phantom, within the right atrioventricular groove using an elastic strap (Fig. 1). This location within the groove experienced a motion profile similar to that of the mid right coronary artery.17
2.3. Cardiac Motion Profile and ECG Synthesis
To create realistic cardiac motion within the physical phantom, we first sampled a high-resolution deformation field from a validated four-chamber finite element model.18 The timing of this virtual model was adjusted by fitting its left ventricle (LV) volume–time curve to that of a typical LV volume–time curve. In other words, the local deformation was maintained, but the execution rate, or velocity, was adjusted according to the fill rate of a typical adult LV. The high-resolution motion profiles derived from the fitted computational cardiac model were then programmed into the included motor control software package using the following process. First, the sampled longitudinal displacement and axial rotation values were scaled according to the servo motor mechanical linkage system and temporally resampled to 30 frames-per-second. Second, the servo motor position values were programmed as two separate execution tracks using software provided by the phantom manufacturer (Visual Show Automation v2.0). Third, an additional synchronized ECG track was added which consisted of a single rectangular pulse two frames wide occurring at the R wave peak within each cardiac cycle. Fourth, the three tracks were loaded into the remote advanced playback unit (RAPU v3.1) microcontroller and executed in repeat mode. The finalized cardiac motion profile was executed by the base cardiac phantom at four heart rates: 0, 60, 75, and 90 beats per minute (bpm) with no beat-to-beat variability. The original 60 bpm motion profile was scaled linearly to adjust for the higher heart rates. This selection of heart rates was chosen to span a clinically relevant range (60 to 75 bpm) and also provide a relevant variability in the expected performance.
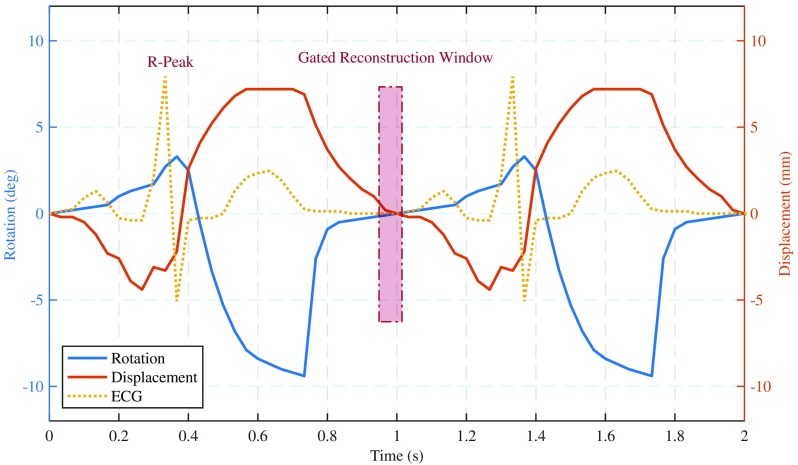
Clinical CCTA acquisition protocols require real-time monitoring and measurement of the heart’s sinus rhythm to gate x-ray exposure and image acquisition to ideal cardiac phases. The base cardiac phantom did not provide a synchronized ECG signal suitable for clinical CT machines. The validated four-chamber finite element model from which we sampled our motion profile included the necessary electrophysiology information to generate a motion synchronized ECG waveform. The synthesized ECG signal was fitted to four different heart-rates, and the signals were programmed into the motor control software package. At run time, the ECG signal was converted into a CT compatible waveform via a passive level converter device developed in collaboration with the phantom manufacturer. Given our total control over both the executed motion profile and its synchronized ECG waveform, we set the phase of least cardiac motion at 60% of the R-to-R interval for all heart-rates (Fig. 4). This ground truth allowed for precise acquisition and reconstruction on the exact phase of least cardiac motion, thereby presenting a best-case CCTA evaluation and measurement scenario.
Fig. 4.
Phantom displacement and rotation derived from cardiac finite element model. Motion synchronized ECG as measured by the CT machine is also shown along with the gated reconstruction window (60% of R-R interval).
2.4. CT Acquisition and Reconstruction
The complete phantom platform was placed on the patient table and images were acquired with a dual-source CT system (Somatom Definition Flash, Siemens Healthineers, Forchheim, Germany) using a clinical cardiac protocol (Table 2). All images were reconstructed at 60% of the R-to-R interval (designed phase of least cardiac motion as similarly utilized in clinical CTA imaging) using both an iterative reconstruction (IR) algorithm and a filtered back projection (FBP) algorithm (Table 3). The combined choices of acquisition protocol and image reconstruction aimed to maintain clinical relevance while also providing a best-case scenario for stenosis measurement accuracy. For example, by choosing to reconstruct at the known programmed phase of least cardiac motion, any additional motion blurring or uncertainty due to phase selection was avoided. Additionally, the cardiac motion was exactly repeatable from one cardiac cycle to the next and therefore mitigated any potential misregistration along the length of the vessel.
Table 2.
CT acquisition protocol.
| Protocol | Spiral ECG gating |
|---|---|
| Rotation time | 285 ms |
| Temporal resolution | 75 ms |
| kVp | 120 |
| Quality Ref. mAs | 320 |
| Collimation |
Table 3.
CT reconstruction parameters.
| Reconstruction algorithm | SAFIRE (3) / WFBP |
|---|---|
| Kernel | I36f / B36f |
| Slice thickness | 0.6 mm |
| Slice increment | 0.4 mm |
| FOV |
2.5. Image Analysis
Image analysis was conducted by segmenting the enhanced lumen along the full length of the vessel. As the plaque models were not exactly perpendicular to the reconstructed axial slices, the vessel centerlines were extracted and curved multiplanar reformations were generated to provide accurate cross-sectional views of the cylindrical vessel. As expected, the acquired images exhibited motion artifacts and temporal blurring. These degradations, while being the subject of this investigation, make the process of quantification both variable and dependent on the analysis method employed. Our goal was to minimize the impact our analysis method had on the final results. To achieve this goal, we averaged results from multiple readers segmenting the lumen area. We choose a measurement technique based on lumen area and not lumen diameter (current clinical standard), because recent studies found lumen area measurements to be more accurate and clinically relevant.11 A total of five operators, imaging scientists with an average of 4+ years of medical imaging experience, manually segmented the IR image datasets under a fully crossed and blinded study design. Their task was to segment the iodine-enhanced lumen along the full length of the stenosed vessel. A custom MATLAB® operator interface allowed for each reader to choose their preferred window display settings (window width and center, zoom, and pan) and provided a single paintbrush style segmentation tool used to paint in the lumen area for each reformatted slice. Each operator was trained using an example dataset and completed all segmentations within a single session (1.5 h average duration). The total segmented area within each image slice was used to calculate an effective diameter as
| (1) |
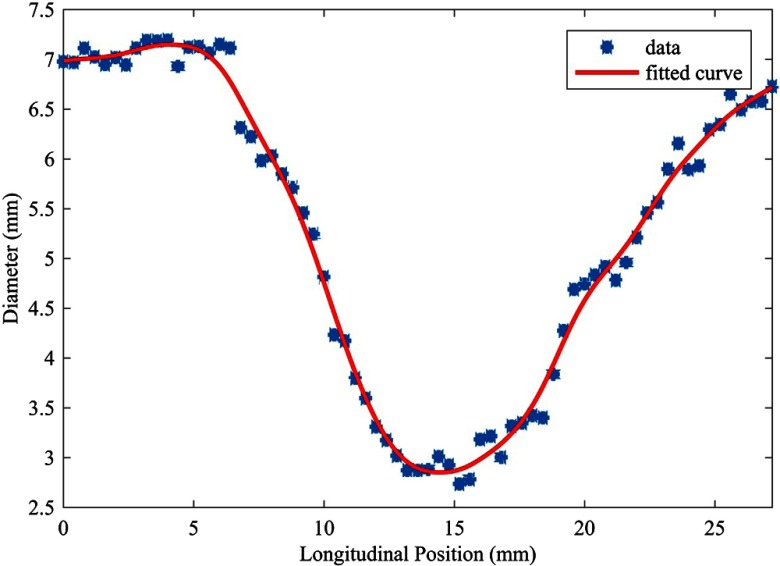
Effective diameter measurements along the length of the lumen profile were then fit by a smoothing spline (Fig. 5) to estimate percent stenosis as
| (2) |
Fig. 5.
Effective diameter measurements of single operator along lumen profile. Image dataset acquired under motion-free condition (0 bpm) and reconstructed using an iterative algorithm (IR).
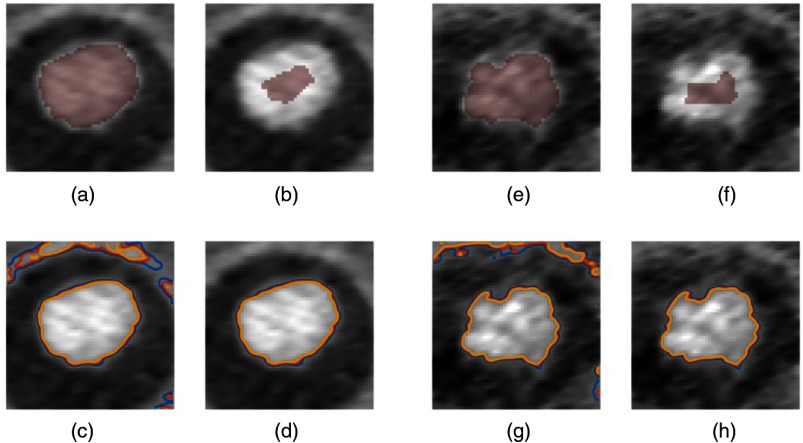
The fundamental image quality metrics of contrast and noise were further extracted based on volumetric regions of interest (ROIs) using a segmentation consensus method. The intersection of all segmentations was defined as the signal ROI. The background ROI was defined as an annulus around the enhanced lumen, per known 3D-printed vessel model geometry, and excluded any part of the union of all segmentations. Isolevel contours delineating the lumen edges were demarcated using a similar consensus method on a slice-by-slice basis (Fig. 6) using the intersection of all segmentations eroded by half its effective diameter. The mean signal was then calculated from the eroded segmentation. Isolevels were set at a fixed percentage of the mean signal (50%, 55%, and 60%) and computed using a native MATLAB® function (contour.m). Isolevels that did not circumscribe the enhanced lumen were rejected. A measure of circularity19 [Eq. (3)] was employed for each of the three isolevel contours. Conformity and interrater reliability were calculated using the generalized conformity index,20,21 [Eq. (4)], and intraclass correlation coefficient, ICC(2,1)22 as
| (3) |
| (4) |
where is the lumen segmentation for each of the operators.
Fig. 6.
Motion-free IR dataset (0 bpm): (a) intersection of all segmentations. (b) Eroded segmentation used to calculate mean signal level. (c) Initial contours. (d) Final contour selections. Fastest motion IR dataset (90 bpm): (e) intersection of all segmentations. (f) Eroded segmentation used to calculate mean signal level. (g) Initial contours. (h) Final contour selections.
3. Results
3.1. Phantom Platform
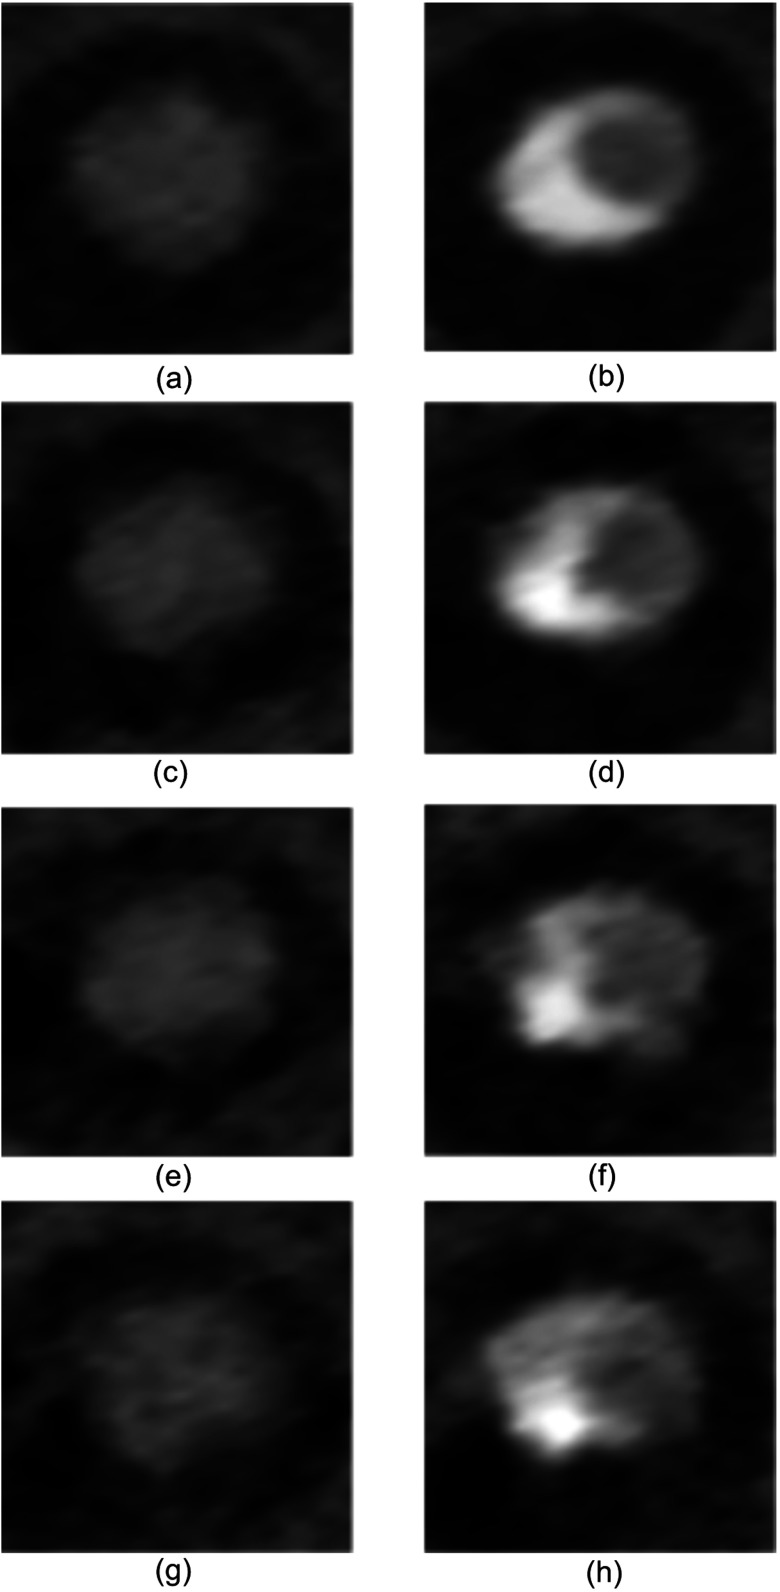
The phantom platform successfully mimicked cardiac and plaque anatomy, realistic cardiac motion, and synchronized ECG gating on a clinical CT system. The resultant images (Fig. 7) exhibited the expected HU intensity levels, vessel shape, vessel size, vessel environment, and local noise properties. The executed motion profiles were first confirmed visually and later verified using measurements from the resulting image data. The ECG waveform synchronization was confirmed by simultaneously comparing software execution, phantom motion, and ECG oscilloscope output. This synchronization was later verified using the CT system recorded ECG waveform and corresponding image data.
Fig. 7.
Axial slices from IR image datasets (WW: 1000, WL: 300) (a) Unstenosed lumen at 0 bpm. (b) Maximally stenosed lumen at 0 bpm. (c) Unstenosed lumen at 60 bpm. (d) Maximally stenosed lumen at 60 bpm. (e) Unstenosed lumen at 75 bpm. (f) Maximally stenosed lumen at 75 bpm. (g) Unstenosed lumen at 90 bpm. (h) Maximally stenosed lumen at 90 bpm.
3.2. Stenosis Measurement Accuracy
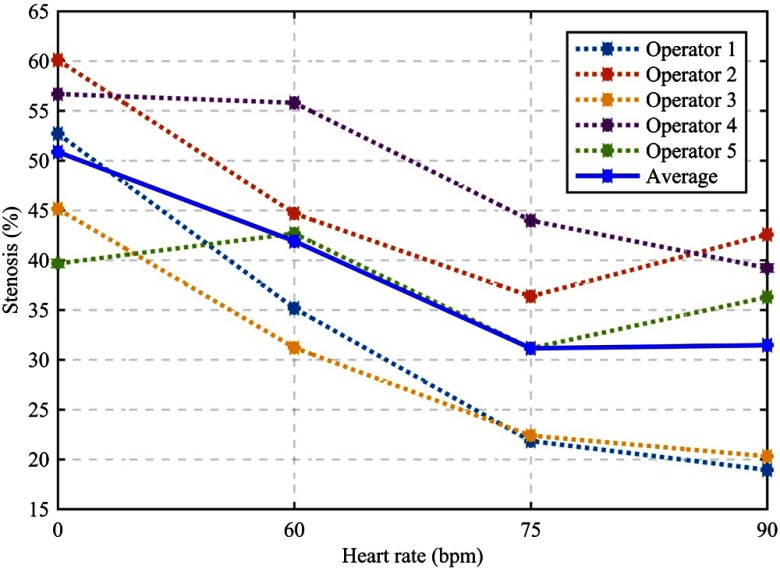
The 3D-printed lumen has a ground truth of 50% diameter stenosis. The average stenosis measurement at 0 bpm was 50.9% or 0.9% positive bias for the motion-free condition. The average stenosis measurement accuracy decreased monotonically with increasing heart rate. The average stenosis measurement at 90 bpm was 31.5% or 18.5% negative bias (Fig. 8). There were bias differences among the five operators, but for most operators the measurement accuracy decreased monotonically with increasing heart rate and at both 75 and 90 bpm, every operator underestimated the true stenosis present in the vessel.
Fig. 8.
Percent diameter stenosis measurements of a single calcified plaque (50% reference stenosis) under four heart-rates. Dashed lines show measurements from each of the five operators, and their average measurement is shown in solid blue.
3.3. Operator Conformity and Reliability
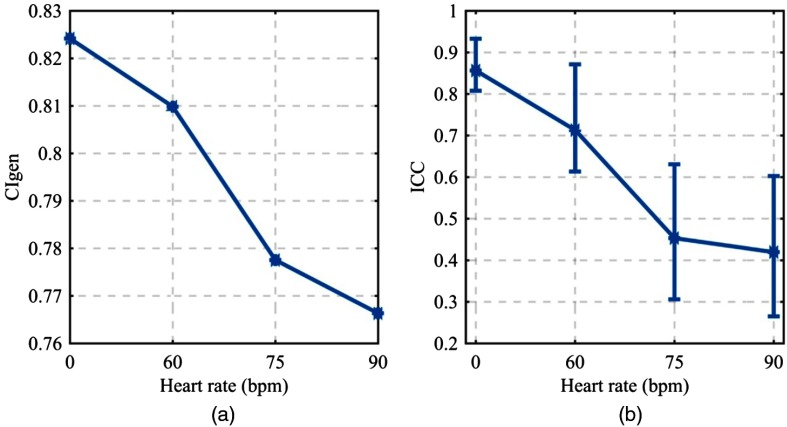
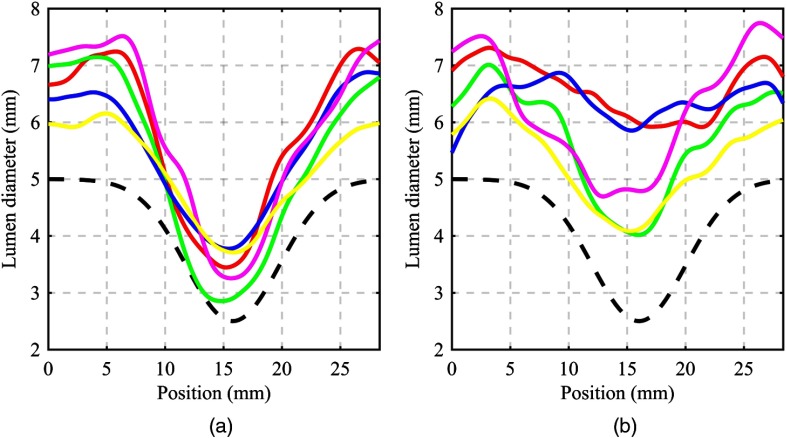
The conformity of the operators’ segmentations did not change considerably over the heart rates investigated, although it did decrease monotonically from 0.824 at 0 bpm to 0.766 at 90 bpm [Fig. 9(a)]. The interrater reliability, as measured by the ICC, demonstrated degradation over the range of heart-rates investigated. At 0 bpm, an ICC of 0.857 connoted excellent reliability in the operators’ measurements, which degraded to 0.420 at 90 bpm11 [Fig. 9(b)]. These operator conformity metrics are visually appreciated by inspecting the segmented lumen profiles of all operators for a given heart rate. At 0 bpm, the lumen profiles matched in general shape and exhibited little bias from one another [Fig. 10(a)]. At 90 bpm, the lumen profiles exhibited different general shapes and considerable bias from one another over the full length of the lumen profile [Fig. 10(b)]. A direct comparison with the physical size of the 3D-printed lumen reveals an average positive diameter bias of 1.69 mm across all operator profiles and acquisition heart rates.
Fig. 9.
(a) Generalized conformity index (), a measure of the overlap of the operators’ segmentations. (b) Interrater reliability as measured by ICC(2,1) with error bars displaying 90% CI.
Fig. 10.
Effective lumen diameter profiles as measured by the five independent operators along with the physical 3D-printed profile (dashed black line). (a) 0 bpm and (b) 90 bpm.
3.4. Quantitative Image Quality
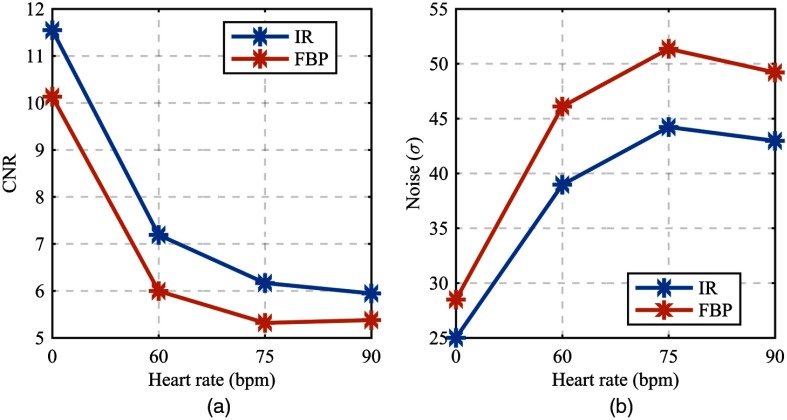
The contrast-to-noise ratio (CNR) for both the FBP and IR images decreased with increasing heart rate [Fig. 11(a)]. For the IR images, a CNR of 11.55 at 0 bpm was reduced by half to 5.95 at 90 bpm. Most of the CNR reduction occurred from 0 to 60 bpm (). For the FBP images, a CNR of 10.13 at 0 bpm was reduced to 5.38 at 90 bpm. The lumen contrast was constant across all heart rates; therefore, a substantial increase in background noise dictated the reduction in CNR [Fig. 11(b)]. Typically, the measured background noise of 25 HU (standard deviation [SD] of background ROI pixels) at 320 reference mAs for a chest equivalent thickness phantom is considered in the normal range. A measured background noise of 44 HU (SD) at 320 reference mAs is high and is indicative of motion-induced artifacts enhancing the background noise. Although a typical background noise measurement does not vary for a constant photon flux (mAs), the image voxels immediately surrounding the enhanced lumen exhibited increased variability with increasing heart rate (Fig. 7). Thus, the standard implementation of CNR for our selected ROIs does include elevated measured noise components due to the inclusion of motion-induced image quality degradations. This inclusion is justified by the proximity of the noise pattern to the delineation task and thus its direct influence on the depiction and segmentation of the lumen.
Fig. 11.
(a) CNR of iodine-enhanced lumen and background epicardial fat. (b) Noise as measured by the standard deviation of background voxel values.
Isolevel contours are a quantitative approach to delineate borders or edges of the enhanced lumen. The lumen was designed and printed as a perfect circle so any shape deformities (ellipsoid) or edge irregularities (undulation) were introduced by the imaging system and object motion. For all three isolevel contours of both the IR and FBP images, the average lumen circularity decreased monotonically with increasing heart rate. The first (IR/FBP) isolevel contour (50% mean signal) had a lumen circularity of (0.88/0.89) at 0 bpm that decreased to (0.57/0.63) at 90 bpm (Fig. 12). The other two isolevel contours followed a similar trend and magnitude of decrease.
Fig. 12.
Circularity for three isolevel contours averaged across multiple slices (level 1 = isolevel contour at 50% of mean ROI signal; level 2 = isolevel contour at 55% of mean ROI signal; level 3 = isolevel contour at 60% of mean ROI signal).
4. Discussion
It is generally understood that the image quality of coronary CTA is influenced by heart motion. Our findings indicate that accuracy and image quality degrade with increasing heart rate. This is consistent with previous studies and current consensus clinical thought of CCTA.5–11 Our results show that this motion influence manifests itself in a negative stenosis measurement bias, reaching 18.5% at the highest heart rate (90 bpm). The large magnitude of the negative stenosis bias is partially due to the average positive diameter measurement bias of 1.69 mm. This large negative bias may partly explain CCTA’s low PPV in patients with high heart rates. The degradation in measurement accuracy correlated with a degradation in image quality metrics. Reduced CNR and irregular lumen edges introduced a degree of difficulty and uncertainty in the operators’ task of delineating the true lumen border. This motion-induced image quality degradation also revealed itself in the fact that the operators became less reliable and agreed less as the heart rate increased. It should be noted that our study focused on a single acquisition protocol using one dual-source CT scanner at a single temporal resolution of 75 ms using a helical acquisition. Although the general trend in stenosis measurement accuracy and heart motion is substantiated, further work is needed to quantify how different acquisition parameters, proprietary processing algorithms, and overall CT architecture impact this trend.
Although our study was designed to maximize stenosis measurement accuracy and present a best-case clinical scenario for vessel motion similar to a coronary artery, our results still demonstrated substantial variability in image quality and quantitative accuracy. This evidence could suggest reduced utility in using precise quantitative stenosis measurements for clinical decision making. In fact, current clinical practice uses only four stenosis measurement quartiles (0% to 24%, 25% to 49%, 50% to 75%, 75% to 99%) with the tendency to round up intermediate plaque measurements to avoid false negatives and account for operators’ variable measurement bias and uncertainty.22 But, by robustly quantifying these biases and uncertainties, we can begin to optimize and improve stenosis measurement accuracy. Awareness of these uncertainties will allow imagers to make measurements with more confidence and ultimately provide more clinical utility without the need for internal operator adjustments or limited stenosis categorization. Our phantom platform can provide the necessary ground truth and realism to understand this problem across different CT machines, acquisition protocols, patient heart motions, and plaque types.
While this study primarily focused on the impact of motion on stenosis measurement accuracy, other baseline factors such as choice of reconstruction algorithm, lumen contrast density, and partial volume effects also influenced the final results. We found that the IR algorithm provided increased CNR while sacrificing little in edge sharpness and regularity (circularity). Furthermore, the use of a medium sharpness cardiac reconstruction kernel (B36f) and high lumen contrast density (200 HU) in conjunction with inherent partial volume effects and operators’ signal threshold resulted in an average 1.69 mm positive diameter measurement bias. Using a sharper reconstruction kernel and reduced contrast density could partly curtail this large positive bias, but at the expense of increased image noise and decreased CNR. These baseline effects are thoroughly investigated and well understood for the static condition,10–12,23 and our results indicate little interaction or dependence with vessel motion.
There are limitations to the current study. First, the operators were not trained cardiologists or radiologists, and as such could be predisposed to increased inaccuracy and lack of consistency. This potential shortfall was partly compensated for by averaging over the operators’ measurements and using an area-derived measurement instead of the standard diameter value. In the future, we plan to develop an estimability framework using spatiotemporal CT system performance characteristics. Once validated via a trained reader study, such an observer model framework would facilitate rapid unbiased evaluation of stenosis measurement accuracy across the large CCTA acquisition and reconstruction parameter space.
Second, our 3D-printed model was translated according to realistic cardiac motion, but the rigid model did not include local elastic vessel deformations. Also, the 3D-printed model was only one size and one type of the many coronary plaques seen clinically. This model, however, was fabricated as a relevant yet only single realization of the plaque morphology which we aim to diversify in future expansions of the project. The simplified Gaussian shape afforded a best-case stenosis measurement scenario to set an upper limit on measurement accuracy. We are developing fibrous and lipid plaques and intend to quantify their measurement accuracy in future studies. We can also incorporate different plaque shapes and profiles to better sample the population of plaques seen clinically.
Third, we used a single cardiac motion profile that was scaled linearly with increasing heart rate. Physiologically, as heart rate increases, the diastolic period is shortened to a greater extent than systole, which results in the period of least cardiac motion at end systole. Additionally, each patient’s cardiac motion profile is unique and potentially variable from beat-to-beat. Heart arrhythmias or tachycardias can induce rapid motion and variability that need addressing as well. Although we did not specify exact motion amplitude and motion direction in this study, in future efforts we plan to use a cohort of heart motion profiles derived from patient echocardiography data which will include a full description of cardiac motion vectors.
Despite the limitations, the base cardiac phantom and 3D-printed plaque model successfully produced realistic CT images of stenosed lumen with motion artifacts. This same phantom setup can be extended to investigate stenosis measurement accuracy under a variety of scan techniques and across multiple CT vendors. Additionally, volumetric quantitative coronary CT metrics like plaque volume or total plaque burden can be systematically investigated for accuracy and uncertainty outcomes using the developed platform.
5. Conclusions
Stenosis measurement accuracy, CNR, lumen circularity, and segmentation conformity all decreased monotonically with increasing heart rate. Our results demonstrated successful design and implementation of a 3D-printed coronary plaque model, realistic motion profile, and coordinated ECG waveform as a reliable phantom platform to quantify coronary CTA image quality and stenosis measurement accuracy.
Acknowledgments
The authors would like to thank Paul Vosburgh for his valuable comments and suggestions.
Biographies
Taylor Richards is a fourth-year medical physics PhD student at Duke University. He received a bachelor’s of science degree in applied physics from Brigham Young University. He is interested in CT image quality and quantitative imaging in the presence of motion.
Lynne Hurwitz Koweek is an associate professor of radiology and medicine and holds a faculty appointment within the medical physics graduate program at Duke University Medical Center. She currently serves as the director of cardiovascular imaging within the Radiology Department and medical director of computed tomography services.
Biographies for the other authors are not available.
Disclosures
This work was supported by a bridge grant from the Duke School of Medicine and by the National Institutes of Health (NIH) under award number R01HL131753. Dr. Ramirez-Giraldo is a staff scientist employed by Siemens Medical Solutions USA Inc. Dr. Geoffrey D. Rubin is a member of the Imaging Advisory Board for General Electric (GE).
References
- 1.Mozaffarian D., et al. , “Heart disease and stroke statistics—2016 update: a report from the American Heart Association,” Circulation 133(4), e38–e360 (2016). 10.1161/CIR.0000000000000350 [DOI] [PubMed] [Google Scholar]
- 2.Nikolaou K., et al. , “MRI and CT in the diagnosis of coronary artery disease: indications and applications,” Insights Imaging 2(1), 9–24 (2011). 10.1007/s13244-010-0049-0 [DOI] [PMC free article] [PubMed] [Google Scholar]
- 3.Mowatt G., et al. , “64-slice computed tomography angiography in the diagnosis and assessment of coronary artery disease: systematic review and meta-analysis,” Heart 94(11), 1386–1393 (2008). 10.1136/hrt.2008.145292 [DOI] [PubMed] [Google Scholar]
- 4.Otaki Y., et al. , “What have we learned from CONFIRM? Prognostic implications from a prospective multicenter international observational cohort study of consecutive patients undergoing coronary computed tomographic angiography,” J. Nucl. Cardiol. 19, 787–795 (2012). 10.1007/s12350-012-9582-1 [DOI] [PMC free article] [PubMed] [Google Scholar]
- 5.Ohnesorge B., Flohr T., “Principles of multi-slice cardiac CT imaging,” in Multi-Slice and Dual-Source CT in Cardiac Imaging, Ohnesorge B. M., et al., Eds., 2nd ed., pp. 71–126, Springer, Berlin/Heidelberg: (2007). [Google Scholar]
- 6.Cademartiri F., et al. , “Diagnostic accuracy of multislice computed tomography coronary angiography is improved at low heart rates,” Int. J. Cardiovasc. Imaging 22(1), 101–105 (2006). 10.1007/s10554-005-9010-6 [DOI] [PubMed] [Google Scholar]
- 7.Arbab-Zadeh A., et al. , “Quantification of lumen stenoses with known dimensions by conventional angiography and computed tomography: implications of using conventional angiography as gold standard,” Heart 96(17), 1358–1363 (2010). 10.1136/hrt.2009.186783 [DOI] [PubMed] [Google Scholar]
- 8.Budoff M. J., et al. , “Diagnostic performance of 64-multidetector row coronary computed tomographic angiography for evaluation of coronary artery stenosis in individuals without known coronary artery disease. Results from the prospective multicenter ACCURACY (Assessment by Coronary Computed Tomographic Angiography of Individuals Undergoing Invasive Coronary Angiography) trial,” J. Am. Coll. Cardiol. 52(21), 1724–1732 (2008). 10.1016/j.jacc.2008.07.031 [DOI] [PubMed] [Google Scholar]
- 9.Raff G. L., et al. , “Diagnostic accuracy of noninvasive coronary angiography using 64-slice spiral computed tomography,” J. Am. Coll. Cardiol. 46(3), 552–557 (2005). 10.1016/j.jacc.2005.05.056 [DOI] [PubMed] [Google Scholar]
- 10.Morsbach F., et al. , “Systematic analysis on the relationship between luminal enhancement, convolution kernel, plaque density, and luminal diameter of coronary artery stenosis: a CT phantom study,” Int. J. Cardiovasc. Imaging 29(5), 1129–1135 (2013). 10.1007/s10554-012-0173-7 [DOI] [PubMed] [Google Scholar]
- 11.Toepker M., et al. , “Accuracy of dual-source computed tomography in quantitative assessment of low density coronary stenosis-a motion phantom study,” Eur. Radiol. 20(3), 542–548 (2010). 10.1007/s00330-009-1587-z [DOI] [PubMed] [Google Scholar]
- 12.Toepker M., et al. , “Stenosis quantification of coronary arteries in coronary vessel phantoms with second-generation dual-source CT: influence of measurement parameters and limitations,” Am. J. Roentgenol. 201(2), W227–W234 (2013). 10.2214/AJR.12.9453 [DOI] [PubMed] [Google Scholar]
- 13.Penzkofer T., et al. , “Influence of trigger type, tube voltage and heart rate on calcified plaque imaging in dual source cardiac computed tomography: phantom study,” BMC Med. Imaging 14(1), 30 (2014). 10.1186/1471-2342-14-30 [DOI] [PMC free article] [PubMed] [Google Scholar]
- 14.Cilla M., Peña E., Martínez M. A., “3D computational parametric analysis of eccentric atheroma plaque: influence of axial and circumferential residual stresses,” Biomech. Model. Mechanobiol. 11(7), 1001–1013 (2012). 10.1007/s10237-011-0369-0 [DOI] [PubMed] [Google Scholar]
- 15.Qian M., et al. , “Two-dimensional flow study in a stenotic artery phantom using ultrasonic particle image velocimetry,” in Annual Int. Conf. of the IEEE Engineering in Medicine and Biology Society (EMBC), pp. 563–566 (2011). 10.1109/IEMBS.2011.6090104 [DOI] [PubMed] [Google Scholar]
- 16.Dey D., et al. , “Comparison of quantitative atherosclerotic plaque burden from coronary CT angiography in patients with first acute coronary syndrome and stable coronary artery disease,” J. Cardiovasc. Comput. Tomogr. 8(5), 368–374 (2014). 10.1016/j.jcct.2014.07.007 [DOI] [PubMed] [Google Scholar]
- 17.Shechter G., Resar J. R., McVeigh E. R., “Displacement and velocity of the coronary arteries: cardiac and respiratory motion,” IEEE Trans. Med. Imaging 25(3), 369–375 (2006). 10.1109/TMI.2005.862752 [DOI] [PMC free article] [PubMed] [Google Scholar]
- 18.Baillargeon B., et al. , “The living heart project: a robust and integrative simulator for human heart function,” Eur. J. Mech. A Solids 48, 38–47 (2014). 10.1016/j.euromechsol.2014.04.001 [DOI] [PMC free article] [PubMed] [Google Scholar]
- 19.Gordon S. L., “Evaluation of morphology descriptors in CT images of the aorta as indicators of the presence of plaque,” Dimension Contemporary German Arts and Letters (2009).
- 20.Fotina I., et al. , “Critical discussion of evaluation parameters for inter-observer variability in target definition for radiation therapy,” Strahlenther. Onkol. 188(2), 160–167 (2012). 10.1007/s00066-011-0027-6 [DOI] [PubMed] [Google Scholar]
- 21.Hallgren K. A., “Computing inter-rater reliability for observational data: an overview and tutorial,” Tutorials Quant. Methods Psychol. 8(1), 23–34 (2012). 10.20982/tqmp.08.1.p023 [DOI] [PMC free article] [PubMed] [Google Scholar]
- 22.Cury R. C., et al. , “CAD-RADS(TM) coronary artery disease—reporting and data system. An expert consensus document of the Society of Cardiovascular Computed Tomography (SCCT), the American College of Radiology (ACR) and the North American Society for Cardiovascular Imaging (NASCI). Endorsed by the American College of Cardiology,” J. Cardiovasc. Comput. Tomogr. 10, 269–281 (2016). 10.1016/j.jcct.2016.04.005 [DOI] [PubMed] [Google Scholar]
- 23.Schroeder S., et al. , “Accuracy of density measurements within plaques located in artificial coronary arteries by x-ray multislice CT: results of a phantom study,” J. Comput. Assist. Tomogr. 25(6), 900–906 (2001). 10.1097/00004728-200111000-00013 [DOI] [PubMed] [Google Scholar]


