

Abstract
Background
Postprandial proximal gastric acid pocket (PPGAP) plays important roles in gastroesophageal reflux disease (GERD). In this study, we analyzed the characteristics of PPGAP in GERD.
Material/Methods
There were 17 normal participants and 20 GERD patients who completed a gastroesophageal reflux disease questionnaire (GerdQ) and underwent a gastroscopy, a high-resolution manometry, an esophageal 24-hour pH monitoring, and a station pull-through pH monitoring to assess their symptomatic degree, endoscopic change, acid exposure, and PPGAP.
Results
PPGAP was present in all participants. Compared with normal participants, the PPGAP in GERD patients was significantly different, thus the disappearing time was significantly later (p<0.001), the lasting time was significantly longer (p<0.001), the length was significantly longer (p<0.001), and the lowest pH and the mean pH were significantly lower (p<0.001). The length of PPGAP in GERD patients was positively correlated with GerdQ score (p<0.05). The disappearing time, the lasting time, and the length of PPGAP in GERD patients was positively correlated with the DeMeester score (p<0.01). The lowest pH and the mean pH of PPGAP in GERD patients was negatively correlated with the DeMeester score (p<0.001).
Conclusions
PPGAP was generally present. PPGAP in GERD patients had characteristics of long time period, long length, and high acidity. Its length was positively correlated with subjective symptomatic degree. Its period, length, and acidity were positively correlated with the objective acid exposure. PPGAP seems to be the originator of acid reflux events and plays important roles in GERD.
MeSH Keywords: Esophageal pH Monitoring, Gastric Acid, Gastroesophageal Reflux
Background
Gastroesophageal reflux disease (GERD) is a disease associated with discomfort symptoms and/or complications due to the reflux of gastric contents into esophagus [1]. GERD is characterized by typical symptoms, such as heartburn and regurgitation, and causes impairment in quality of life. In addition, GERD can cause complications of the esophagus, like Barrett’s esophagus and esophageal adenocarcinoma. According to systematic reviews, the prevalence of GERD increased to 20% in Western countries and 10% in Asia [2,3]. Over the last 15 years, the morbidity of GERD, Barrett’s esophagus, and esophageal adenocarcinoma has significantly increased [3,4]. Thus, GERD has become a significant health problem and influences patients’ quality of life and life safety seriously.
Due to the escape of neutralization by food, a highly acid area (the pH lower than 4) in the proximal stomach, between distally (food) and proximally (lower esophageal sphincter or distal esophagus) exists, thus designated as the postprandial proximal gastric acid pocket (PPGAP) [5]. The frequency of gastroesophageal reflux can increase four to seven times after meals in GERD patients [5], and their typical symptoms usually occur 30 to 60 minutes after meals. However, paradoxically, this is the period when the intragastric contents are their least acidic because of the buffering effect of food [6]. The refluxate may be more acidic than the intragastric content. This paradox indicates that there is an unbuffered highly acid area in the stomach. In 2001, Fletcher et al. [6] studied this phenomenon in 10 healthy volunteers by gastroesophageal pH monitoring and found an unbuffered area in the proximal stomach with a mean pH of 1.6. They named it “acid pocket”. Thereafter, the PPGAP was demonstrated in normal participants and GERD patients successively [7–11]. These studies also found that the pH of PPGAP in GERD patients was lower than that in normal individuals, and the length was longer. PPGAP seems to be the originator of acid reflux events, and plays an important role in GERD.
The aim of this study was to confirm whether the PPGAP exists in normal participants and GERD patients, to compare the differences of PPGAP between GERD patients and normal participants, and to analyze correlations between length, time, and acidity of PPGAP and GerdQ scores and DeMeester scores in GERD patients.
Material and Methods
Study participants
Inclusion criteria for normal participants included: 1) no gastrointestinal symptoms, history of GERD, peptic ulcer disease, functional dyspepsia, irritable bowel syndrome, or prior surgery on gastrointestinal tract, 2) no organic disease on gastroscopy, and 3) esophageal 24-hour pH monitoring was negative.
Inclusion criteria for GERD patients included: 1) experienced reflux symptoms for at least three months, 2) gastroesophageal reflux disease questionnaire (GerdQ) scores were positive, 3) no organic disease except reflux esophagitis or Barrett’s esophagus on gastroscopy, and 4) esophageal 24-hour pH monitoring was positive.
Exclusion criteria for all study participants included: 1) <18 years or >65 years, 2) any acidic inhibitor or prokinetic agent during the preceding 10 days, mucus membrane protection drugs during the preceding three days, systemic glucocorticosteroids or anti-inflammatory drugs on more than three consecutive days or PPI-based therapy for the eradication of Helicobacter pylori during the preceding 28 days, 3) pregnant or lactating, 4) prior surgery on gastrointestinal tract, and 5) any severe disease of another major body system.
Study protocol
Gastroesophageal reflux disease questionnaire (GerdQ)
All of the GERD patients were required to complete a GerdQ to assess the symptomatic degree of gastroesophageal reflux. GerdQ is a questionnaire comprising six items [12]. The sum of the scores was the GerdQ score, ranging from 0–18, with a GerdQ score ≥8 indicative positive.
Gastroscopy
All of the participants underwent gastroscopy examination to understand whether they had an upper gastrointestinal disease.
Esophageal 24-hour pH monitoring
All participants underwent esophageal 24-hour pH monitoring (MMS) to understand the degree of their gastroesophageal acid reflux. A DeMeester score >14.72 indicated positive; a DeMeester score ≤ 14.72 indicated negative.
High-resolution manometry
All participants had a high-resolution manometry (MMS), which identifies and recorded the location of their lower border of the lower esophageal sphincter (LBLES).
Station pull-through pH monitoring
In this study, we detected the PPGAP using the method of Fletcher et al. [6]. All of the participants underwent a station pull-through pH monitoring (MMS) examination. First, a pH catheter was used, with the patient a sitting position, from the location of 5 cm below the LBLES up to the distal esophagus 0.5 cm incrementally, with the patient a fasting state. Specifically, a pH catheter was placed at 5 cm below the LBLES and the pH there was recorded. Then the pH catheter was pulled out 0.5 cm per 30 seconds and the pH of relevant position was recorded, until reaching the esophagus. Second, the pH catheter was replaced 5 cm below the LBLES and the participants were given a standardized meal (200 g of graham bread + 90 g of ham sausage + 150 mL of water). Third, the pH catheter procedure was performed from the location of 5 cm below the LBLES up to the distal esophagus, 0.5 cm incrementally as before, and the pH of the relevant position was recorded. This process was repeated from the finish of eating to the disappearance of the PPGAP.
All of these tests were completed by the same experienced investigators.
PPGAP assessment
The PPGAP is defined as a highly acid area (pH <4) in the proximal stomach between distally (food) and proximally (LES or distal esophagus) [5]. We recorded the time the PPGAP appeared and disappeared, and the length and the pH of the PPGAP.
Statistics
Data are presented as the mean ± standard deviation (SD). Comparisons of the demographics characteristics, intragastric pH, DeMeester scores, and PPGAP between the normal participants and GERD patients were analyzed using chi-square test and independent-samples t-test. The comparison of the intragastric pH after a standardized meal and in the fasting state was analyzed using paired-samples t-test. The relationships between the PPGAP and GerdQ scores, the PPGAP and DeMeester scores in GERD patients were analyzed using linear regression. A p value less than 0.05 was considered to be statistically significant. All of the statistical analyses were performed using SPSS software (Version 20.0; IBM Corp., Armonk, NY, USA).
Ethics
The study was reviewed and approved by the local ethics committee. The approval number is 2016219. Informed written consent was obtained from all of the participants
Results
Demographics characteristics
Here were 17 normal participants and 20 GERD patients who completed this study.
The demographic characteristics were generally balanced. There were no significant differences in age (42.71±8.43 years versus 46.60±8.83 years, p=0.181), sex (male: female ratio was 10: 7 versus 12: 8; p=0.942) or body mass index (BMI) (22.47±3.30 kg/m2 versus 21.96±2.33 kg/m2; p=0.591) between the two groups.
GerdQ scores
All of the normal participants had no gastrointestinal symptoms.
All of the GERD patients showed varying degrees of symptoms, such as heartburn and regurgitation. Their GerdQ scores were all positive (≥8). The mean GerdQ score was 12.70±2.68.
DeMeester scores
The DeMeester scores in the GERD patients were significant higher than in the normal participants (62.79±27.60 versus 5.29±3.65, p<0.001).
Intragastric pH
The intragastric contents were acidic in the fasting state in the normal participants and the GERD patients, and their mean pH was 1.64±0.40 and 1.59±0.31, respectively (p=0.633). After a standardized meal, the intragastric pH showed a significant increase in both the normal participants (p<0.001) and the GERD patients (p<0.001). Their mean pH increased to 5.65±0.48 and 5.46±0.47, respectively (p=0.238) (Figure 1).
Figure 1.
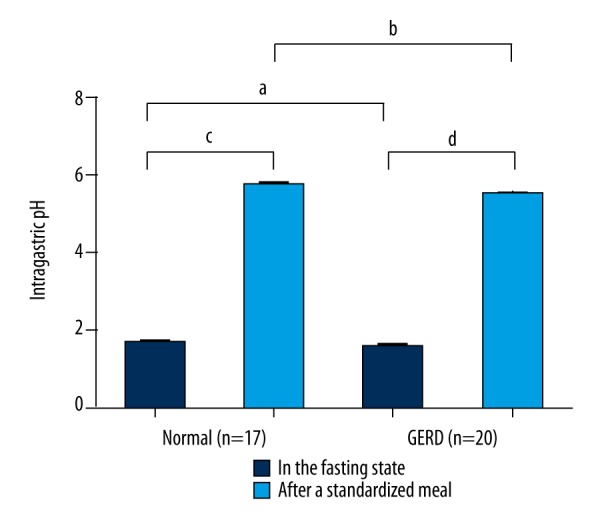
The intragastric pH in the fasting state and after a standardized meal in normal participants and GERD patients. There was no significant difference in the fasting state (a p>0.05) or after a standardized meal (b p>0.05) between the two groups. After a standardized meal, the intragastric pH showed an increase in both normal participants (c p<0.001) and GERD patients (d p<0.001). GERD – gastroesophageal reflux disease.
PPGAP
Our study showed that PPGAP was present in all of the GERD patients and normal participants.
The PPGAP appeared 18.47±10.74 minutes and 14.25±9.72 minutes after a standardized meal in the normal participants and the GERD patients, respectively, with no significant difference (p=0.218). However, the PPGAP in the GERD patients disappeared significantly later compared with the PPGAP in the normal participants (132.65±45.22 minutes versus 74.53±30.64 minutes, p<0.001). Thus, the lasting time of the PPGAP in the GERD patients was significantly longer (118.50±49.70 minutes versus 55.59±34.25 minutes, p<0.001). The length of the PPGAP in the GERD patients was significantly longer (5.00±2.34 cm versus 1.88±1.11 cm, p<0.001). The PPGAP in the GERD patients was significantly more acidic than the PPGAP in the normal participants. Their lowest pH and mean pH were significantly lower (1.01±0.40 versus 1.67±0.49, p<0.001; 1.30±0.47 versus 2.03±0.43, p<0.001, respectively) (Figure 2).
Figure 2.

The PPGAP in normal participants and GERD patients. There was no significant difference in the appearing time of PPGAP (p>0.05) between the two groups. Compared to normal participants, in GERD patients the disappearing time of PPGAP was later, the lasting time of PPGAP was longer, the length of PPGAP was longer, the lowest pH of PPGAP was lower, and the mean pH of PPGAP was lower (*** p<0.001). PPGAP – postprandial proximal gastric acid pocket; GERD – gastroesophageal reflux disease.
PPGAP and GerdQ scores in GERD patients
The length of the PPGAP in the GERD patients showed a significant positive correlation with the GerdQ score (r2=0.254, p=0.023). However, there was no linearity between the appearing time of the PPGAP, disappearing time of the PPGAP, lasting time of the PPGAP, lowest pH of the PPGAP, mean pH of the PPGAP and the GerdQ score (p=0.385, p=0.072, p=0.068, p=0.385, and p=0.422, respectively) (Figure 3).
Figure 3.

The relationships between PPGAP and GerdQ scores in the GERD patients. The length of PPGAP positively correlated with GerdQ score (* p<0.05). There were no linearity between the appearing time of PPGAP, the disappearing time of PPGAP, the lasting time of PPGAP, the lowest pH time of PPGAP, the mean pH time of PPGAP and the GerdQ scores (p>0.05). PPGAP – postprandial proximal gastric acid pocket; GerdQ – gastroesophageal reflux disease questionnaire; GERD – gastroesophageal reflux disease.
PPGAP and DeMeester scores in GERD patients
The disappearing time, the lasting time, and the length of the PPGAP in the GERD patients showed a significant positive correlation with the DeMeester score (r2=0.446, p=0.001; r2=0.421, p=0.002; r2=0.400, p=0.003, respectively). The lowest pH and the mean pH of the PPGAP in the GERD patients showed a significant negative correlation with the DeMeester score (r2=0.702, p<0.001; r2=0.777, p<0.001, respectively). There was no linearity between the appearing time of the PPGAP with the DeMeester score (p=0.076) (Figure 4).
Figure 4.

The relationships between PPGAP and DeMeester scores in GERD patients. The disappearing time of PPGAP, the lasting time of PPGAP, and the length of the PPGAP in GERD patients was positively correlated with the DeMeester score (** p<0.01). The lowest pH of PPGAP and the mean pH of PPGAP in GERD patients was negatively correlated with the DeMeester score (*** p<0.001). There was no linearity between the appearing time of PPGAP with the DeMeester score (p>0.05). GERD – gastroesophageal reflux disease.
Discussion
PPGAP is an unbuffered, highly acidic area that accumulates in the proximal stomach postprandially. Fletcher et al. [6] found the pH of PPGAP was 1.6, and it could persist for up to two hours after meals. Over the last 15 years, other studies also noticed the presence of PPGAP [7–11,13]. The PPGAP could serve as a reservoir for acidic gastroesophageal reflux and has important clinical implications. However, the PPGAP is still poorly understood. Because of technical difficulty, some of the previous studies detected PPGAP using fixed pH catheters, resulting in inexact conclusion. In our study, we performed a station pull-through pH monitoring to detect the PPGAP. Some of the previous studies compared the differences of the PPGAP in GERD patients and normal participants, while none of them analyzed the correlation between the PPGAP and the severity of subjective symptoms and objective acid exposure in GERD. In our study, we analyzed the differences of the PPGAP between normal participants and GERD patients and analyzed the correlation between the length, time, and acidity of the PPGAP and the GerdQ scores and the DeMeester scores in GERD patients.
Meals are known to buffer the intragastric pH, which often increase to 5 or more [6]. Our results showed that the intragastric pH increased to 5.5 after a standardized meal, from 1.6 in the fasting state. By performing station pull-through pH monitoring, we observed a dynamic change in the pH from the stomach body to the distal esophagus, not only in the fasting state but also after meals. As expected, an unbuffered layer of acidity, (pH <4) in the proximal stomach after a standardized meal was detected. Previous studies have shown different manifestations of PPGAP [6,13,14]. Our results showed that the PPGAP was present in all of the GERD patients and the normal participants. Fletcher et al. [6] found the PPGAP with a mean pH of 1.6, extending from the cardia across the esophagogastric junction 1.8 cm into the distal esophagus. Clarke et al. [8] and Beaumont et al. [13] found the PPGAP in GERD patients extended longer than in normal participants, however, little information concerning the acidity and duration of the PPGAP where provided due to the limitations of the study design and technical issues. In our study, we compared the appearing time, disappearing time, lasting time, length, lowest pH, and mean pH of the PPGAP between GERD patients and normal participants.
After meals, the acidity of the intragastric contents decreased owing to the buffering effect of food. However, the intragastric contents were not a uniform layer. The hydrophilic acid gastric juice has been shown to float on the top of a hydrophobic fatty meal [10]. On the other hand, gastric contractions have been shown to start distal to the proximal stomach [6], so the most proximal part of the stomach is relatively quiescent after a meal. Based on the aforementioned factors, the PPGAP appears after meals. Our results showed the PPGAP appeared 18 minutes and 14 minutes after a standardized meal in the normal participants and the GERD patients, respectively. This time was earlier than the time that acid reflux events and typical symptoms, such as heartburn and regurgitation are reported to occur (30 to 60 minutes after the intake of meals). Thus, the PPGAP may play an important role in gastroesophageal reflux. Due to the peristalsis of the stomach, the intragastric contents are gradually digested and emptied. The PPGAP also disappears. Our results showed that the PPGAP in the GERD patients disappeared 133 minutes after a standardized meal. Acid reflux events and typical symptoms are known to persist for two hours after meals in GERD patients, which was similar to our results. In the normal participants, acid reflux is usually physiological, with a lower acidity and a shorter time. Our results showed the PPGAP disappeared significantly earlier (75 minutes) in the normal participants. The lasting time of PPGAP was the time from PPGAP appearance to PPGAP disappearance. During this period, the pH of the proximal stomach was lower than 4, creating a condition in which the pH of the refluxate became lower than 4. Thus, without the PPGAP, no acid reflux occurred. Our results showed the lasting time of the PPGAP was significantly longer in GERD patients (119 minutes) than in the normal participants (56 minutes), a finding that was coincident with the phenomenon that acid reflux is more serious in GERD patients.
All previous studies have shown that the length of the PPGAP is longer in GERD patients [8,13]. Our results showed the same conclusion. The length of the PPGAP was significantly longer in the GERD patients (5.0 cm) than in the normal participants (1.88 cm). In the GERD patients, the PPGAP actually traversed the squamocolumnar junction after a standardized meal, exposing the distal esophageal mucosa to highly acidic gastric juice, resulting in typical symptoms. The long-term highly acidic exposure of the distal esophagus and gastroesophageal junction would thus lead to the genesis of reflux esophagitis, esophageal stricture, Barrett’s esophagus and esophageal adenocarcinoma.
The PPGAP was highly acidic. The pH was less than 4, usually reaching a value less than 2. If the PPGAP was more acidic, gastroesophageal reflux would be more frequent and more severe. Our results showed that the PPGAP in the GERD patients was significantly more acidic than that in the normal participants. In the GERD patients, the mean pH was 1.29, and the pH peak reached 1.01. In the normal participants, the mean pH was 2.03, and the pH peak reached 1.67.
GerdQ scores can assess the subjective symptomatic degree of GERD [12]. However, the severity of subjective symptoms in GERD is not only caused by acidity exposure, but also has a close correlation with visceral high sensitivity [15]. Our results only showed that the length of the PPGAP in the GERD patients had a significantly positive correlation with the GerdQ score. However, there was no linearity between the appearing time of the PPGAP, disappearing time of the PPGAP, lasting time of the PPGAP, lowest pH time of the PPGAP, mean pH time of the PPGAP, and the GerdQ score. In the GERD patients, the longer PPGAP actually traversed the squamocolumnar junction, exposing the distal esophagus to a highly acidic environment. The distal esophagus was highly sensitive to the acidic environment, resulting in typical symptoms, and a higher GerdQ score.
The DeMeester scores can assess the objective acid exposure in GERD. The DeMeester score can reflect the time and number of acid reflux, the number of long period acid reflux, the time of the longest acid reflux, and so on. Our results showed that the lasting time of the PPGAP, length of the PPGAP, and the acidity of the PPGAP in the GERD patients had a significantly positive correlation with the DeMeester scores. This directly illustrated that the objective acid exposure was closely related to the PPGAP. The PPGAP was the direct cause of acid gastroesophageal reflux.
So the PPGAP represents a source from which acid reflux events originated and thus significantly contributed to the pathophysiology of GERD. The potential importance of the PPGAP as a therapeutic target for GERD would be of valued worldwide.
Conclusions
Our study showed that the PPGAP existed in both the normal participants and the GERD patients. Compared with the normal participants, in the GERD patients the PPGAP lasted longer, the length was longer, and the acidity was higher. The length of the PPGAP in the GERD patients showed a significant positive correlation with the GerdQ score. The lasting time, length, and acidity of the PPGAP in the GERD patients positively correlated with the DeMeester score. PPGAP seems to be the originator of acid reflux events, and it plays important roles in GERD. So the PPGAP can be an effective therapeutic target for GERD patients in the future.
Footnotes
Conflict of interests
None.
Source of support: Departmental sources
References
- 1.Vakil N, van Zanten SV, Kahrilas P, et al. Global Consensus Group. The Montreal definition and classification of gastroesophageal reflux disease: A global evidence-based consensus. Am J Gastroenterol. 2006;101(8):1900–20. doi: 10.1111/j.1572-0241.2006.00630.x. [DOI] [PubMed] [Google Scholar]
- 2.Jung HK. Epidemiology of gastroesophageal reflux disease in Asia: A systematic review. J Neurogastroenterol Motil. 2011;17(1):14–27. doi: 10.5056/jnm.2011.17.1.14. [DOI] [PMC free article] [PubMed] [Google Scholar]
- 3.El-Serag HB, Sweet S, Winchester CC, Dent J. Update on the epidemiology of gastro-oesophageal reflux disease: A systematic review. Gut. 2014;63(6):871–80. doi: 10.1136/gutjnl-2012-304269. [DOI] [PMC free article] [PubMed] [Google Scholar]
- 4.Schneider JL, Corley DA. A review of the epidemiology of Barrett’s oesophagus and oesophageal adenocarcinoma. Best Pract Res Clin Gastroenterol. 2015;29(1):29–39. doi: 10.1016/j.bpg.2014.11.008. [DOI] [PMC free article] [PubMed] [Google Scholar]
- 5.Herbella FA, Vicentine FP, Silva LC, Patti MG. Postprandial proximal gastric acid pocket and gastroesophageal reflux disease. Dis Esophagus. 2012;25(7):652–55. doi: 10.1111/j.1442-2050.2011.01293.x. [DOI] [PubMed] [Google Scholar]
- 6.Fletcher J, Wirz A, Young J, et al. Unbuffered highly acidic gastric juice exists at the gastroesophageal junction after a meal. Gastroenterology. 2001;121(4):775–83. doi: 10.1053/gast.2001.27997. [DOI] [PubMed] [Google Scholar]
- 7.Simonian HP, Vo L, Doma S, et al. Regional postprandial differences in pH within the stomach and gastroesophageal junction. Dig Dis Sci. 2005;50(12):2276–85. doi: 10.1007/s10620-005-3048-0. [DOI] [PubMed] [Google Scholar]
- 8.Clarke AT, Wirz AA, Manning JJ, et al. Severe reflux disease is associated with an enlarged unbuffered proximal gastric acid pocket. Gut. 2008;57(3):292–97. doi: 10.1136/gut.2006.109421. [DOI] [PubMed] [Google Scholar]
- 9.Morgan D, Pandolfino J, Katz PO, et al. Clinical trial: Gastric acid suppression in Hispanic adults with symptomatic gastro-oesophageal reflux disease – comparator study of esomeprazole, lansoprazole and pantoprazole. Aliment Pharmacol Ther. 2010;32(2):200–8. doi: 10.1111/j.1365-2036.2010.04335.x. [DOI] [PubMed] [Google Scholar]
- 10.Vo L, Simonian HP, Doma S, et al. The effect of rabeprazole on regional gastric acidity and the postprandial cardia/gastro-oesophageal junction acid layer in normal subjects: A randomized, double-blind, placebo-controlled study. Aliment Pharmacol Ther. 2005;21(11):1321–30. doi: 10.1111/j.1365-2036.2005.02489.x. [DOI] [PubMed] [Google Scholar]
- 11.Hila A, Bouali H, Xue S, et al. Postprandial stomach contents have multiple acid layers. Journal of Clinical Gastroenterology. 2006;40(7):612–17. doi: 10.1097/00004836-200608000-00010. [DOI] [PubMed] [Google Scholar]
- 12.Jones R, Junghard O, Dent J, et al. Development of the GerdQ, a tool for the diagnosis and management of gastro-oesophageal reflux disease in primary care. Aliment Pharmacol Ther. 2009;30(10):1030–38. doi: 10.1111/j.1365-2036.2009.04142.x. [DOI] [PubMed] [Google Scholar]
- 13.Beaumont H, Bennink RJ, de Jong J, Boeckxstaens GE. The position of the acid pocket as a major risk factor for acidic reflux in healthy subjects and patients with GORD. Gut. 2010;59(4):441–51. doi: 10.1136/gut.2009.178061. [DOI] [PubMed] [Google Scholar]
- 14.Boecxstaens V, Bisschops R, Blondeau K, et al. Modulation of the postprandial acid and bile pockets at the gastro-oesophageal junction by drugs that affect gastric motility. Aliment Pharmacol Ther. 2011;33(12):1370–77. doi: 10.1111/j.1365-2036.2011.04664.x. [DOI] [PubMed] [Google Scholar]
- 15.Szczesniak MM, Fuentealba SE, Cook IJ. Acid sensitization of esophageal mucosal afferents: implication for symptom perception in patients across the gastroesophageal reflux disease spectrum. Clin J Pain. 2013;29(1):70–77. doi: 10.1097/AJP.0b013e3182478826. [DOI] [PubMed] [Google Scholar]