

Abstract
Objective
To evaluate the utility of nerve diffusion tensor imaging (DTI), nerve cross‐sectional area, and muscle magnetic resonance imaging (MRI) multiecho Dixon for assessing proximal nerve injury in chronic inflammatory demyelinating polyneuropathy (CIDP).
Methods
In this prospective observational cohort study, 11 patients with CIDP and 11 healthy controls underwent a multiparametric MRI protocol with DTI of the sciatic nerve and assessment of muscle proton‐density fat fraction of the biceps femoris and the quadriceps femoris muscles by multiecho Dixon MRI. Patients were longitudinally evaluated by MRI, clinical examination, and nerve conduction studies at baseline and after 6 months.
Results
In sciatic nerves of CIDP patients, mean cross‐sectional area was significantly higher and fractional anisotropy value was significantly lower, compared to controls. In contrast, muscle proton‐density fat fraction was significantly higher in thigh muscles of patients with CIDP, compared to controls. MRI parameters showed high reproducibility at baseline and 6 months.
Interpretation
Advanced MRI parameters demonstrate subclinical proximal nerve damage and intramuscular fat accumulation in CIDP. Data suggest DTI and multiecho Dixon MRI might be useful in estimating axonal damage and neurogenic muscle changes in CIDP.
Introduction
Chronic inflammatory demyelinating polyneuropathy (CIDP) is an autoimmune disorder that in most patients requires permanent or repetitive immunomodulatory treatment.1, 2, 3 Current clinical, serological, and electrophysiological features of CIDP lack sensitivity to provide reliable information for diagnosis, disease progression, and treatment response.4, 5, 6, 7 Thus, novel, serially applicable noninvasive biomarkers are urgently needed.
Proximal nerve injury has been recognized for a long time as a characteristic feature of CIDP, in contrast to many other neuropathies.8, 9, 10 However, the assessment of proximal nerve injury is hampered due to the limited accessibility of proximal nerves by standard nerve conduction studies. In addition to its value for the diagnosis, weakness, and atrophy of proximal muscles are also prognostic factors for the clinical course and treatment response in CIDP.9, 11, 12
MRI neurography can be used to visualize peripheral nerves in humans.13, 14, 15, 16, 17 This method is useful to provide anatomical data and to detect pathologies such as tumors that affect the continuity of nerves.18, 19 More recently, diffusion tensor imaging of peripheral nerves has been introduced as a tool to quantify nerve damage and regeneration.20, 21, 22
The purpose of our study was to develop a multiparametric MRI protocol for the proximal lower limb in order to assess nerve injury and neurogenic muscle atrophy in patients with CIDP. Based on a previous study that found DTI a suitable diagnostic tool for the evaluation of proximal nerve segments,23 this paradigm included diffusion tensor imaging (DTI) of the sciatic nerve. To explore changes in the muscle texture, we used a chemical shift encoding‐based water–fat separation technique to quantify the proton‐density fat fraction (PDFF) on a 0–100% scale. PDFF mapping has recently been introduced as a noninvasive biomarker for disease progression in different neuromuscular disorders including Charcot‐Marie‐Tooth (CMT) –Neuropathy.24, 25, 26, 27 We hypothesized that in CIDP, proximal nerve damage, and neurogenic muscle atrophy can be accurately visualized by these two techniques.
Materials and Methods
Patients and healthy controls
Eleven patients (five female, six male, mean age 56 ± 11 years) with CIDP and eleven healthy controls (3 female, 8 male, mean age 48 ± 10 years) were included in this study. CIPD was diagnosed according to guidelines of the Peripheral Nerve Society.28 Exclusion criteria were neuropathies of other causes and contraindications against MRI. Controls were matched by height, weight, and age. Clinical characteristics are provided in Table 1. All patients with CIDP were on IVIg treatment (1g/kg bodyweight every 4 weeks, mean duration 4.67 ± 1.5 years). The study was approved by the local Ethics Committee, and all subjects gave written informed consent prior to study inclusion.
Table 1.
Clinical characteristics
| CIDP | Controls | P value | |
|---|---|---|---|
| Sex (female:male) | 5:6 | 3:8 | |
| Height (cm) | 175.5 (9.9) | 182.0 (9.6) | 0.14 (n.s.) |
| Weight (kg) | 82.1 (17.3) | 76.0 (16.4) | 0.64 (n.s) |
| Age (years) | 56.1 (10.8) | 48.3 (9.5) | 0.10 (n.s.) |
| Disease duration (years) | 4.67 (3.63) | ||
| INCAT (0–10, median, t0) | 1 (0–2) | ||
| INCAT (0–10, median, t1) | 1 (0–3) |
Clinical and electrophysiological assessment
All patients underwent a detailed clinical and electrophysiological evaluation as well as an MRI scan at the beginning of the study (baseline, t = 0). All patients were available for follow‐up visits and MRI scans 6 months later (mean 6.5 ± 1 month). Clinical assessment included a complete neurological examination. Functional disability was assessed by use of established functional scores including the Medical Research Council (MRC) sum score and the INCAT scale. Briefly, the MRC sum score summarizes the MRC grades (0‐5) of six paired muscle groups (upper arm abductors, elbow flexors, wrist extensors, hip flexors, knee extensors, and foot dorsal flexors) with a maximum score of 60 points. The MRC sum score for the right leg (maximum 15 points), separately, was also included for analysis. The INCAT score assesses functional disability for upper and lower limbs in a total score ranging from 0 (no signs of disability) to 10 (severely disabled).29
For electrophysiological examinations, standard nerve conduction studies were performed.30 Distal motor latencies (DML), proximal and distal compound muscle action potential (CMAP) amplitudes, and motor nerve conduction velocity (mNCV) were measured for the right tibial and peroneal nerve. F‐waves were recorded for the right tibial and peroneal nerve. Sensory nerve action potential (SNAP) amplitudes and sensory nerve conduction velocity (sNCV) of the right sural nerve were recorded antidromically. Standard EMG of the tibialis anterior, quadriceps, and biceps femoris muscles was performed using conventional EMG equipment and concentric needle electrodes.
MRI data acquisition and analysis
MRI was performed on a 3 T whole‐body MR system (Ingenia, Philips Healthcare, Best, The Netherlands). Subjects were examined feet first in supine position. A 16‐channel knee coil (dStream T/R Knee 16ch coil, Philips Healthcare, Best, The Netherlands) was employed for signal transmission and reception. The individuals' right thighs were placed deep into the coil with the center of the coil positioned 10–20 cm cranially of the superior pole of the patella. A cushion mat was used to adapt the level of the patient's backside to the lower edge of the coils aperture. The distal parts of the legs were immobilized with cushions.
Localizer images in three planes were acquired to map the subject's patella in the lower part of the sagittal image.
A high‐resolution three‐dimensional T2‐weighted turbo spin echo (3D T2 TSE) sequence with fat and vessel signal suppression was used to locate the sciatic nerve in all spatial planes.31, 32, 33 The parameters were as follows: TR = 2000, TE = 273, matrix size 216 × 143 × 143, resolution 1.25 × 1.25 × 0.7 mm3, scan duration 2:30 min (Fig. 2A and B).
Figure 2.
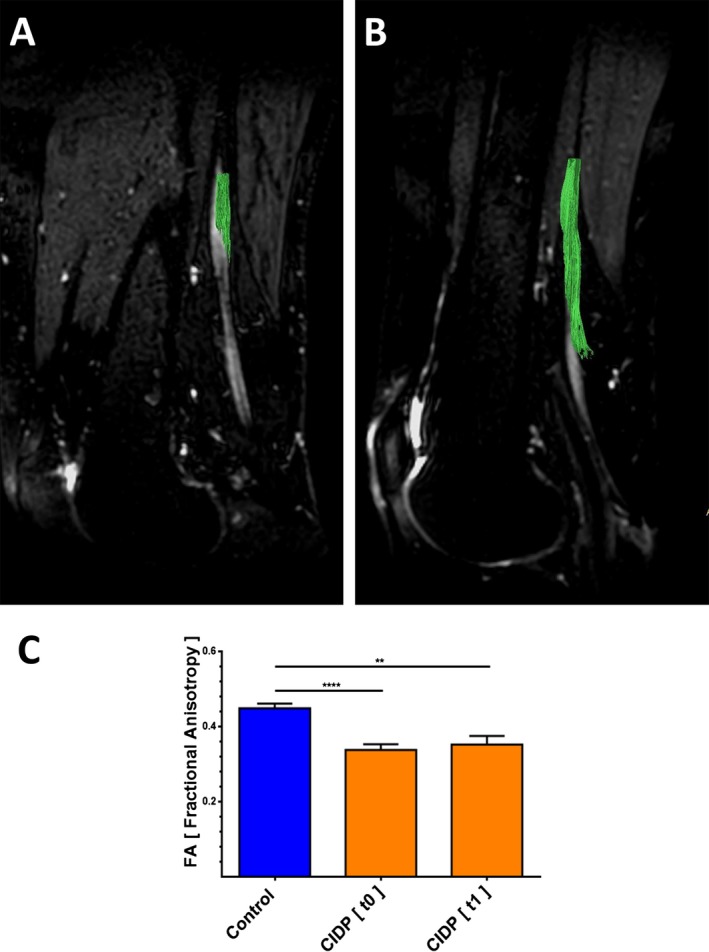
Tractography and fractional anisotropy (FA) in the proximal sciatic nerve segment of patients with CIDP and healthy controls. (A, B) Illustration of FA (fractional anisotropy) sampling location in a sagittal mid‐section 3D T2 TSE‐image of a patient with CIDP (A) and a healthy control (B). The course of the sciatic nerve is visualized by deterministic fiber tracking. Subjects right‐sided thighs were positioned deep into the Tx/Rx 8‐channel knee coil to have the center of the DTI stack and hence the FA sampling location positioned 10–20 cm cranially of the patella's upper edge (Fiber tractography was performed with IntelliSpace Portal 7.0, Philips Healthcare, Amsterdam, The Netherlands). (C) Average FA values of sciatic nerves are lower in patients with CIDP at baseline (t0) and at 6 months follow‐up (t1) compared to healthy controls.
The center of the stacks of an anatomical T2‐weighted mDixon TSE (2D T2 TSE) and the DTI scan were then positioned 10–20 cm cranially of the patella's upper edge and oriented perpendicular to the sciatic nerve based on the 3D T2 TSE scan. The high‐resolution 2D T2 TSE sequence was acquired in the transversal plane perpendicular to the sciatic nerve with the following parameters: TR = 2500 msec, TE = 60 msec, matrix size 640 × 468, 30 slices with 4 mm slice thickness and no interslice gap, resolution 0.3 × 0.4 × 4 mm3, scan duration 5 min.
DTI data were acquired using a single‐shot echo planar imaging‐based sequence, and planned similar to 2D T2 TSE with the following parameters: TR = 6500 msec, TE = 62 msec, matrix size 128 × 130, 20 slices with 4 mm slice thickness and no interslice gap, resolution 1.5 × 1.5 × 4 mm3, b values of 0 sec/mm2 and 800 sec/mm2, each in 20 directions, SENSE factor of 2, scan duration 9:00 min.
For intramuscular fat quantification, a six‐echo multiecho gradient echo sequence was used (mDixon Quant, Philips Healthcare, Best, The Netherlands). The sequence was acquired on the transversal plane, including parts of the quadriceps femoris and biceps femoris muscles. Sequence parameters were as follows: TR=10 msec, 6 echoes (TE1 = 1.45 msec, ΔTE = 1.1 msec), matrix 108 × 107 × 4 mm3, voxel size 1.8 × 1.8 × 4 mm, 20 slices, flip angle 3° (to minimize T1 bias effects), acquisition time of 1:05 min. The proton‐density fat fraction quantification was based on a complex‐based water–fat separation with a signal model considering the multipeak fat spectrum and modeling a single T2* decay.34, 35
MR images were analyzed by an experienced staff radiologist (T.L.) and a fellow radiologist (K.S.). Measurements were independently assessed.
Postprocessing of raw DTI data and MRI analysis were performed with software provided by the MR system manufacturer (IntelliSpace Portal 7.0, Philips Healthcare, Amsterdam, The Netherlands). Furthermore, cross‐sectional area of the nerve was determined based on 2D T2 TSE with Agfa HealthCare PACS Software (Agfa HealthCare, IMPAX EE, Bonn, Germany). In correlation with the anatomical information of the b = 0 and the 2D T2 TSE images, six freehand ROIs in six neighboring slices of each examination were drawn in the color‐coded fractional anisotropy (FA) images. The average FA values of the six slices were averaged again to receive the final FA value.
To determine the average intramuscular fat fraction, three freehand, subtotal ROIs were drawn in each part of the quadriceps femoris muscle (vastus lateralis, intermedius, medialis, rectus femoris) as well as in the short and long heads of the biceps femoris muscle. ROIs were drawn within 2 mm within the muscle boundaries as visually inspected on the fat fraction maps on three neighboring slices. The differing area sizes (A_i) of the individual ROIs (ROI_i with individual fat fractions (FF_i)) were taken into account using the formula FF_mean_over_ROIs = sum (A_i * FF_i)/sum (A_i), where sum is the summation over all ROIs.
Statistical analysis
Statistical analysis was performed using the Mann–Whitney‐U‐Test for group comparison. Nonparametric Spearman correlation tests (graph pad prism) were used for assessing correlations. P < 0.05 was considered statistically significant.
Statistical analysis of inter‐rater agreement was performed in R 3.4.036 with RStudio 1.0.136, using the package irr37 for calculation of intraclass correlation coefficients (ICCs), and epade38 for Bland–Altman analyses. Inter‐rater agreement was tested in all patients and controls using Bland–Altman analyses, ICCs, and coefficients of variation (CV). The CV was computed as the standard deviation (SD) σ of the differences divided by the mean μ of the parameter under consideration:. ICCs were defined as excellent (ICC ≥ 0.75), good (ICC = 0.60–0.74), moderate (ICC = 0.40–0.59), and poor (ICC ≤ 0.39).39
Results
TSE MRI scans
The sciatic nerve was reliably identified in all patients and controls on 3D and 2D T2 TSE MRI scans. 2D T2 TSE MRI scans of sciatic nerve segments showed significantly larger cross‐sectional areas of the sciatic nerve in patients with CIDP at baseline (t = 0) and after 6 months (t = 1), compared to healthy controls. Mean values were 53.2 mm2 ± 6.0 (P = 0.0128) at baseline and 53.4 mm2 ± 5.0 (P = 0.0070) after 6 months compared to controls (mean 36.5 mm2 ± 2.4, Fig. 1A to C).
Figure 1.
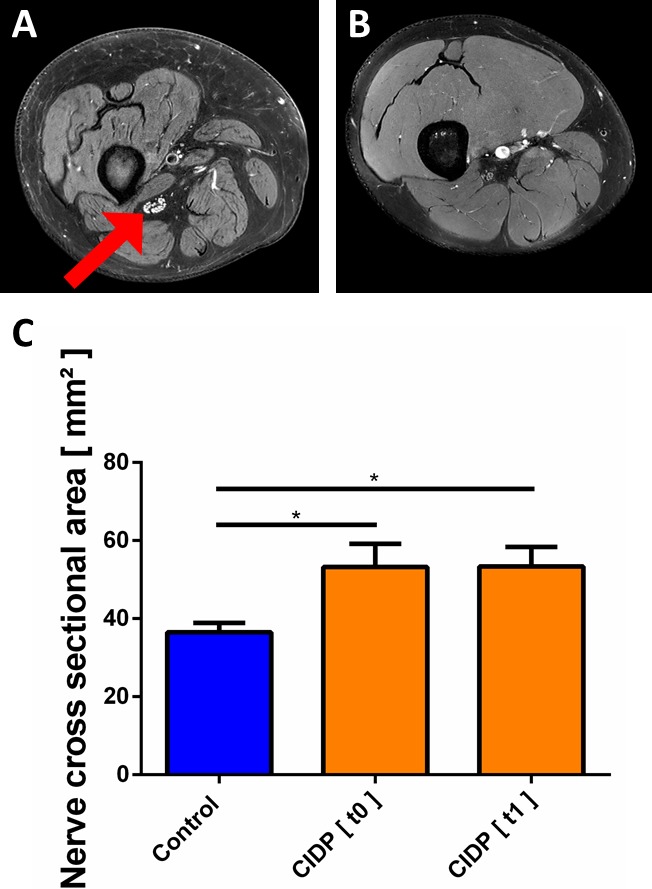
T2 of the sciatic nerve (A and B) High‐resolution axial T2 image of the right thigh. Compared to controls (B), in patients with CIDP (A) the cross‐sectional area of the sciatic nerve appeared enlarged and individual fascicles of the sciatic nerve were distinguishable (arrow). (C) Nerve cross‐sectional area was significantly higher in patients with CIDP.
DTI
DTI scans of the sciatic nerves of the patients with CIDP at baseline showed significantly lower mean FA values (0.34 ± 0.01), compared to healthy controls (0.45 ± 0.01; P < 0.001). At 6 months (t = 1), mean FA values (0.35 ± 0.02; P = 0.003) were also significantly lower compared to controls (Fig. 2A to C). Inter‐rater agreement was excellent (ICC = 0.89).
PDFF mapping
At baseline, MRI scans showed significantly higher intramuscular fat fractions in both the quadriceps femoris muscle as well as in the biceps femoris muscle in patients with CIDP compared to healthy controls. Mean values for the quadriceps femoris muscle were 5.9 ± 1.2 % (CIDP) vs. 2.9 ± 2.0% (healthy controls; P = 0.003) and for the biceps femoris muscle 9.3 ± 1.5 % (CIDP) vs. 4.3 ± 1.9 % (healthy controls; P < 0.001). Inter‐rater agreement was excellent (ICC = 0.91 for quadriceps femoris muscle and ICC = 0.89 for biceps femoris muscle).
No significant longitudinal changes were observed in follow‐up after 6 months. Mean values after 6 months were 5.7 ± 1.3% for the quadriceps femoris muscle and 9.6 ± 2.1% for the biceps femoris muscle. Furthermore, the fat fractions were still significantly higher compared to healthy controls (P = 0.0128 for the quadriceps femoris muscle and P = 0.015 for the biceps femoris muscle, Fig. 3A–C).
Figure 3.
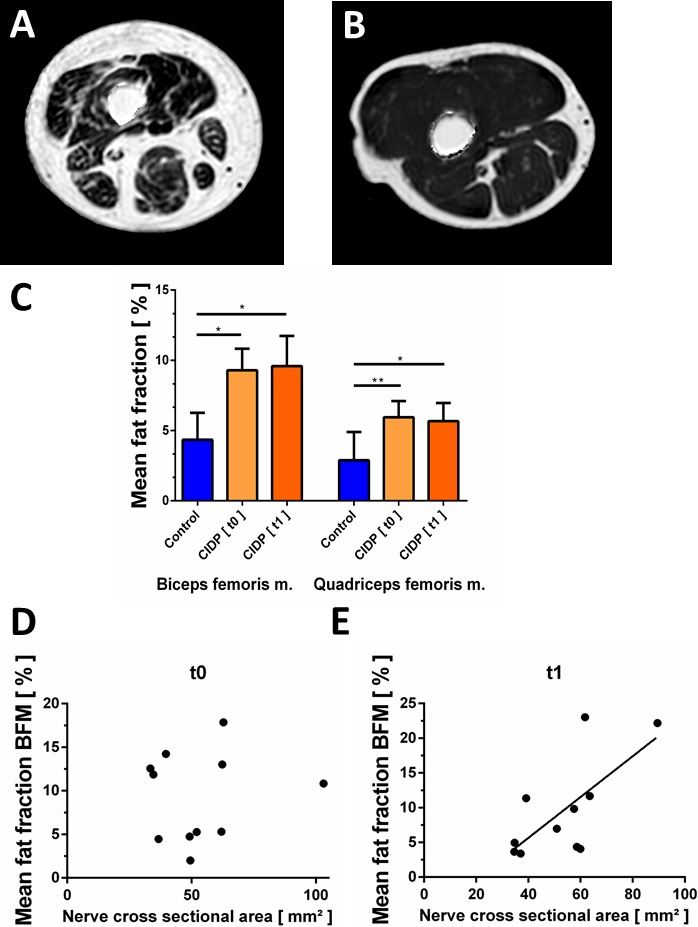
Fat quantification of thigh muscles by multiecho Dixon sequence. (A and B) Multiecho Dixon quantitative proton‐density fat fraction map of the right thigh of a patient with CIDP (A) and a healthy control (B). Subtotal intramuscular ROIs were drawn on these maps to quantify the fat fraction. Visually inspected, the higher intramuscular signal reflects the increased fat fraction going along with neurogenic muscle atrophy. Note that artifacts surrounding the thigh have been removed by software postprocessing. (C) Average intramuscular fat fractions in the biceps femoris and quadriceps muscles. Fat fractions were higher in the quadriceps and biceps femoris muscles in patients with CIDP at baseline (t0) and 6 months later (t1), compared to healthy controls. (D, E) Correlations between sciatic nerve cross‐sectional area and biceps femoris fat fraction. Correlations were statistically significant at 6 months (t1, E) but not at baseline (t0, D).
Sciatic nerve cross‐sectional area was positively correlated with biceps femoris fat fraction in patients with CIDP after 6 months (r = 0.684, P = 0.0203, Fig. 3D and E). No significant correlations were observed between FA values of the sciatic nerve and clinical or electroneurographic measurements. Muscle fat fraction was not significantly correlated with clinical measures of muscle weakness (data not shown). Five of eleven patients showed neurogenic EMG changes in the biceps femoris and vastus lateralis muscles.
Discussion
We here present a novel multiparametric MRI imaging paradigm that allows simultaneous quantification of sciatic nerve morphology and intramuscular fat fraction of mid‐thigh muscles. We found significantly enlarged sciatic nerves with lower FA values in patients with CIDP compared to controls. Likewise, the thigh muscles of patients with CIDP showed a significantly elevated intramuscular fat fraction, compared to controls. Over a follow‐up period of 6 months, these parameters remained unchanged, indicating persistent pathology and also high reproducibility in this clinically stable cohort.
We adopted our previously developed MRI–DTI acquisition protocol23 to a novel hard‐ and software setting to assess the integrity of sciatic nerve fibers longitudinally in a cohort of patients with CIDP. Our finding that patients with CIDP have enlarged sciatic nerve cross‐sections complements the results from a previous study that reported increased nerve cross‐sectional areas in patients with CIDP.40 In contrast to the study of Sinclair and colleagues, who used T2 short inversion time inversion recovery (STIR) sequences on a 1.5T scanner, we measured the nerve diameter on T2 Dixon TSE images of a 3T scanner. Furthermore, we systematically assessed the right leg, whereas Sinclair and colleagues examined the more severely affected lower limb in patients with CIDP. These methodological differences may, at least in part, contribute to the lower absolute values of cross‐sectional areas in our cohort (53.2 mm2 vs. 67.6 mm2).
Our finding of lower FA values in the sciatic nerve of patients with CIDP is in line with a more recent cross‐sectional study in 14 patients with CIDP that reported lower sciatic nerve FA values,41 although the absolute FA values for healthy controls (mean 0.48) and patients with CIDP (mean 0.42) in that study were higher compared to ours. These differences can be explained by different acquisition parameters and analysis procedures such as generation of the FA maps and definition of the ROI. In addition, small but significant inter‐MRI‐vendor variability of FA measurements has been reported for median nerve DTI with lower FA values for the same 3.0 Tesla MRI scanner as used in our study.42 This emphasizes the importance of generating normal values for quantitative DTI measures and warrants caution regarding their interpretation when different acquisition soft‐ and hardware are used.
Previous studies have consistently demonstrated that DTI derived FA in rodent22, 43, 44 and human peripheral nerves is a valid measure for axonal injury.17, 21, 23
We thus conclude that the lower FA values observed in our study indicate proximal nerve injury in our cohort of patients with CIDP, and thereby clearly distinguish them from healthy subjects. Our study confirms the results of previous electrophysiological studies in CIDP that suggested damage to proximal nerve segments in affected and asymptomatic limbs.11, 45, 46 Our finding that FA values of sciatic nerves remained constant over the follow‐up period of 6 months reflects the clinical course, as our patients were on immunomodulatory treatment, which prevented successfully any clinical progression over this period of time.
Furthermore, we report for the first time the utility of PDFF mapping to quantify alteration of muscle structure in CIDP. Muscle PDFF values have been shown to relate to muscle strength in healthy subjects47 and to clinical parameters in patients with knee osteoarthritis48 and rotator cuff pathologies.35 Muscle PDFF mapping has recently been introduced as a noninvasive biomarker for disease progression in muscle dystrophies and myopathies.24, 25, 26, 27 One recent study also explored the utility of PDFF to assess neurogenic muscle atrophy in patients with Charcot‐Marie‐Tooth Type 1 and found significantly higher fat fractions in calf but not thigh muscles.49 To remain within the boundaries of a feasible scanning time for patients (i.e., 20 min), our study focused on thigh muscles adjacent to and partially innervated by the sciatic nerve. The increase in the PDFF of thigh muscles in patients with CIDP likely reflects changes based on the asymmetrical nonlength‐dependent distribution of neuropathy typically seen in CIDP, in contrast to CMT1a. The positive correlation between the pathological sciatic nerve cross‐sectional area and the biceps femoris PDFF strongly suggests a neurogenic origin. The most parsimonious explanation for the observation that not all patients had clearly pathological EMG changes in this muscle is that deeper parts of the examined muscles are not accessible to standard needle EMG.
In conclusion, we here present a novel multiparametric MRI protocol that allows noninvasive quantification of proximal nerve injury and muscle changes in a chronic neuropathic condition. In CIDP, these MRI measures demonstrate axonal injury in sciatic nerve fibers as well as increased fat accumulation in proximal thigh muscles.
Our data suggest that MR imaging of lower proximal limbs including nerve DTI and muscle fat Dixon imaging could be a useful tool for quantifying the subclinical burden of axonal degeneration and neurogenic muscle changes in patients with CIDP. However further studies with patients with CIDP that are more severely affected in terms of proximal weakness are warranted to determine the utility of these MR‐based measures to serve as biomarkers in therapeutic trials.
Authors’ Contributions
Thorsten Lichtenstein: Acquisition and analysis of data, study concept. Alina Sprenger: Acquisition and analysis of data, study concept. Karin Slebocki: Analysis of data. Kilian Weiss: Study design and concept, drafting the manuscript for content. Barbara Cervantes: Study design and concept, drafting the manuscript for content. Dimitrios Karampinos: Study design and concept, drafting the manuscript for content. David Maintz: Study concept, drafting the manuscript for content. Gereon R. Fink: Study concept, drafting the manuscript for content. Tobias D. Henning: Study design and concept, drafting the manuscript for content. Helmar C. Lehmann: Study design and concept, drafting the manuscript for content.
Conflict of Interest
HCL has received personal compensation for advisory activities and lectures from CSL Behring and Grifols. KW is an employee of Philips Healthcare Germany since 10/2014. He reports personal fees from Philips Healthcare Germany, during the conduct of the study and personal fees from Philips Healthcare Germany outside the submitted work.
Acknowledgment
We thank our patients for participating in the study and Bettina Baessler, Institute of Diagnostic and Interventional Radiology, for statistical analysis of inter‐rater agreement. The technical assistance of Claudia Müller is greatly appreciated.
Funding Statement
This work was funded by Federal Ministry of Education and Research Germany grant ; GEROK program of the Medical Faculty of the University of Cologne grant .
References
- 1. Nobile‐Orazio E. Chronic inflammatory demyelinating polyradiculoneuropathy and variants: where we are and where we should go. J Peripher Nerv Syst 2014;19:2–13. [DOI] [PubMed] [Google Scholar]
- 2. Dimachkie MM, Barohn RJ. Chronic inflammatory demyelinating polyneuropathy. Curr Treat Options Neurol 2013;15:350–366. [DOI] [PMC free article] [PubMed] [Google Scholar]
- 3. Vedeler CA, Farbu E, Mellgren SI. Chronic inflammatory demyelinating polyneuropathy (CIDP). Acta Neurol Scand Suppl 2013;196:48–51. [DOI] [PubMed] [Google Scholar]
- 4. Querol L, Nogales‐Gadea G, Rojas‐Garcia R, et al. Antibodies to contactin‐1 in chronic inflammatory demyelinating polyneuropathy. Ann Neurol 2013;73:370–380. [DOI] [PubMed] [Google Scholar]
- 5. Breiner A, Brannagan TH 3rd. Comparison of sensitivity and specificity among 15 criteria for chronic inflammatory demyelinating polyneuropathy. Muscle Nerve 2014;50:40–46. [DOI] [PubMed] [Google Scholar]
- 6. Tanaka K, Mori N, Yokota Y, Suenaga T. MRI of the cervical nerve roots in the diagnosis of chronic inflammatory demyelinating polyradiculoneuropathy: a single‐institution, retrospective case‐control study. BMJ Open 2013;3:e003443. [DOI] [PMC free article] [PubMed] [Google Scholar]
- 7. Dalakas MC. Medscape. Advances in the diagnosis, pathogenesis and treatment of CIDP. Nat Rev Neurol 2011;7:507–517. [DOI] [PubMed] [Google Scholar]
- 8. Mygland A, Monstad P. Chronic acquired demyelinating symmetric polyneuropathy classified by pattern of weakness. Arch Neurol 2003;60:260–264. [DOI] [PubMed] [Google Scholar]
- 9. Kuwabara S, Ogawara K, Misawa S, et al. Distribution patterns of demyelination correlate with clinical profiles in chronic inflammatory demyelinating polyneuropathy. J Neurol Neurosurg Psychiatry 2002;72:37–42. [DOI] [PMC free article] [PubMed] [Google Scholar]
- 10. Saperstein DS, Katz JS, Amato AA, Barohn RJ. Clinical spectrum of chronic acquired demyelinating polyneuropathies. Muscle Nerve 2001;24:311–324. [DOI] [PubMed] [Google Scholar]
- 11. Kiers L, Clouston P, Zuniga G, Cros D. Quantitative studies of F responses in Guillain‐Barre syndrome and chronic inflammatory demyelinating polyneuropathy. Electroencephalogr Clin Neurophysiol 1994;93:255–264. [DOI] [PubMed] [Google Scholar]
- 12. Iijima M, Yamamoto M, Hirayama M, et al. Clinical and electrophysiologic correlates of IVIg responsiveness in CIDP. Neurology 2005;64:1471–1475. [DOI] [PubMed] [Google Scholar]
- 13. Chhabra A, Madhuranthakam AJ, Andreisek G. Magnetic resonance neurography: current perspectives and literature review. Eur Radiol 2017:1–10. [DOI] [PubMed] [Google Scholar]
- 14. Freund W, Brinkmann A, Wagner F, et al. MR neurography with multiplanar reconstruction of 3D MRI datasets: an anatomical study and clinical applications. Neuroradiology 2007;49:335–341. [DOI] [PubMed] [Google Scholar]
- 15. Bendszus M, Stoll G. Technology insight: visualizing peripheral nerve injury using MRI. Nat Clin Pract Neurol 2005;1:45–53. [DOI] [PubMed] [Google Scholar]
- 16. Kwee RM, Chhabra A, Wang KC, et al. Accuracy of MRI in diagnosing peripheral nerve disease: a systematic review of the literature. AJR Am J Roentgenol 2014;203:1303–1309. [DOI] [PubMed] [Google Scholar]
- 17. Sheikh KA. Non‐invasive imaging of nerve regeneration. Exp Neurol 2010;223:72–76. [DOI] [PMC free article] [PubMed] [Google Scholar]
- 18. Filler AG, Maravilla KR, Tsuruda JS. MR neurography and muscle MR imaging for image diagnosis of disorders affecting the peripheral nerves and musculature. Neurol Clin 2004;22:643–682, vi‐vii. [DOI] [PubMed] [Google Scholar]
- 19. Ahlawat S, Chhabra A, Blakely J. Magnetic resonance neurography of peripheral nerve tumors and tumorlike conditions. Neuroimaging Clin N Am 2014;24:171–192. [DOI] [PubMed] [Google Scholar]
- 20. Zhou Y, Narayana PA, Kumaravel M, et al. High resolution diffusion tensor imaging of human nerves in forearm. J Magn Reson Imaging 2013;39:1374–1383. [DOI] [PMC free article] [PubMed] [Google Scholar]
- 21. Kakuda T, Fukuda H, Tanitame K, et al. Diffusion tensor imaging of peripheral nerve in patients with chronic inflammatory demyelinating polyradiculoneuropathy: a feasibility study. Neuroradiology 2011;53:955–960. [DOI] [PubMed] [Google Scholar]
- 22. Lehmann HC, Zhang J, Mori S, Sheikh KA. Diffusion tensor imaging to assess axonal regeneration in peripheral nerves. Exp Neurol 2010;223:238–244. [DOI] [PMC free article] [PubMed] [Google Scholar]
- 23. Mathys C, Aissa J, Zu Hörste GM, et al. Peripheral neuropathy: assessment of proximal nerve integrity by diffusion tensor imaging. Muscle Nerve 2013;48:889–896. [DOI] [PubMed] [Google Scholar]
- 24. Carlier PG, Marty B, Scheidegger O, et al. Skeletal muscle quantitative nuclear magnetic resonance imaging and spectroscopy as an outcome measure for clinical trials. J Neuromuscul Dis 2016;3:1–28. [DOI] [PMC free article] [PubMed] [Google Scholar]
- 25. Fischer D, Hafner P, Rubino D, et al. The 6‐minute walk test, motor function measure and quantitative thigh muscle MRI in Becker muscular dystrophy: a cross‐sectional study. Neuromuscul Disord 2016;26:414–422. [DOI] [PubMed] [Google Scholar]
- 26. Mankodi A, Bishop CA, Auh S, et al. Quantifying disease activity in fatty‐infiltrated skeletal muscle by IDEAL‐CPMG in Duchenne muscular dystrophy. Neuromuscul Disord 2016;26:650–658. [DOI] [PMC free article] [PubMed] [Google Scholar]
- 27. Morrow JM, Sinclair CD, Fischmann A, et al. Reproducibility, and age, body‐weight and gender dependency of candidate skeletal muscle MRI outcome measures in healthy volunteers. Eur Radiol 2014;24:1610–1620. [DOI] [PMC free article] [PubMed] [Google Scholar]
- 28. Van den Bergh PY, Hadden RD, Bouche P, et al. European Federation of Neurological Societies/Peripheral Nerve Society guideline on management of chronic inflammatory demyelinating polyradiculoneuropathy: report of a joint task force of the European Federation of Neurological Societies and the Peripheral Nerve Society ‐ first revision. Eur J Neurol 2010;17:356–363. [DOI] [PubMed] [Google Scholar]
- 29. Hughes R, Bensa S, Willison H, et al. Randomized controlled trial of intravenous immunoglobulin versus oral prednisolone in chronic inflammatory demyelinating polyradiculoneuropathy. Ann Neurol 2001;50:195–201. [DOI] [PubMed] [Google Scholar]
- 30. Kimura J. Electrodiagnosis in diseases of nerve and muscle: principles and practice, 2nd ed Philadelphia: F.A. Davis, 1989. [Google Scholar]
- 31. Kollmer J, Bendszus M, Pham M. MR Neurography: diagnostic Imaging in the PNS. Clin Neuroradiol 2015;25(Suppl 2):283–289. [DOI] [PubMed] [Google Scholar]
- 32. Kasper JM, Wadhwa V, Scott KM, et al. SHINKEI–a novel 3D isotropic MR neurography technique: technical advantages over 3DIRTSE‐based imaging. Eur Radiol 2015;25:1672–1677. [DOI] [PubMed] [Google Scholar]
- 33. Cervantes B, Bauer JS, Zibold F, et al. Imaging of the lumbar plexus: optimized refocusing flip angle train design for 3D TSE. J Magn Reson Imaging 2016;43:789–799. [DOI] [PubMed] [Google Scholar]
- 34. Yu H, Shimakawa A, McKenzie CA, et al. Multiecho water‐fat separation and simultaneous R2* estimation with multifrequency fat spectrum modeling. Magn Reson Med 2008;60:1122–1134. [DOI] [PMC free article] [PubMed] [Google Scholar]
- 35. Nardo L, Karampinos DC, Lansdown DA, et al. Quantitative assessment of fat infiltration in the rotator cuff muscles using water‐fat MRI. J Magn Reson Imaging 2014;39:1178–1185. [DOI] [PMC free article] [PubMed] [Google Scholar]
- 36. Team RDC . R: A Language and Environment for Statistical Computing. Vienna, Austria: the R Foundation for Statistical Computing. ISBN: 3‐900051‐07‐0. ed 2011.
- 37. Gamer M, Lemon J, Fellows I, Singh P. irr: Various Coefficients of Interrater Reliability and Agreement. R package version 0.84. 2012.
- 38. Schulz A. epade: Easy Plots. R package version 0.3.8. https://CRAN.R-project.org/package=epade. 2013.
- 39. Grothues F, Smith GC, Moon JC, et al. Comparison of interstudy reproducibility of cardiovascular magnetic resonance with two‐dimensional echocardiography in normal subjects and in patients with heart failure or left ventricular hypertrophy. Am J Cardiol 2002;90:29–34. [DOI] [PubMed] [Google Scholar]
- 40. Sinclair CD, Miranda MA, Cowley P, et al. MRI shows increased sciatic nerve cross sectional area in inherited and inflammatory neuropathies. J Neurol Neurosurg Psychiatry 2011;82:1283–1286. [DOI] [PubMed] [Google Scholar]
- 41. Markvardsen LH, Vaeggemose M, Ringgaard S, Andersen H. Diffusion tensor imaging can be used to detect lesions in peripheral nerves in patients with chronic inflammatory demyelinating polyneuropathy treated with subcutaneous immunoglobulin. Neuroradiology 2016;58:745–752. [DOI] [PubMed] [Google Scholar]
- 42. Guggenberger R, Nanz D, Bussmann L, et al. Diffusion tensor imaging of the median nerve at 3.0 T using different MR scanners: agreement of FA and ADC measurements. Eur J Radiol 2013;82:e590–e596. [DOI] [PubMed] [Google Scholar]
- 43. Takagi T, Nakamura M, Yamada M, et al. Visualization of peripheral nerve degeneration and regeneration: monitoring with diffusion tensor tractography. NeuroImage 2009;44:884–892. [DOI] [PubMed] [Google Scholar]
- 44. Morisaki S, Kawai Y, Umeda M, et al. In vivo assessment of peripheral nerve regeneration by diffusion tensor imaging. J Magn Reson Imaging 2011;33:535–542. [DOI] [PubMed] [Google Scholar]
- 45. Hitomi T, Kaji R, Murase N, et al. Dynamic change of proximal conduction in demyelinating neuropathies: a cervical magnetic stimulation combined with maximum voluntary contraction. Clin Neurophysiol 2007;118:741–750. [DOI] [PubMed] [Google Scholar]
- 46. Rajabally YA, Jacob S. Proximal nerve conduction studies in chronic inflammatory demyelinating polyneuropathy. Clin Neurophysiol 2006;117:2079–2084. [DOI] [PubMed] [Google Scholar]
- 47. Baum T, Inhuber S, Dieckmeyer M, et al. Association of quadriceps muscle fat with isometric strength measurements in healthy males using chemical shift encoding‐based water‐fat magnetic resonance imaging. J Comput Assist Tomogr 2016;40:447–451. [DOI] [PMC free article] [PubMed] [Google Scholar]
- 48. Kumar D, Karampinos DC, MacLeod TD, et al. Quadriceps intramuscular fat fraction rather than muscle size is associated with knee osteoarthritis. Osteoarthritis Cartilage 2014;22:226–234. [DOI] [PMC free article] [PubMed] [Google Scholar]
- 49. Morrow JM, Sinclair CD, Fischmann A, et al. MRI biomarker assessment of neuromuscular disease progression: a prospective observational cohort study. Lancet Neurol 2016;15:65–77. [DOI] [PMC free article] [PubMed] [Google Scholar]