

Abstract
Objective
To investigate whether the strength of the association between magnetic resonance imaging (MRI) metrics and cognitive outcomes differs between various multiple sclerosis subpopulations.
Methods
A total of 1052 patients were included in this large cross‐sectional study. Brain MRI (T1 and T2 lesion volume and brain parenchymal fraction) and neuropsychological assessment (Brief International Cognitive Assessment for Multiple Sclerosis and Paced Auditory Serial Addition Test) were performed.
Results
Weak correlations between cognitive domains and MRI measures were observed in younger patients (age≤30 years; absolute Spearman's rho = 0.05–0.21), with short disease duration (<2 years; rho = 0.01–0.21), low Expanded Disability Status Scale [EDSS] (≤1.5; rho = 0.08–0.18), low T2 lesion volume (lowest quartile; <0.59 mL; rho = 0.01–0.20), and high brain parenchymal fraction (highest quartile; >86.66; rho = 0.01–0.16). Stronger correlations between cognitive domains and MRI measures were observed in older patients (age>50 years; rho = 0.24–0.50), with longer disease duration (>15 years; rho = 0.26–0.53), higher EDSS (≥5.0; rho = 0.23–0.39), greater T2 lesion volume (highest quartile; >5.33 mL; rho = 0.16–0.32), and lower brain parenchymal fraction (lowest quartile; <83.71; rho = 0.13–0.46). The majority of these observed results were confirmed by significant interactions (P ≤ 0.01) using continuous variables.
Interpretation
The association between structural brain damage and functional cognitive impairment is substantially weaker in multiple sclerosis patients with a low disease burden. Therefore, disease stage should be taken into consideration when interpreting associations between structural and cognitive measures in clinical trials, research studies, and clinical practice.
Introduction
The clinical presentation of multiple sclerosis (MS) includes a wide range of physical, as well as cognitive, signs, and symptoms.1, 2, 3, 4 In particular, cognitive impairment has recently been increasingly recognized as an important determinant of employment status and associated societal costs,5, 6 negatively impacting social functioning, coping, quality of life, and treatment adherence among patients with MS.7
In this context, associations between brain imaging measures and cognitive functioning have been observed in patients with MS.1, 3 Particularly, T1 lesion volume (T1‐LV) and T2 lesion volume (T2‐LV),8, 9 damage of normal‐appearing white matter,10, 11 occurrence of cortical lesions,12, 13 and gray matter,14, 15 or thalamic atrophy11, 16 have been suggested as important brain imaging correlates of cognitive impairment.
Even though most previous studies have shown a relationship between lesion burden or brain atrophy on MRI and cognitive impairment, there are still a number of studies that did not report such associations.2, 17, 18, 19, 20, 21, 22, 23, 24, 25, 26 In addition, the magnitude of reported associations varies wildly between studies.1, 3, 27 By further examining these inconsistencies, the interpretation of associations between structural and cognitive metrics can possibly be improved by identifying contextual determinants of the strength of these associations.
Most previous studies investigating MRI correlates of cognitive impairment included small samples or heterogeneous MS populations. This study was conducted using a large and clinically well‐described observational cohort of patients with predominantly relapsing–remitting MS, mostly on disease‐modifying treatments. We hypothesized that the strength of the association between brain MRI and cognitive measures in MS varies as a function of disease stage, cumulative disease burden, and patient characteristics.
Materials and Methods
Study population
The Grant Quantitative study was a 3‐year prospective observational study investigating a comprehensive battery of clinical and paraclinical measures set up to evaluate MS progression in routine clinical practice. Inclusion criteria were as follows: clinically isolated syndrome or clinically definite MS confirmed by MRI and cerebrospinal fluid examination, Czech fluent speaker, and age ≥18. Exclusion criteria were as follows: signs and symptoms suggestive of a disease other than MS or a serious psychiatric disorder. Enrollment started in June 2012. For the present analysis, the database was locked in October 2015. The study protocol was approved by the Medical Ethics Committee of the General University Hospital in Prague and First Faculty of Medicine, Charles University in Prague, Czech Republic. All patients provided their written informed consent.
MR image acquisition and analysis
This study used MRI scans performed within 3 months before or after neuropsychological assessment. All MRI scans were performed on the same scanner (1.5‐Tesla Gyroscan; Philips Medical Systems, Best, the Netherlands) in the Department of Radiodiagnostics at General University Hospital in Prague using the same protocol. The standardized protocol consisted of two sequences: fluid‐attenuated inversion recovery (FLAIR) and T1‐weighted three‐dimensional turbo field echo (T1‐WI/3D/TFE). Contiguous slices covering the whole brain were acquired with the following parameters: FLAIR sequence (time to echo = 140 msec, time to repetition 11,000 msec, inversion time 2600 msec, matrix size 256 × 181, flip angle 90°, slice thickness/gap=1.5/0 mm, field of view=256 mm), and T1‐WI/3D/TFE (time to echo/time to repetition: 5/25 msec, flip angle =30°, matrix size 256 × 256, slice thickness/gap=1.0/0 mm, field of view = 256 mm).
Volumetric image analysis was performed in the Department of Radiodiagnostics, General University Hospital, in Prague using ScanView. ScanView is a semi‐automated software tool for measurement of T1‐LV and T2‐LV, BPF (brain parenchymal fraction) whole brain, and corpus callosum volumes via segmentation‐based techniques. A detailed description of the ScanView was published previously.28
T2‐LV was measured from the FLAIR sequence. WB volume was measured from the T1‐WI/TFE 3D sequence. Intracranial volume was calculated as the sum of the total brain parenchymal volume and the total intraventricular and subarachnoidal cerebrospinal fluid volume. Normalized compartment volume was calculated as follows: (BPF) = whole‐brain parenchymal volume/intracranial volume.4, 28, 29
Neuropsychological assessment
All participants were tested using the Czech‐validated version of the Brief International Cognitive Assessment for Multiple Sclerosis (BICAMS).30, 31 Cognitive processing speed was assessed with the Symbol Digit Modalities Test (SDMT) where stimuli were presented visually and only the oral response form was recorded. Memory was tested with the Brief Visuospatial Memory Test Revised (BVMTR) in the visual modality, and the California Verbal Learning Test Second Edition (CVLT2) in the auditory sphere. For both Brief Visuospatial Memory Test Revised and California Verbal Learning Test Second Edition, only the initial learning trials of each test were administered. All but of 12 patients were also tested with the three‐second interval Paced Auditory Serial Addition Test (PASAT), thus providing a second test of cognitive processing speed, although in auditory modality.
Impairment for a single test was defined at the level of 1.5 standard deviation (i.e., z‐score <1.5 compared with a healthy population), using the regression‐based norms of 134 healthy controls adjusted for age, sex, and education. Raw scores of the cognitive tests were used in the statistical models and presented results. Patients were evaluated as cognitively impaired when scoring outside the normal range in one or more of the BICAMS tests.30, 31
For the assessment of depressive symptoms, the Beck Depression Inventory‐II (BDI‐II) was used.
Statistical analysis
All analyses were performed using SPSS 22 (IBM, Armonk, NY) and Statistica 12 (Statsoft, Tulsa, OK). Normality of distribution was assessed using the Kolmogorov–Smirnov method and visual inspection of histograms. In parametric analyses, non‐normally distributed variables were transformed (T1‐LV and T2‐LV using Cox–Box transformation, and BDI‐II using logarithmic transformation and PASAT using logit transformation).
Associations between the cognitive (SDMT, BVMTR, CVLT2, PASAT) and MRI (T1‐LV, T2‐LV, and BPF) measures in MS subgroups were evaluated using nonparametric Spearman's correlation coefficients (rho) to eliminate effects of non‐normal distribution and potential presence of outliers.
The primary analysis consisted of interaction models of selected continuous variables (age, disease duration, Expanded Disability Status Scale [EDSS], T2‐LV, and BPF) and MRI measures, in association with cognitive performance. These analyses were conducted to evaluate the relationship between disease or patient characteristics and the strength of the associations between brain MRI, with cognitive measures. In the next step, multivariable models with interaction terms were adjusted for the potential confounders such as sex, age, education, depression, and treatment status. Table S1 provides detailed description of the adjusted multivariable models with the interaction term.
Multivariable linear regression analyses were used to test the relationships between cognitive and MRI measures adjusted for sex, age or disease duration, education, depression, and treatment status. Only treatment status was set as a categorical variable with the following three categories: injectable disease‐modifying treatments (glatiramer acetate, interferons β, intravenous immunoglobulin), dimethyl fumarate and teriflunomide, second‐line disease‐modifying treatments (alemtuzumab, fingolimod, natalizumab, mitoxantrone, rituximab), and no disease‐modifying treatment. Because of multicolinearity between the age and disease duration, multivariable models were adjusted only for age.
Importantly, MS patient subgroups were stratified according to their age, disease duration, EDSS, T2‐LV, or BPF (presented in Figures 1 and 2). This was established arbitrarily and used mainly for graphical purposes to show differences in strength of correlations among different MS subgroups.
Figure 1.

The strength of associations between brain MRI (brain parenchymal fraction, T1 and T2 lesion volume) and cognitive measures (Symbol Digit Modalities Test, three‐second interval Paced Auditory Serial Addition Test, Brief Visuospatial Memory Test Revised, California Verbal Learning Test Second Edition) in multiple sclerosis subpopulations. Subgroups of patients stratified by (A) age, (B) disease duration, (C) Expanded Disability Status Scale, (D) T2 lesion volume, or (E) brain parenchymal fraction were used for graphical purposes (the primary analysis of interaction models was performed using continuous variables).
Figure 2.
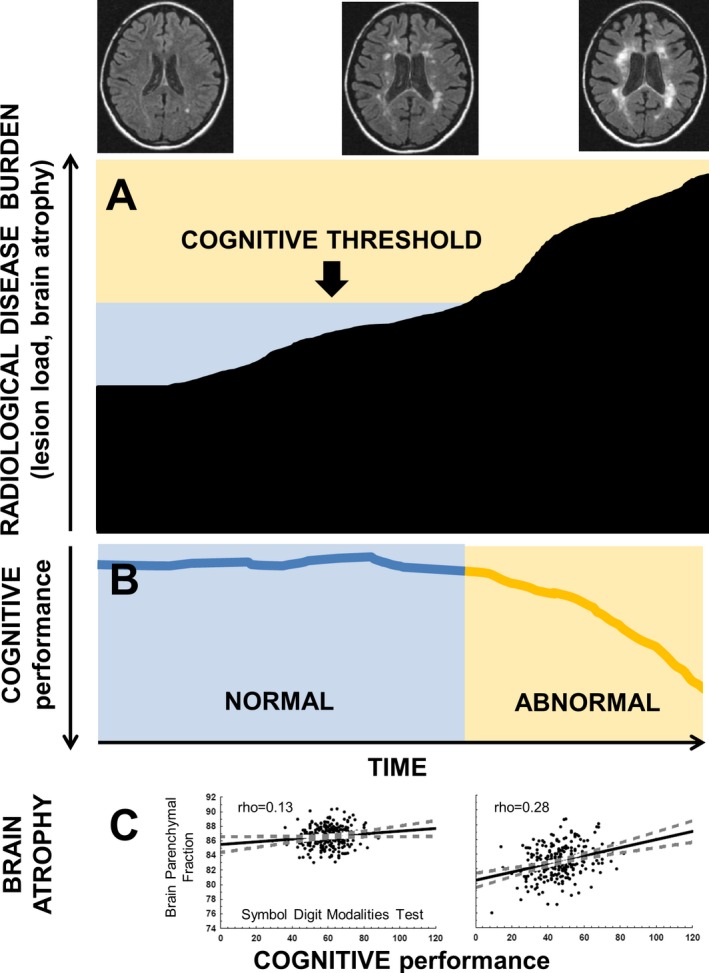
(A‐B) The threshold concept of brain pathology for the manifestation of a cognitive decline in multiple sclerosis patients. (C) The strength of associations between brain parenchymal fraction and Symbol Digit Modalities Test scores in patients within the lowest and the highest quartile of T2 lesion volume.
To control false discovery rate, Benjamini–Hochberg procedure with P < 0.01 was applied.
Results
Demographic, clinical, and MRI characteristics
Of the 1253 patients enrolled in the study, 1052 had all cognitive and MRI data available and were included in the analysis. Of these, 867 (82%) patients were treated with disease‐modifying treatment. Median EDSS was 2.0, and average disease duration was 10.0 years. Cognitive impairment (abnormal outcome of BICAMS battery) was present in 282 (27%) of patients. Abnormal outcome of BICAMS battery was driven mostly by abnormal SDMT, which was present in 229 (81%) of patients with cognitive impairment. Table 1 describes details of demographic, clinical, neuropsychological, and MRI characteristics of the patient cohort.
Table 1.
Baseline demographic, clinical, neuropsychological, and MRI characteristics of the sample
| Sample characteristics | N = 1052 |
|---|---|
| Demographic | |
| Number of females | 734 (70%) |
| Age in years | 38.1 ± 8.8; 37.5 |
| Education | 14.7 ± 3.0; 14.0 |
| Unemployed | 233 (22%) |
| Employed or students | 819 (78%) |
| Disease duration at baseline (years) | 10.0 ± 7.3; 8.1 |
| Clinical | |
| Expanded Disability Status Scalea | 2.5 ± 1.3; 2.0; (0‐6.5) |
| No disease‐modifying treatment | 185 (17%) |
| First‐line disease‐modifying treatmentb | 670 (64%) |
| Second‐line disease‐modifying treatmentc | 197 (19%) |
| Cognitive | |
| Symbol Digit Modalities Testd | 55.3 ± 11.6; 56.0 (22%) |
| Three‐second interval Paced Auditory Serial Addition Teste | 47.8 ± 11.4; 50.0 |
| Brief Visuospatial Memory Test revisitedd | 27.6 ± 6.4; 29.0 (10%) |
| California Verbal Learning Test Second Editiond | 59.2 ± 11.7; 61.0 (5%) |
| Abnormal Brief International Cognitive Assessment for Multiple Sclerosis (BICAMS)f | 282 (27%) |
| Beck Depression Inventory‐IIg | 7.4 ± 7.2; 5.0 (183; 17%) |
| MRI | |
| Brain parenchymal fraction (%) | 85.1 ± 2.2; 85.4 |
| T1 lesion volume (ml) | 1.6 ± 2.0; 0.8 |
| T2 lesion volume (ml) | 4.8 ± 8.1; 1.7 |
Unless otherwise indicated, all data are reported as mean ± standard deviation, median.
Data in parentheses are ranges.
Injectable disease‐modifying treatment (glatiramer acetate, interferons, intravenous immunoglobulins), dimethyl fumarate, teriflunomide.
Second‐line disease‐modifying treatment: alemtuzumab, fingolimod, natalizumab, mitoxantrone, rituximab.
Data in parentheses are percentages of patients with abnormal test outcome.
12 subjects have no Three‐second interval Paced Auditory Serial Addition Test.
Abnormal Brief International Cognitive Assessment for Multiple Sclerosis was defined as scoring outside the normal range in ≥1 Brief International Cognitive Assessment for Multiple Sclerosis subtests.
Data in parentheses are number and percentage of patients with Beck Depression Inventory‐II score >14.
Correlation between cognitive and MRI measures
All associations between the cognitive domains and all MRI measures reached statistical significance (absolute Spearman's rho≥±0.24; P < 0.001). The strongest correlations between cognitive and MRI measures were identified among SDMT and T1‐LV, T2‐LV, and BPF (rho≥0.39; standardized beta ≥±0.36; P < 0.001) (Table 2). In addition, we found some sex differences in correlations between cognitive and MRI measures (Table S2). Sample size needed to observe significant (P < 0.05) Spearman's correlations between cognitive (SDMT) and brain MRI measures in different MS subgroups is shown in Table 3.
Table 2.
Correlations among the cognitive, demographic, clinical, and MRI measures
| Age | Education | Disease duration | Expanded Disability Status Scale | Beck Depression Inventory‐II | Symbol Digit Modalities Test | Three‐second interval Paced Auditory Serial Addition Test | Brief Visuospatial Memory Test Revised | California Verbal Learning Test Second Edition | T1 lesion volume | T2 lesion volume | |
|---|---|---|---|---|---|---|---|---|---|---|---|
| Education | −0.12 | – | – | – | – | – | – | – | – | – | – |
| Disease duration | 0.42 | NS | – | – | – | – | – | – | – | – | – |
| Expanded Disability Status Scale | 0.38 | −0.16 | 0.41 | – | – | – | – | – | – | – | – |
| Beck Depression Inventory‐II | 0.19 | −0.12 | 0.15 | 0.39 | – | – | – | – | – | – | – |
| Symbol Digit Modalities Test | −0.29 | 0.24 | −0.26 | −0.44 | −0.23 | – | – | – | – | – | – |
| Three‐second interval Paced Auditory Serial Addition Test | −0.19 | 0.23 | −0.19 | −0.33 | −0.20 | 0.52 | – | – | – | – | – |
| Brief Visuospatial Memory Test Revised | −0.24 | 0.26 | −0.16 | −0.28 | −0.11 | 0.54 | 0.38 | – | – | – | – |
| California Verbal Learning Test Second Edition | −0.24 | 0.29 | −0.15 | −0.26 | −0.11 | 0.42 | 0.35 | 0.47 | – | – | – |
| T1 lesion volume | 0.33 | NS | 0.42 | 0.42 | 0.12 | −0.39 | −0.22 | −0.28 | −0.28 | – | – |
| T2 lesion volume | 0.27 | NS | 0.45 | 0.43 | 0.13 | −0.41 | −0.24 | −0.31 | −0.29 | 0.86 | – |
| Brain parenchymal fraction | −0.40 | NS | −0.43 | −0.41 | −0.13 | 0.39 | 0.29 | 0.28 | 0.23 | −0.55 | −0.61 |
NS, not significant correlation (P > 0.01 after Benjamini–Hochberg correction procedure).
rho, Spearman's correlation coefficients are reported.
The values in bold are ǀrhoǀ≥0.40.
Table 3.
Sample size needed to observe significant (P < 0.05) correlations between cognitive (Symbol Digit Modalities Test) and brain MRI measures in different patient subgroups
| MRI measures | Disease duration (years) | ||||
|---|---|---|---|---|---|
| <2 | 2–5 | 5–10 | 10–15 | >15 | |
| Brain parenchymal fraction | 88 | 47 | 36 | 44 | 24 |
| T2 lesion volume | 88 | 107 | 41 | 26 | 15 |
| Age (years) | |||||
| ≤30 | ≤35 | ≤40 | ≤50 | >50 | |
| Brain parenchymal fraction | 151 | 50 | 36 | 22 | 34 |
| T2 lesion volume | 88 | 39 | 34 | 19 | 29 |
| Expanded Disability Status Scale (steps) | |||||
| 0–1.5 | 2.0–2.5 | 3.0–3.5 | 4.0–4.5 | ≥5.0 | |
| Brain parenchymal fraction | 119 | 80 | 21 | 39 | 50 |
| T2 lesion volume | 119 | 107 | 18 | 28 | 26 |
| T2 lesion volume (quartiles) | |||||
| Low | Mid–low | Mid–high | High | – | |
| Brain parenchymal fraction | >200 | 107 | 97 | 50 | – |
| T2 lesion volume | >200 | >200 | >200 | 41 | – |
| Brain parenchymal fraction (quartiles) | |||||
| High | Mid–high | Mid–low | Low | – | |
| Brain parenchymal fraction | >200 | >200 | >200 | 58 | – |
| T2 lesion volume | >200 | 151 | 50 | 19 | – |
Adjusted regression analysis between cognitive and MRI measures
The associations between cognitive and MRI measures were confirmed in multivariable models adjusted for sex, age, education, depression, and treatment status (P < 0.001). All covariates, such as sex, age, education, depression, and MRI measures, were independently (all P < 0.0001) correlated with SDMT in the multivariable model. More details about the independent correlates of the other cognitive subtests, including BVMTR, CVLT2, and PASAT, are provided in Table S3.
Correlation between cognitive and MRI measures stratified by age, disease duration, disability status, lesion load, and brain atrophy subgroups
Overall, the strength of associations between the cognitive domains and MRI measures increased with greater age, disease duration, EDSS step, T2‐LV, and lower BPF.
In stratified analyses, Spearman's correlation coefficients between cognitive domains and MRI measures in patients >50 years of age were between rho = 0.24 and rho = 0.50. On the other hand, absolute rho values were considerably lower (between 0.05 and 0.21) in patients ≤30 years of age. An effect of higher age was most prominently observed between T1‐LV or T2‐LV and PASAT, where the rho difference between patients >50 years and patients ≤30 years was between 0.41 and 0.42.
Correlation coefficients between cognitive domains and MRI measures in patients with disease duration >15 years were between rho = 0.26 and rho = 0.53. In contrast, rho values were considerably lower (between 0.01 and 0.21) in patients with disease duration <2 years. An effect of longer disease duration was most prominently observed between T1‐LV and SDMT, where the rho difference between patients with disease duration >15 years and patients with disease duration <2 years was 0.42.
Correlation coefficients between the cognitive domains and MRI measures in patients with EDSS≥5.0 were between rho = 0.23 and rho = 0.39. Rho values were considerably lower (between 0.08 and 0.18) in patients with EDSS≤1.5. This progressive effect of greater EDSS was observed for all cognitive measures, where the highest rho difference between patients with EDSS≥5.0 and patients with EDSS ≤1.5 was between 0.21 and 0.23.
Correlation coefficients between cognitive domains and MRI measures in patients within the highest quartile of T2‐LV (>5.33 mL) were between rho = 0.16 and rho = 0.32. Rho values were considerably lower (between 0.01 and 0.20) in patients within the lowest quartile of T2‐LV (<0.59 mL). An effect of greater T2‐LV was most apparent for associations between T1‐LV or T2‐LV and SDMT, where the rho difference between patients with the lowest and the highest T2‐LV quartile was 0.28.
Correlation coefficients between the cognitive domains and MRI measures in patients within the lowest quartile of BPF (<83.71) were between rho = 0.13 and rho = 0.46. Absolute rho values were considerably lower (between 0.01 and 0.16) in patients in the highest quartile of BPF (>86.66). An effect of lower BPF was most apparent for associations between T1‐LV or T2‐LV and SDMT, where the rho difference between patients with the lowest and the highest BPF quartile was between 0.27 and 0.39 (Figure 1, Figure S1).
Interaction effects of age, disease duration, disability status, lesion load, and brain atrophy on the associations between cognitive and MRI measures
There were significant interactions of variables indicating disease burden (age, disease duration, and EDSS) and MRI measures, predicting cognitive impairment. However, in multivariable models adjusted for sex, age, education, depression, and treatment status, we found only a limited number of interaction effects with P < 0.01 after Benjamini–Hochberg correction. There were also significant interactions of variables indicating radiological disease burden (T2‐LV and BPF) and MRI measures, predicting cognitive impairment. Adjusted multivariable models confirmed these observations by demonstrating significant interactions (P < 0.01) between the grouping MRI variables indicating radiological disease severity (quartiles of T2‐LV and BPF) and MRI measures (T1‐LV, T2‐LV, and BPF; Figure 1, Table 4).
Table 4.
Interactions between brain MRI measures and demographic, clinical, or MRI grouping variables in relation to cognitive performance
| Interaction term | Symbol Digit Modalities Test | Three‐second interval Paced Auditory Serial Addition Testa | Brief Visuospatial Memory Test Revised | California Verbal Learning Test Second Edition | |
|---|---|---|---|---|---|
| Disease duration | Disease duration x Brain parenchymal fraction | NS | NS | NS | NS |
| Disease duration x T1 lesion volumeb | NS | NS | NS | −0.28c, e | |
| Disease duration x T2 lesion volumeb | NS | NS | −0.25c, e | −0.25c, e | |
| Age | Age x Brain parenchymal fraction | NS | NS | 4.08d | 2.90c, e |
| Age x T1 lesion volumeb | NS | −0.63c | −0.49c, e | −0.46c, e | |
| Age x T2 lesion volumeb | NS | −0.61d | −0.54d | NS | |
| Expanded Disability Status Scale (EDSS) | EDSS x Brain parenchymal fraction | NS | NS | NS | NS |
| EDSS x T1 lesion volumeb | −0.32c, e | NS | −0.30c, e | NS | |
| EDSS x T2 lesion volumeb | −0.34d | NS | −0.32c | NS | |
| T2 lesion volume | T2 lesion volume x Brain parenchymal fraction | 5.04d | 4.39d | 5.49d | 3.05c, e |
| T2 lesion volumeb x T1 lesion volumeb | −0.89d | −0.72d | −0.59d | −0.40d | |
| T2 lesion volumeb x T2 lesion volumeb | −0.80d | −0.73d | −0.60d | −0.31c, e | |
| Brain parenchymal fraction | Brain parenchymal fraction x Brain parenchymal fraction | −4.55c, e | NS | −8.39d | −4.27c, e |
| Brain parenchymal fraction x T1 lesion volumeb | 4.69d | 3.95c | 5.09d | 3.59d | |
Standardized beta values of the interaction terms from adjusted multiple regression analyses are reported.
Logistically transformed variable.
Cox–Box transformed variable.
P < 0.01.
P < 0.001.
not significant (P > 0.01) after Benjamini–Hochberg correction procedure (performed for 14 P‐values).
NS, not significant interaction (P > 0.01).
Discussion
Although most previous MS studies have observed associations between brain atrophy or MRI lesion measures and cognitive performance, the magnitude of these associations was highly variable between studies.1, 9, 27 It has been suggested that heterogeneity of the utilized imaging and cognitive metrics is primarily responsible for this variability.27 It is, however, not yet clear whether this association varies with respect to patient characteristics as well.
In this cross‐sectional study of 1052 well‐defined patients with MS, we found that the strength of associations between volumetric brain MRI and cognitive measures increases with clinically and radiologically more advanced disease. Correlations between brain MRI and cognitive metrics were relatively low in patients with a low disease burden (i.e., short disease duration or young age, low EDSS, low lesion load, and low brain atrophy). In contrast, considerably stronger correlations between brain MRI and cognitive measures were found in patients with a high disease burden (i.e., long disease duration or older age, high EDSS, high lesion load, or high brain atrophy).
The observed trends of increasing radiological burden were confirmed by interaction terms with quantitative MRI metrics (T1‐LV, T2‐LV, and BPF) versus cognitive tests. Even though patients with older age, longer disease duration, or higher EDSS also showed more pronounced correlations between MRI and cognitive metrics, the majority of interactions between age, disease duration, or EDSS and MRI measures in multivariable models predicting cognitive performance were not significant after correction for false discovery rate. We hypothesize this may be explained by the fact that associations between age or disease duration and cumulative disease burden are only indirect and that EDSS (as a measure of clinical disease burden) is less objective and a relatively inaccurate measure of disease burden,32 as compared to volumetric MRI measures.33
Taken together, the strong associations between MRI and cognitive metrics in more advanced disease imply there is a greater sensitivity of cognitive performance to structural changes in patients with already greater cumulative structural brain damage. We suggest that cognitive decline does not become clinically apparent until a certain threshold of substantial structural brain changes has been reached. The concept that a threshold for brain pathology needs to be met before cognitive decline becomes clinically apparent (Figure 2) means that irreversible axonal damage and brain tissue loss under a certain threshold may accumulate in relatively asymptomatic patients. Once the cognitive brain capacity has been surpassed and functional compensatory mechanisms fail, cognitive disability may become clinically apparent.34, 35, 36 This could explain why patients with some but minor brain atrophy or with a small lesion burden often show only limited cognitive deterioration relative to brain pathology.37 In contrast, patients with significant preexisting brain damage are relatively more sensitive to any additional structural brain damage.
It has been established that the sensitivity of cognitive and MRI measures to minor changes of cognitive performance or brain pathology is limited due to a number of factors influencing measurement accuracy. For example, actual lesion or brain volume differences between two subjects with a low radiological disease burden might be observed as comparable due to the fact that lesion or brain volume measurement can be error influenced by biological and technical biases. The same could also be a factor in cognitive measures in patients with a relative preserved cognitive performance. Here, an actual cognitive difference between two subjects might be observed as comparable due to cognitive performance measurement error or physiological fluctuations influenced by variety of factors such as motivation and other personality factors, time of day, and fatigue level. Hence, it is not particularly surprising that the accuracy of correlations between MRI and cognitive measures in patients with low radiological and cognitive disease burden may be affected substantially.
Findings from this study could help elucidate the reason for the lack of associations found in the literature between brain MRI and cognitive metrics in MS cohorts with a low disease burden. For example, in five cross‐sectional18, 23, 24, 25, 26 and two longitudinal studies,2, 38 which included between 43 and 81 patients in very early stages of MS, no significant associations between MRI lesion burden and cognitive measures were reported. Four of these studies also examined the relationships between global or regional brain atrophy and cognitive measures but found no associations.2, 24, 25, 26 Other studies did not find associations between MRI and cognitive measures presumably due to the small sample size and heterogeneity of studied cohorts.17, 19, 20, 21
This study has several limitations. Cognitive function was assessed by the BICAMS battery and PASAT. While these tests evaluate a number of cognitive domains, including rapid information processing, visuospatial learning and memory, visual scanning, verbal learning and memory, working memory, attention switching, and calculation, several domains such as higher executive functions, visual–spatial ability, or phonemic fluency were not tested.1, 31 However, the domains tested in the present study are known to be most commonly impaired in MS.1, 30 A relatively low proportion of patients had abnormal BICAMS outcome (27%). This could be a result of our sample consisting of predominantly patients with a short disease duration and low disease burden. Another limitation is that focal MRI lesions of white matter are only partially reflective of the disseminated pathology in MS.3, 10, 11 Their specific topography rather than volume may play a role in the pathogenesis of cognitive impairment. More sophisticated nonconventional MRI techniques, such as magnetization transfer ratio, diffusion tensor imaging, proton MRI spectroscopy, and functional MRI measuring various aspects of MS pathology,3 are likely to further improve our understanding of the associations between MRI and cognitive function at different stages of MS. Finally, sufficiently powered longitudinal studies are warranted to investigate the long‐term associations between MRI and cognitive changes.
In conclusion, our study suggests that greater structural brain damage corresponds to higher cognitive impairment, especially in patients with a greater preexisting cumulative disease burden, disease duration, or age. Although our results may be not surprising, they have several practical implications that have not been considered in previous research. Firstly, patients’ MRI and clinical characteristics should be taken into consideration when interpreting associations between structural and cognitive changes in clinical trials, research studies, and clinical practice.
Our results also emphasize the need for balanced recruitment of participants into clinical trials in terms of radiological disease burden. Finally, in clinical settings, the accumulation of subclinical brain damage in MS cannot be interpreted as “benign disease” since the clinical impact of quantitative brain damage may be delayed. With an increasing number of highly effective disease‐modifying treatments,39, 40 the identification of patients at highest risk of developing clinically apparent cognitive deterioration, with the aim of preserving their cognitive capacity, belongs among the top priorities of effective MS management.
Author's Contributions
T. Uher helped in study concept and design, data analysis and interpretation, and manuscript preparation. L. Sobisek contributed to data analysis. Z. Seidl and J. Krasensky helped in MRI data analysis. E. Havrdova contributed to study concept and design. M.P. Sormani helped in data interpretation. T. Kalincik contributed to data interpretation and manuscript preparation. D. Horakova helped in study concept and design, data interpretation, and manuscript preparation. M. Vaneckova contributed to MRI data analysis and data interpretation.
Conflict of Interest
T. Uher received financial support for conference travel and honoraria from Biogen Idec, Novartis, Roche, Genzyme, and Merck Serono, as well as support for research activities from Biogen Idec.
L. Sobisek received financial support from Novartis, as well as support from long‐term institutional support of research activities by Faculty of Informatics and Statistics, University of Economics, Prague.
Z. Seidl and J. Krasensky received financial support for research activities from Biogen Idec.
E. Kubala Havrdova received speaker honoraria and consultant fees from Biogen Idec, Merck Serono, Novartis, Genzyme, Teva, Actelion, and Receptos, as well as support for research activities from Biogen Idec and Merck Serono.
M.P. Sormani received consulting fees from Novartis, Biogen, Merck Serono, Teva, Genzyme, Roche, and Vertex.
T. Kalincik served on an advisory scientific board for Roche, Novartis, Merck, and Biogen, received conference travel support and/or speaker honoraria from WebMD Global, Novartis, Biogen, Sanofi, Genzyme, Teva, BioCSL, and Merck and received research support from Biogen.
D. Horakova received compensation for travel, speaker honoraria, and consultant fees from Biogen Idec, Novartis, Merck Serono, Bayer Shering, and Teva, as well as support for research activities from Biogen Idec.
M. Vaneckova received speaker honoraria and consultant fees from Biogen Idec, Novartis, Merck L. Serono, and Teva, as well as support for research activities from Biogen Idec.
Supporting information
Figure S1. (A) The strength of associations between brain T2 lesion volume (transformed with Cox–Box transformation) and Symbol Digit Modalities Test scores in four multiple sclerosis subpopulations according their Brain Parenchymal Fraction quartiles. (B) Example of the graphical presentation.
Table S1. Structure of the adjusted multivariable models with interaction term.
Table S2. Adjusted multivariable linear regression models between cognitive measures as the dependent variable and the independent demographic, clinical and MRI variables.
Table S3. Correlations between MRI and cognitive measures in females and males.
Acknowledgments
The authors thank the patients who participated in this study. The paper was also processed with contribution of long‐term institutional support of research activities by Faculty of Informatics and Statistics, University of Economics, Prague.
Funding Statement
This work was funded by Czech Ministries of Education and Health grants GA CR 16‐03322S, PRVOUK‐P26/LF1/4, and RVO‐VFN64165; Novartis grant ; University of Economics grant ; Prague ‐ Internal Grant Agency grant 44/2017.
References
- 1. Benedict RH, Zivadinov R. Risk factors for and management of cognitive dysfunction in multiple sclerosis. Nat Rev Neurol 2011;7:332–342. [DOI] [PubMed] [Google Scholar]
- 2. Uher T, Blahova‐Dusankova J, Horakova D, et al. Longitudinal MRI and neuropsychological assessment of patients with clinically isolated syndrome. J Neurol 2014;261:1735–1744. [DOI] [PubMed] [Google Scholar]
- 3. Rocca MA, Amato MP, De Stefano N, et al. Clinical and imaging assessment of cognitive dysfunction in multiple sclerosis. Lancet Neurol 2015;14:302–317. [DOI] [PubMed] [Google Scholar]
- 4. Uher T, Vaneckova M, Sobisek L, et al. Combining clinical and magnetic resonance imaging markers enhances prediction of 12‐year disability in multiple sclerosis. Mult Scler. 2017;23:51–61. [DOI] [PubMed] [Google Scholar]
- 5. Morrow SA, Drake A, Zivadinov R, et al. Predicting loss of employment over three years in multiple sclerosis: clinically meaningful cognitive decline. Clin Neuropsychol. 2010;24:1131–1145. [DOI] [PubMed] [Google Scholar]
- 6. Blahova Dusankova J, Kalincik T, Dolezal T, et al. Cost of multiple sclerosis in the Czech Republic: the COMS study. Mult Scler. 2012;18:662–668. [DOI] [PubMed] [Google Scholar]
- 7. Langdon DW. Cognition in multiple sclerosis. Curr Opin Neurol 2011;24:244–249. [DOI] [PubMed] [Google Scholar]
- 8. Rao SM, Leo GJ, Haughton VM, et al. Correlation of magnetic resonance imaging with neuropsychological testing in multiple sclerosis. Neurology 1989;39(2 Pt 1):161–166. [DOI] [PubMed] [Google Scholar]
- 9. Rovaris M, Filippi M, Falautano M, et al. Relation between MR abnormalities and patterns of cognitive impairment in multiple sclerosis. Neurology 1998;50:1601–1608. [DOI] [PubMed] [Google Scholar]
- 10. Mesaros S, Rocca MA, Riccitelli G, et al. Corpus callosum damage and cognitive dysfunction in benign MS. Hum Brain Mapp 2009;30:2656–2666. [DOI] [PMC free article] [PubMed] [Google Scholar]
- 11. Daams M, Steenwijk MD, Schoonheim MM, et al. Multi‐parametric structural magnetic resonance imaging in relation to cognitive dysfunction in long‐standing multiple sclerosis. Mult Scler 2015;22:608–619. [DOI] [PubMed] [Google Scholar]
- 12. Calabrese M, Agosta F, Rinaldi F, et al. Cortical lesions and atrophy associated with cognitive impairment in relapsing‐remitting multiple sclerosis. Arch Neurol 2009;66:1144–1150. [DOI] [PubMed] [Google Scholar]
- 13. Nielsen AS, Kinkel RP, Madigan N, et al. Contribution of cortical lesion subtypes at 7T MRI to physical and cognitive performance in MS. Neurology 2013;81:641–649. [DOI] [PMC free article] [PubMed] [Google Scholar]
- 14. Riccitelli G, Rocca MA, Pagani E, et al. Cognitive impairment in multiple sclerosis is associated to different patterns of gray matter atrophy according to clinical phenotype. Hum Brain Mapp 2011;32:1535–1543. [DOI] [PMC free article] [PubMed] [Google Scholar]
- 15. Geurts JJ, Calabrese M, Fisher E, Rudick RA. Measurement and clinical effect of grey matter pathology in multiple sclerosis. Lancet Neurol 2012;11:1082–1092. [DOI] [PubMed] [Google Scholar]
- 16. Houtchens MK, Benedict RH, Killiany R, et al. Thalamic atrophy and cognition in multiple sclerosis. Neurology 2007;69:1213–1223. [DOI] [PubMed] [Google Scholar]
- 17. Fulton JC, Grossman RI, Udupa J, et al. MR lesion load and cognitive function in patients with relapsing‐remitting multiple sclerosis. AJNR Am J Neuroradiol 1999;20:1951–1955. [PMC free article] [PubMed] [Google Scholar]
- 18. Zivadinov R, De Masi R, Nasuelli D, et al. MRI techniques and cognitive impairment in the early phase of relapsing‐remitting multiple sclerosis. Neuroradiology 2001;43:272–278. [DOI] [PubMed] [Google Scholar]
- 19. Lin X, Tench CR, Morgan PS, Constantinescu CS. Use of combined conventional and quantitative MRI to quantify pathology related to cognitive impairment in multiple sclerosis. J Neurol Neurosurg Psychiatry 2008;79:437–441. [DOI] [PubMed] [Google Scholar]
- 20. Heesen C, Schulz KH, Fiehler J, et al. Correlates of cognitive dysfunction in multiple sclerosis. Brain Behav Immun 2010;24:1148–1155. [DOI] [PubMed] [Google Scholar]
- 21. Hulst HE, Steenwijk MD, Versteeg A, et al. Cognitive impairment in MS: impact of white matter integrity, gray matter volume, and lesions. Neurology 2013;80:1025–1032. [DOI] [PubMed] [Google Scholar]
- 22. Hulst HE, Gehring K, Uitdehaag BM, et al. Indicators for cognitive performance and subjective cognitive complaints in multiple sclerosis: a role for advanced MRI? Mult Scler. 2014;20:1131–1134. [DOI] [PubMed] [Google Scholar]
- 23. Achiron A, Barak Y. Cognitive impairment in probable multiple sclerosis. J Neurol Neurosurg Psychiatry 2003;74:443–446. [DOI] [PMC free article] [PubMed] [Google Scholar]
- 24. Maghzi AH, Revirajan N, Julian LJ, et al. Magnetic resonance imaging correlates of clinical outcomes in early multiple sclerosis. Mult Scler Relat Disord 2014;3:720–727. [DOI] [PubMed] [Google Scholar]
- 25. Nourbakhsh B, Nunan‐Saah J, Maghzi AH, et al. Longitudinal associations between MRI and cognitive changes in very early MS. Mult Scler Relat Disord 2016;5:47–52. [DOI] [PubMed] [Google Scholar]
- 26. Hyncicova E, Vyhnalek M, Kalina A, et al. Cognitive impairment and structural brain changes in patients with clinically isolated syndrome at high risk for multiple sclerosis. J Neurol 2017;264:482–493. [DOI] [PubMed] [Google Scholar]
- 27. Mollison D, Sellar R, Bastin M, et al. The clinico‐radiological paradox of cognitive function and MRI burden of white matter lesions in people with multiple sclerosis: a systematic review and meta‐analysis. PLoS ONE 2017;12:e0177727. [DOI] [PMC free article] [PubMed] [Google Scholar]
- 28. Uher T, Krasensky J, Vaneckova M, et al. A novel semiautomated pipeline to measure brain atrophy and lesion burden in multiple sclerosis: a long‐term comparative study. J Neuroimaging 2017;. https://doi.org/10.1111/jon.12445. [DOI] [PubMed] [Google Scholar]
- 29. Kalincik T, Vaneckova M, Tyblova M, et al. Volumetric MRI markers and predictors of disease activity in early multiple sclerosis: a longitudinal cohort study. PLoS ONE 2012;7:e50101. [DOI] [PMC free article] [PubMed] [Google Scholar]
- 30. Benedict RH, Amato MP, Boringa J, et al. Brief International Cognitive Assessment for MS (BICAMS): international standards for validation. BMC Neurology. 2012;12:55. [DOI] [PMC free article] [PubMed] [Google Scholar]
- 31. Dusankova JB, Kalincik T, Havrdova E, Benedict RH. Cross cultural validation of the minimal assessment of cognitive function in multiple sclerosis (MACFIMS) and the brief international cognitive assessment for multiple sclerosis (BICAMS). Clin Neuropsychol 2012;26:1186–1200. [DOI] [PubMed] [Google Scholar]
- 32. Meyer‐Moock S, Feng YS, Maeurer M, et al. Systematic literature review and validity evaluation of the Expanded Disability Status Scale (EDSS) and the Multiple Sclerosis Functional Composite (MSFC) in patients with multiple sclerosis. BMC Neurology. 2014;25:58. [DOI] [PMC free article] [PubMed] [Google Scholar]
- 33. Barkhof F, Filippi M. MRI–the perfect surrogate marker for multiple sclerosis? Nat Rev Neurol 2009;5:182–183. [DOI] [PubMed] [Google Scholar]
- 34. Satz P. Brain reserve capacity on symptom onset after brain injury: a formulation and review of evidence for threshold theory. Neuropsychology. 1993;7:273–295. [Google Scholar]
- 35. Rudick RA, Fisher E, Lee JC, et al. Use of the brain parenchymal fraction to measure whole brain atrophy in relapsing‐remitting MS. Multiple Sclerosis Collaborative Research Group. Neurology 1999;53:1698–1704. [DOI] [PubMed] [Google Scholar]
- 36. Stern Y. What is cognitive reserve? Theory and research application of the reserve concept. J Int Neuropsychol Soc 2002;8:448–460. [PubMed] [Google Scholar]
- 37. Uher T, Vaneckova M, Sormani MP, et al. Identification of multiple sclerosis patients at highest risk of cognitive impairment using an integrated brain magnetic resonance imaging assessment approach. Eur J Neurol 2017;24:292–301. [DOI] [PubMed] [Google Scholar]
- 38. Zivadinov R, Sepcic J, Nasuelli D, et al. A longitudinal study of brain atrophy and cognitive disturbances in the early phase of relapsing‐remitting multiple sclerosis. J Neurol Neurosurg Psychiatry 2001;70:773–780. [DOI] [PMC free article] [PubMed] [Google Scholar]
- 39. De Stefano N, Tomic D, Radue EW, et al. Effect of fingolimod on diffuse brain tissue damage in relapsing‐remitting multiple sclerosis patients. Mult Scler Relat Disord 2016;7:98–101. [DOI] [PubMed] [Google Scholar]
- 40. Arnold DL, Fisher E, Brinar VV, et al. Superior MRI outcomes with alemtuzumab compared with subcutaneous interferon beta‐1a in MS. Neurology 2016;87:1464–1472. [DOI] [PMC free article] [PubMed] [Google Scholar]
Associated Data
This section collects any data citations, data availability statements, or supplementary materials included in this article.
Supplementary Materials
Figure S1. (A) The strength of associations between brain T2 lesion volume (transformed with Cox–Box transformation) and Symbol Digit Modalities Test scores in four multiple sclerosis subpopulations according their Brain Parenchymal Fraction quartiles. (B) Example of the graphical presentation.
Table S1. Structure of the adjusted multivariable models with interaction term.
Table S2. Adjusted multivariable linear regression models between cognitive measures as the dependent variable and the independent demographic, clinical and MRI variables.
Table S3. Correlations between MRI and cognitive measures in females and males.