Abstract
Background
The statistical association between increased exposure to air pollution and increased risk of morbidity and mortality is well established. However, documentation of the health benefits of lowering air pollution levels, which would support the biological plausibility of those past statistical associations, are not as well developed. A better understanding of the aftereffects of interventions to reduce air pollution is needed in order to: 1) better document the benefits of lowered air pollution; and, 2) identify the types of reductions that most effectively provide health benefits.
Methods
This study analyzes daily health and pollution data from three major cities in Israel that have undergone pollution control interventions to reduce sulfur emissions from combustion sources. In this work, the hypothesis tested is that transitions to cleaner fuels are accompanied by a decreased risk of daily cardiovascular and respiratory mortalities. Interrupted time series regression models are applied in order to test whether the cleaner air interventions are associated with a statistically significant reduction in mortality.
Results
In the multi-city meta-analysis we found statistically significant reductions of 13.3% [CI −21.9%, −3.8%] in cardiovascular mortality, and a borderline significant (p=0.06) reduction of 19.0% [CI −35.1%, 1.1%] in total mortality.
Conclusions
Overall, new experiential evidence is provided consistent with human health benefits being associated with interventions to reduce air pollution. The methods employed also provide an approach that may be applied elsewhere in the future to better document and optimize the health benefits of clean air interventions.
1. Introduction
Despite extensive evidence for associations between environmental variations in exposures to ambient air pollution and the occurrence of adverse human health outcomes [1], few studies have documented the health benefits of dramatic reductions in air pollution due to policy interventions. Precipitous reductions in ambient air pollution that affect a considerable population size are uncommon, with air quality improvements usually being more gradual, and spread over many years, making their population health benefits challenging to discern from other time trends. However, occasions when precipitous events, such as a decisive policy implementation that results in dramatic changes in air pollution emissions and concentrations, sometimes referred to as accountability studies [2], can provide unique research opportunities for public health benefits evaluation. A recent policy to dramatically lower sulfur emissions from power plants in Israel provides one such hypothesis testing opportunity that we have exploited in this research to evaluate the health benefits of pollution reductions: between the years 2002–2011, intervention activities to reduce sulfur emissions from power plants were implemented in three of the largest Israeli cities (Haifa, Tel Aviv, and Ashdod) in a two-stage process by replacing the high sulfur fuel oil with low sulfur oil, and then with natural gas. These two similar, but separate, interventions occurred at different times in each of these cities, and were followed by coincident reductions in ambient air pollution levels in each city, most notably in atmospheric sulfur dioxide (SO2) concentrations. At the end of 2002, the power plant in Haifa started a gradual transition from high to low sulfur oil, a move that was completed in 2004. The long-term plan was to shift all three units of the power plant to operate on natural gas, and so, in late 2009, it was shut down and resumed operation when natural gas became available in November 2011. The “Reading” power plant in Tel Aviv shifted to low-sulfur residual oil in mid-2002, and to full operation by natural gas by 2007. The “Eshkol” power plant in Ashdod has gradually shifted to low-sulfur residual oil starting in mid-2002, and to full operation by natural gas in early 2004 (see Figure 1).
Figure 1.
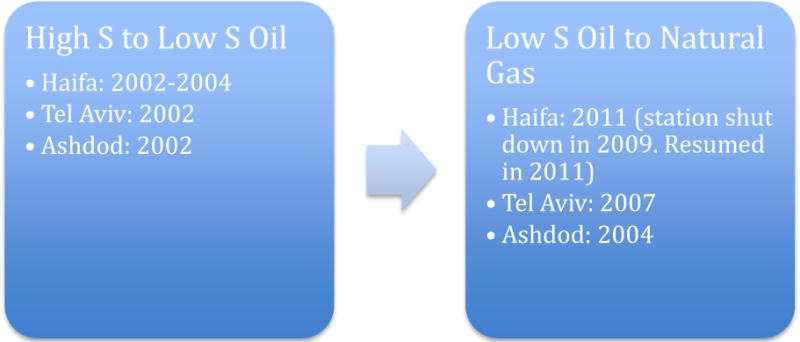
Flow chart of the air pollution interventions in the three cities.
Short-term exposures to SO2 have been associated with several adverse respiratory effects [3–5]. Sources of SO2, largely fossil fuel combustion, generally also emit other pollutants, including particles less than 2.5µm in median aerodynamic diameter (PM2.5,) that are high in potentially toxic constituents. SO2 can also lead to the formation of other sulfur oxides (SOx), which can react in the atmosphere to form secondary PM2.5, such as sulfates [6]. Exposure to PM2.5 has long been associated with increased respiratory and cardiovascular mortality and morbidity, especially in people with pre-existing cardiovascular and respiratory diseases [7–9].
In this study we applied data from the three Israeli cities in order to test the overall hypothesis that a reduction in the sulfur content of combustion fuels is associated with decreased air pollution risk of both daily cardiovascular and respiratory mortality.
The work presented here aims to contribute to the body of knowledge addressing a major public health policy question as to whether a policy of greatly reducing power plant air pollution can be documented to be associated with a measurable decrease in adverse human health outcomes.
2. Methods
2.1. Data Acquisition
Counts of daily deaths from all non-accidental, cardiovascular (ICD10 I00-I99), and respiratory (ICD10 J00-J99) causes were obtained from the Israeli Central Bureau of Statistics (CBS) for the years 2000 through 2011 for each of Israel’s Haifa, Tel Aviv, and Ashdod metropolitan areas (population 540K, 1.3M, and 475K, respectively, in 2000) (Table 1, Figures 2–4). Population age distribution data for the period was also acquired from the CBS. However, age stratified daily counts were not available.
Table 1.
Mean (SE) daily mortality counts, by cause
| Haifa | Tel Aviv | Ashdod | Israel | |
|---|---|---|---|---|
| Total | 12 (3.8) | 25.2 (6.0) | 7.1 (2.8) | 100.3 (16.0) |
| Cardiovascular | 3.8 (2.1) | 7.8 (3.2) | 2.0 (1.4) | 29.9 (7.5) |
| Respiratory | 0.8 (0.9) | 2.1 (1.5) | 0.6 (0.8) | 7.9 (3.4) |
Figure 2.
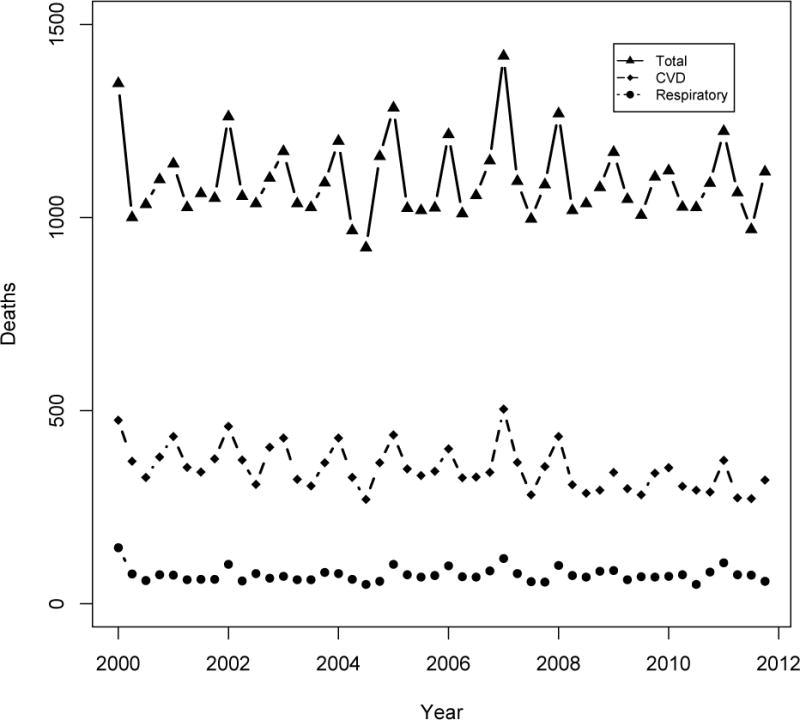
Mortality counts in Haifa bay area, 2000–2011
Figure 4.
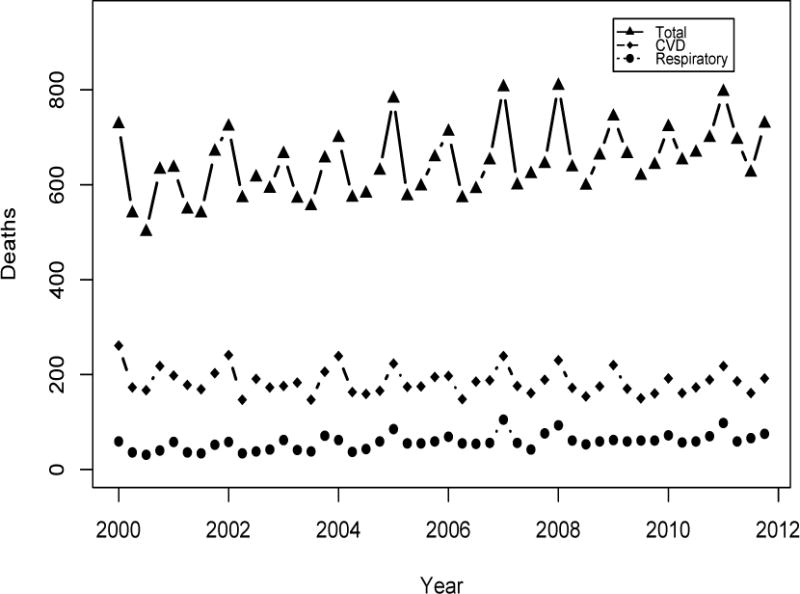
Mortality counts in Ashdod metropolitan area, 2000–2011
Israel’s national air monitoring system consists of more than 140 stations with a few newer stations located in areas farther away from the power plants. The MoEP or the local municipalities operate most of the stations, while the Electric Company operates some (see Appendix Figures A1–A3 for locations of monitoring sites and power plants in each city). Mean daily SO2 and PM2.5 concentrations were obtained from the Ministry of Environmental Protection (MoEP) air monitoring system website [10], as well as from the Israel Electric Company. As reported by Dr. David Broday from the Israeli Technion University [11], SO2 concentrations from the MoEP in Haifa and Ashdod were potentially reported without the proper conversion from µg/m3 to ppb. The MoEP has not confirmed this, however. The issue was apparently corrected in December 2002 in Ashdod, and in December 2008 in Haifa, but up until then it was suggested [11] that all concentrations should be adjusted by a units correction factor of 2.86 (for SO2 1 ppb=2.86 µg/m3). Mean daily temperature and humidity were obtained from the MoEP website.
2.2. Statistical Analysis
We analyzed the changes in ambient SO2 and PM2.5 before and after both the first (from high to low sulfur oil) and the second (from low sulfur oil to natural gas) policy interventions in each city. Designation of “high”, “medium”, and “low” pollution stages for each city were determined from both the time series plots of SO2 concentrations and the reported timing of the policy interventions [12]. The health effects associated with the interventions were evaluated using Interrupted Time Series (ITS), which identifies, tests for, and estimates significant changes in time series that might have been caused by an intervention. ITS is one of the strongest quantitative methods to evaluate causal relationships, and has been argued to be the preferred method for estimating interventions effects [2, 13–15]. In an ITS design, data are collected over time before and after an intervention to detect whether the intervention has an effect significantly greater than the underlying secular trend [13]. The size of the intervention effect is estimated using a segmented regression analysis of ITS [16]:
Where: Yt is the mortality at time t; pollution reduction interventions 1 and 2 are represented by indicator variables (1 for intervention, 0 otherwise); YtRe the mortality in the reference population at time t; f(t) is a smooth function of the time variable t that represents temporal trends and seasonal cycles, and; X is a vector of the other covariates. In this model, β2 and β4 estimate the level change in mortality after the first and second interventions, respectively, whereas β1 estimates the baseline trend, which is the change in mortality that occurred before the intervention. β3 and β5 estimate the change in the trend in mortality after the first and second interventions, respectively, compared with the trend before the interventions.
We regressed the log of daily mortality in each of the cities on indicator variables for the first and second interventions, applying quasi-Poisson models to account for overdispersion in the data. These models were controlled for temporal trends and seasonal cycles, temperature (same day and mean lag previous 3 days), extreme heat events, day-of-week, and mortality trends in a reference population. Using mortality counts without adjustment for population was considered appropriate in this case for each city (similar to the approach of Pridemore and Snowden [17]), as the periods being compared are only a few years apart, during which time population growth in these cities was moderate. Raw counts have the advantage that they are measured directly, while population rates must be calculated from estimated yearly census counts. However, to investigate whether this approach affected the results, we also conducted a sensitivity analysis that instead evaluated annual population mortality rates derived using yearly census population data. Since daily mortality counts were not available by age, we included a variable for the percent of residents who were ≤65 years of age, based on census data, in lieu of direct age-adjustment.
Temporal trends and seasonal cycles were addressed in the model using cubic splines with 7 degrees of freedom (DF) per year, consistent with past multicity studies [18]. We could not control for influenza epidemics because those data were not generally available. However, this would only create a problem for this analysis if the influenza epidemics were correlated in time with the air pollution changes. Moreover, previous studies have indicated that influenza does not bias the association between air pollution and mortality [19,20].
The extent of lagged temperature effect was also modeled based on an exploratory analysis of the delayed association between temperature and mortality. Although the optimal extent of the lagged days was not always consistent across cities and outcomes, the choice of a mean of the lag previous 1–3 days was deemed most representative overall, and was employed for all cities in order to maximize comparability across the cities. The sensitivity of the models to the inclusion of temperature terms was tested, as well as the sensitivity to possible non-linear temperature effects. To control for the health effects of extreme heat events, we employed the discomfort index (DI), which is widely used in Israel and is calculated from temperature (T) and relative humidity (RH) (DI= −0.394479+0.784533×T+0.022226×RH+0.0023765×T×RH). A heat stress indicator variable was included to account for days with DI value of above 28, which is categorized as severe [21,22].
The reference population employed for this analysis, in order to adjust for mortality trends, was the entire Israeli population, excluding the study cities of Haifa, Tel Aviv, and Ashdod, and it was represented in the model as a locally weighted scatterplot smooth (LOESS). The choice of reference population is crucial for causal inference in air pollution accountability studies, since an apparent association between intervention and health outcome may be, in fact, due to a generalized long-term trend that is unrelated to the intervention [23–25]. The intervention-associated improvements in air quality were largely spatially localized, while other nationwide characteristics (e.g., changes in healthcare) were similar to the study cities, given the national healthcare system in Israel [26], making the national data the best available reference population.
We also explored the overall multi-city effect using a meta-analysis, a quantitative method that combines the results of different studies or sub-categories in a single analysis [27]. Meta-analysis has similarly been used in past air pollution epidemiologic studies to estimate an overall effect among varying results from individual cities and studies [29–30].
3. Results
Ambient SO2 concentrations decreased in all three cities after each intervention (Table 2). Overall, ambient SO2 levels in Haifa decreased over 90% after both interventions were completed, while in Tel Aviv and Ashdod SO2 concentration reductions were approximately 80%. However, after applying the correction to address the suspected inaccuracy in SO2 [11], more moderate decreasing SO2 concentration trends are observed, but still statistically significant (shown elsewhere [31]).
Table 2.
SO2 and PM2.5 Concentrations (SE) in Haifa, Tel Aviv, and Ashdod 2000–2011
| Period | Mean (SE) | p-value (comparing to prior period)* | |||
|---|---|---|---|---|---|
| SO2 (ppb) | PM2.5 (μg/m3) | SO2 | PM2.5 | ||
| a. Haifa | |||||
| High | Jan 2000 – May 2002 | 6.66 (0.10) | 21.6 (0.5) | ||
| Medium | Jun 2002 – Oct 2009 | 3.23 (0.03) | 21.0 (0.4) | <0.001 | 0.151 |
| Low ** | Nov 2009– Dec 2011 | 0.50 (0.02) | 18.0 (0.5) | <0.001 | 0.003 |
| b. Tel Aviv | |||||
| High | Jan 2000 – May 2002 | 8.68 (0.04) | 23.1 (0.4) | ||
| Medium | Jun 2002 – Jun 2006 | 2.11 (0.01) | 27.2 (0.5) | <0.001 | 1.000 |
| Low | Jul 2006 – Dec 2011 | 1.69 (0.01) | 22.1 (0.3) | <0.001 | <0.001 |
| c. Ashdod | |||||
| High | Jan 2000 – May 2002 | 14.55(0.13) | 25.8 (0.6) | ||
| Medium | Jun 2003 – Dec 2003 | 4.09 (0.08) | 25.3 (1.3) | <0.001 | 0.354 |
| Low | Jan 2004 – Dec 2011 | 2.75 (0.02) | 28.4 (0.6) | <0.001 | 0.995 |
1-tailed t-test
Station closed in November 2009 and started operating on natural gas in November 2011
PM2.5 mass concentrations did not display the clearcut stepwise decreasing trends observed for SO2 (Table 2): Decreases were observed after the first intervention in Haifa (mean [SE]): (21.6 [0.5] to 21.0 [0.4] µg/m3), and the second intervention in both Haifa (21.0 [0.4] to18.0 [0.5] µg/m3) and Tel Aviv (27.2 [0.5] to 22.1 [0.3] µg/m3), but none in Ashdod. However, trace constituent composition may well have changed, but PM2.5 constituent data were not available to test that hypothesis.
While there was a largely decreasing trend in mortality in the three cities following both interventions, the individual city-specific intervention terms in the ITS models did not achieve statistical significance (Tables 3–4). Following the first intervention, no intervention term was found to be significant in any of the individual outcomes or cities, except for a dramatic decrease in respiratory mortality in Haifa. However, following the second intervention, a number of intervention effect terms in Haifa and Tel Aviv were individually statistically significant.
Table 3.
Changes in mortality after first intervention.
| % Change [CI] | p | ||
|---|---|---|---|
| Haifa | Total | 1.2 [−24.8, 36.2] | 0.94 |
| Cardiovascular | −16.7 [−50.3,39.7] | 0.49 | |
| Respiratory | −82.6 [−95.7, −29.2] | 0.01 | |
| Tel Aviv | Total | −12.4 [−26.8, 4.9] | 0.15 |
| Cardiovascular | −11.8 [−35.0, 19.6] | 0.42 | |
| Respiratory | −7.4 [−51.8, 78.0] | 0.82 | |
| Ashdod | Total | −25.5 [−48.8, 8.6] | 0.13 |
| Cardiovascular | −17.5 [56.9, 57.9] | 0.56 | |
| Respiratory | −28.2 [−85.9, 265.0] | 0.69 |
Table 4.
Changes in mortality after second intervention.
| % Change [CI] | p | ||
|---|---|---|---|
| Haifa | Total | −13.9 [−35.2, 14.6] | 0.31 |
| Cardiovascular | −42.5 [−64.7, −6.5] | 0.03 | |
| Respiratory | −22.1 [−75.4, 145.9] | 0.67 | |
| Tel Aviv | Total | −15.4 [−28.8, 0.5] | 0.06 |
| Cardiovascular | 2.2 [−24.3, 38.0] | 0.89 | |
| Respiratory | −47.2 [−69.4, −9.0] | 0.02 | |
| Ashdod | Total | 5.9 [−23.1, 45.9] | 0.72 |
| Cardiovascular | −11.8 [−50.6, 57.7] | 0.67 | |
| Respiratory | −30.6 [−78.5, 124.6] | 0.54 |
Including a spline of temperature with 3 DF did not improve the fit, as judged by the non-significant p-value of the F statistic for the new model (vs. without this added term).
The results of a sensitivity analysis for testing the effects of analyzing changes in mortality rates (instead of counts) yielded similar results (coefficients were within 0.01 of the coefficients of the models by counts, with similar p-values).
In the multi-city meta-analysis, combining the two interventions for each outcome across all study cities, we found statistically significant reductions of 13.3% [CI −21.9%, −3.8%] in cardiovascular mortality, and a borderline significant (p=0.06) reduction of 19.0% [CI −35.1%, 1.1%] in total mortality. While there was also a reduction in respiratory mortality, it was statistically non-significant (−11.2% [CI −28.2, 9.6]).
4. Discussion
This study innovatively exploited a natural experiment to test the hypothesis that lowered air pollution would reduce mortality in the affected Israeli cities. After these documented interventions to reduce sulfur emission from Israeli power plants in three cities, there were rapid and statistically significant reductions in ambient SO2 concentrations in all three cities. The switch from oil to natural gas generally had the larger estimated effect on health outcomes, but not as great effect on the SO2 levels as the switch to low sulfur fuel, raising the possibility that it was the elimination of oil-combustion particles from the PM2.5 mix that reduced the toxicity of the pollution mix, rather than the SO2 reduction, perse. Also, even though PM2.5 levels did not decline until the switch to natural gas, and then not as dramatically as SO2, it is likely that the composition of the PM2.5 also changed after the interventions, especially regarding its percent sulfate content and its associated metals (e.g., V and Ni) commonly contained in oil combustion-specific particles [32]. Spatial variations in Ni and V have been shown to be explanatory of differences in PM toxicity [33, 34], supporting the hypothesis that changes in PM2.5 composition from a reduction of oil combustion could be a factor in the change in health impacts. However, mass composition data were not available to allow us to directly test this hypothesis using source apportionment methods [e.g., 32].
This study provides a novel form of documentation supporting the causality of health benefits from air pollution reductions. The strongest evidence was provided in the multi-city analysis, in which both interventions were combined across the three study cities, where there were statistically significant reductions of 19.0% [CI −35.1%, 1.1%] and 13.3% [CI −21.9%, −3.8%] for total and cardiovascular mortality, respectively. The multi-city meta-analyses thus indicated statistically significant health benefits, likely due to greater statistical power, gained by pooling the three cities together.
While the multi-city analyses yielded significant reductions in mortality following the interventions, the city-specific tests of associations between interventions and mortality, though largely consistent in direction (i.e., reduced mortality after interventions), were individually underpowered to attain statistical significance. However, there were a few notable strong associations. In Haifa, there was an 82.6% decrease in respiratory mortality following the first intervention, and a 42.5% decrease in cardiovascular mortality following the second intervention. In Tel Aviv, there was a 15.4% decrease in total and a 47.2% decrease in respiratory mortality after the second intervention. However, the dramatic percent reductions in respiratory mortality may be biased due to low number of counts in this category. This hypothesis was supported by the meta-analysis, where the overall reduction in respiratory mortality became statistically non-significant. The similarity between the results of the models considering either counts or population rates are consistent with the original assumption of minimal effect of population growth over the short periods being compared.
The reductions calculated by the meta-analysis are within the range of past documented health effects of long–term air pollution exposure [35], but the estimated percent reductions in total and cardiovascular mortality are higher than reported by other intervention studies of large scale reduction in air pollution [36,24]. However, the interventions considered in the past studies were not for a switching to natural gas, but rather only to low sulfur oil. Our results are comparable to the results of Clancy et al [25], but those were later found to be biased due to confounding by unaddressed long-term improvements in health outcomes that were not related to the air quality intervention [24]. It is thus possible that, despite the measures taken here to control for confounding, and the consideration of a pertinent reference population, our analysis was still affected by unmeasured confounding.
The underlying biological mechanism by which a reduction in ambient SO2 might directly result in the apparent health benefits found here is not known [37–38]. In contrast, the biological mechanisms relating PM2.5 exposure to cardiovascular and respiratory morbidity and mortality include pulmonary and systemic oxidative stress and inflammation, enhanced initiation and progression of atherosclerosis, and altered cardiac autonomic function [35]. Schwartz [39] found that the observed association between SO2 and mortality was due to the fine combustion particles and not SO2 itself. Thus, a more plausible explanation may be that the associated change in PM2.5 mix (especially when switching from oil to natural gas), combined with a reduction in the sulfur content of the air, likely reduced the impact of PM2.5 on health, rather than any direct reduction in effect by SO2 itself. However, we could not directly test this hypothesis since PM2.5 composition data were not available.
Overall, while most of the individual city and intervention associations gave negative effect estimates (i.e., reduced health effects after interventions), most did not achieve statistically significance. However, the combined multi-city meta-analysis did attain statistical significance, with interventions being significantly associated with decreased mortality in the Total and Cardiovascular categories, especially for cardiovascular deaths, and after the switch from burning residual oil to using cleaner natural gas.
While this study had its inherent limitations, it is innovative in that it is the first to examine health benefits of major interventions to reduce sulfur emissions from power plants. Importantly, consistent results were found for the effects of the intervention using two methods, considering both counts and rates. In addition, since the intervention activities took place at different times in the different cities, the statistically significant associations found here provide evidence of consistency, which is one of Bradford Hill’s key criteria for concluding causality [40].
However, as with any analysis of observational data, despite the steps we have taken to avoid any confounding (including the incorporation of a reference population), there is always a possibility of unmeasured confounding, as potential noncausal explanations for the observed associations could arise from unmodeled confounders. Other potential weaknesses of this study include limited power to detect interventions effects in smaller individual cities. Zhang et al [41] demonstrated that, in ITS design, power is affected by sample size and unbalanced study periods before and after an intervention, which was the case in this study.
Another potential drawback is the inability to conduct direct age adjustments to the analysis, but rather including the proportion of population ≤65 years of age in each of the cities. However, it has been suggested by others that this method may be preferable over direct age adjustment, and can produce unbiased estimates [42]. After indirectly adjusting for age, some central effect estimates went down, mostly in the medium pollution period, but the overall reduction in mortality effect remained unattenuated.
Additionally, while the control population was relatively unaffected by the intervention with respect to improved air quality, there are some demographic differences between the individual cities, and also between the cities and the total Israeli population, which served as the reference population in this study. Israeli population is predominately Jewish, but there is an Arab minority that accounts for about 20% of the total population. According to the 2008 census, the standardized death rates in the Arab population were 5.7 per 1000, compared to 4.8 in the Jewish population [43]. In 1995, the Arab population in Haifa represented 9.0% of the total population, while in Tel Aviv it was 1.1%. In 2013 total Arab population in Haifa was 11.0% of the total population relative to 1.4% in Tel Aviv. Data for Ashdod was not available, but the population there is predominately Jewish. Overall, the Arab population in Israel represented 18.0% and 20.6% of the total Israeli population in 1995 and 2012, respectively. Both proportion and growth rate of the Arab population in Haifa are greater than that in Tel Aviv, but lower than in the control population. These proportion differences might have resulted in biases in our estimates of the effects of the long-term trends in population health. However, given that the long-term population trend was addressed via a LOESS smooth, and not by actual counts, any population change bias was likely minimized.
Overall, even considering these factors, the pooled city and intervention analysis provides further documentation that air pollution interventions, specifically using cleaner fossil fuels, is associated with benefits to human health. This was especially the case for the switch from oil to natural gas. The results of this study are consistent with the health benefits of cleaner air, and highlight the value of air pollution accountability studies and the need for a consistent framework and prospective planning of such studies in future interventions.
Supplementary Material
Figure 3.
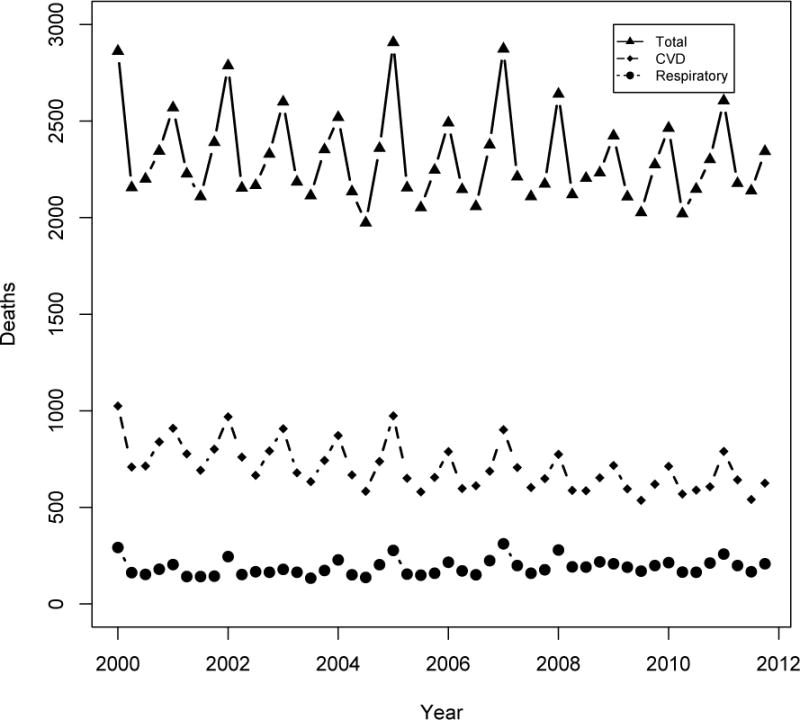
Mortality counts in Tel Aviv metropolitan area, 2000–2011
Acknowledgments
We would like to thank the following people for their guidance: Dr. Eric Amster, Dr. Yu Chen, Dr. Kevin Cromar, and Dr. Terry Gordon. Dr. Thurston was supported in this work in part by the NYU-NIEHS Center of Excellence (NIH Grant ES00260).
Appendix
Figure A1.
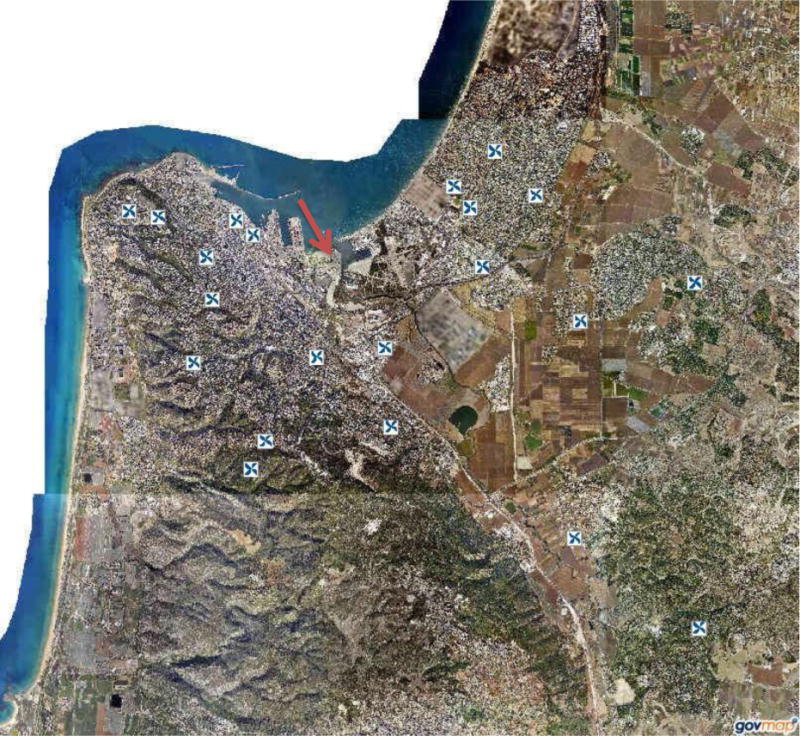
Location of monitoring stations in Haifa bay area. Red arrow represents the location of the power station. Source: http://www.govmap.gov.il/, Google Maps.
Figure A2.
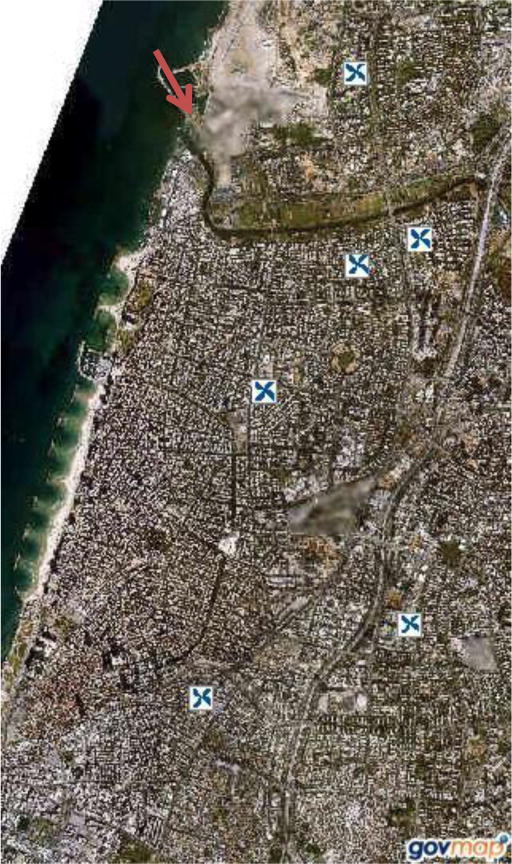
Location of monitoring stations in Tel Aviv. Red arrow represents the location of the Reading power station. Source: http://www.govmap.gov.il/, Google Maps.
Figure A3.
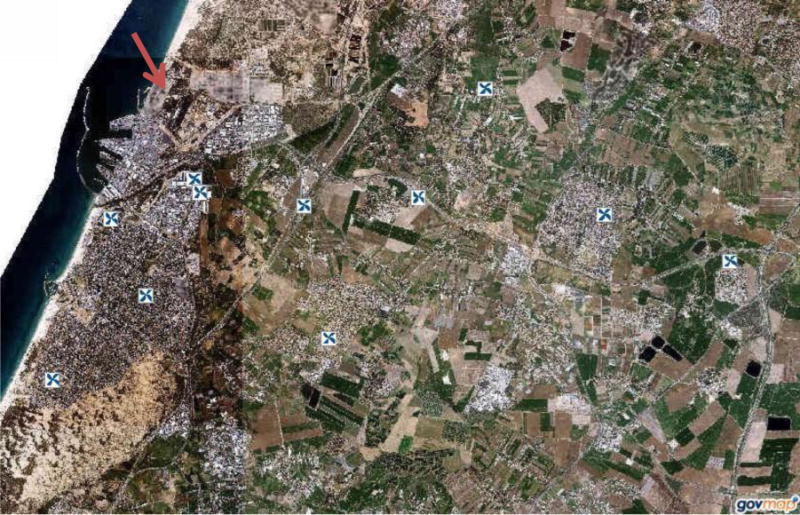
Location of monitoring stations in Ashdod. Red arrow represents the location of the Eshkol power station. Source: http://www.govmap.gov.il/, Google Maps
References
- 1.Holgate S, Grigg J, Agius R, Ashton JR, Cullinan P, Exley K, Fishwick D, Fuller G, Gokani N, Griffiths C, Harrison P. Every breath we take: The lifelong impact of air pollution. Royal College of Physicians; (Report of a working party). [Google Scholar]
- 2.Gilmour S, Degenhardt L, Hall W, Day C. Using intervention time series analyses to assess the effects of imperfectly identifiable natural events: a general method and example. BMC medical research methodology. 2006 Apr 3;6(1):16. doi: 10.1186/1471-2288-6-16. [DOI] [PMC free article] [PubMed] [Google Scholar]
- 3.Ware JH, Ferris BG, Jr, Dockery DW, Spengler JD, Stram DO, Speizer FE. Effects of ambient sulfur oxides and suspended particles on respiratory health of preadolescent children. The American review of respiratory disease. 1986 May;133(5):834–42. [PubMed] [Google Scholar]
- 4.Koenig JQ, Covert DS, Pierson WE. Effects of inhalation of acidic compounds on pulmonary function in allergic adolescent subjects. Environmental health perspectives. 1989 Feb;79:173. doi: 10.1289/ehp.8979173. [DOI] [PMC free article] [PubMed] [Google Scholar]
- 5.Roemer W, Hoek G, Brunekreef B. Effect of ambient winter air pollution on respiratory health of children with chronic respiratory symptoms. American Journal of Respiratory and Critical Care Medicine. 1993 Jan 1;147(1):118–24. doi: 10.1164/ajrccm/147.1.118. [DOI] [PubMed] [Google Scholar]
- 6.Environmental Protection Agency. Particulate Matter [Internet] [Cited 2015 Mar 31]. Available from: https://www3.epa.gov/pm/
- 7.Ozkaynak H, Thurston GD. Associations between 1980 U.S. mortality rates and alternative measures of airborne particle concentration. Risk Analysis. 1987;7:449–460. doi: 10.1111/j.1539-6924.1987.tb00482.x. [DOI] [PubMed] [Google Scholar]
- 8.Pope CA, III, Dockery DW. Health effects of fine particulate air pollution: lines that connect. Journal of the air & waste management association. 2006 Jun 1;56(6):709–42. doi: 10.1080/10473289.2006.10464485. [DOI] [PubMed] [Google Scholar]
- 9.Pope CA, III, Ezzati M, Dockery DW. Fine-particulate air pollution and life expectancy in the United States. New England Journal of Medicine. 2009 Jan 22;360(4):376–86. doi: 10.1056/NEJMsa0805646. [DOI] [PMC free article] [PubMed] [Google Scholar]
- 10.Ministry of Environmental Protection. [Internet]. [Accessed October 2012]. Available from: http://www.svivaaqm.net/Default.rtl.aspx
- 11.Ramsay CR, Matowe L, Grilli R, Grimshaw JM, Thomas RE. Interrupted time series designs in health technology assessment: lessons from two systematic reviews of behavior change strategies. International journal of technology assessment in health care. 2003 Dec 1;19(04):613–23. doi: 10.1017/s0266462303000576. [DOI] [PubMed] [Google Scholar]
- 12.Pridemore WA, Snowden AJ. Reduction in suicide mortality following a new national alcohol policy in Slovenia: An interrupted time-series analysis. American journal of public health. 2009 May;99(5):915–20. doi: 10.2105/AJPH.2008.146183. [DOI] [PMC free article] [PubMed] [Google Scholar]
- 13.Peng RD, Dominici F, Louis TA. Model choice in time series studies of air pollution and mortality. Journal of the Royal Statistical Society: Series A (Statistics in Society) 2006 Mar 1;169(2):179–203. [Google Scholar]
- 14.Braga AL, Zanobetti A, Schwartz J. Do respiratory epidemics confound the association between air pollution and daily deaths? European Respiratory Journal. 2000 Oct 1;16(4):723–8. doi: 10.1034/j.1399-3003.2000.16d26.x. [DOI] [PubMed] [Google Scholar]
- 15.Touloumi G, Samoli E, Quenel P, Paldy A, Anderson RH, Zmirou D, Galan I, Forsberg B, Schindler C, Schwartz J, Katsouyanni K. Short-term effects of air pollution on total and cardiovascular mortality: the confounding effect of influenza epidemics. Epidemiology. 2005 Jan 1;16(1):49–57. doi: 10.1097/01.ede.0000142152.62400.13. [DOI] [PubMed] [Google Scholar]
- 16.Epstein Y, Moran DS. Thermal comfort and the heat stress indices. Industrial health. 2006;44(3):388–98. doi: 10.2486/indhealth.44.388. [DOI] [PubMed] [Google Scholar]
- 17.Peretz C, Biggeri A, Alpert P, Baccini M. National Security and Human Health Implications of Climate Change. Springer; Netherlands: 2012. The Effect of Heat Stress on Daily Mortality in Tel Aviv, Israel; pp. 241–251. [Google Scholar]
- 18.Hubbell B, Greenbaum D. Counterpoint: Moving From Potential-Outcomes Thinking to Doing—Changing Research Planning to Enable Successful Health Outcomes Research. American journal of epidemiology. 2014 Nov 15;:kwu266. doi: 10.1093/aje/kwu266. [DOI] [PubMed] [Google Scholar]
- 19.Dockery DW, Rich DQ, Goodman PG, Clancy L, Ohman-Strickland P, George P, Kotlov T. Effect of air pollution control on mortality and hospital admissions in Ireland. Research Report (Health Effects Institute) 2013 Jul;(176):3–109. [PubMed] [Google Scholar]
- 20.Clancy L, Goodman P, Sinclair H, Dockery DW. Effect of air-pollution control on death rates in Dublin, Ireland: an intervention study. The lancet. 2002 Oct 19;360(9341):1210–4. doi: 10.1016/S0140-6736(02)11281-5. [DOI] [PubMed] [Google Scholar]
- 21.Rosen B, Waitzberg R, Merkur S. Israel: Health System Review. Health systems in transition. 2015;17(6):1–212.2. [PubMed] [Google Scholar]
- 22.Card D, Krueger AB. Time-series minimum-wage studies: a meta-analysis. The American Economic Review. 1995 May 1;85(2):238–43. [Google Scholar]
- 23.Stieb DM, Judek S, Burnett RT. Meta-analysis of time-series studies of air pollution and mortality: effects of gases and particles and the influence of cause of death, age, and season. Journal of the Air & Waste Management Association. 2002 Apr 1;52(4):470–84. doi: 10.1080/10473289.2002.10470794. [DOI] [PubMed] [Google Scholar]
- 24.Bell ML, Dominici F, Samet JM. A meta-analysis of time-series studies of ozone and mortality with comparison to the national morbidity, mortality, and air pollution study. Epidemiology (Cambridge, Mass) 2005 Jul;16(4):436. doi: 10.1097/01.ede.0000165817.40152.85. [DOI] [PMC free article] [PubMed] [Google Scholar]
- 25.Bell ML, Zanobetti A, Dominici F. Who is more affected by ozone pollution? A systematic review and meta-analysis. American journal of epidemiology. 2014 Jul 1;180(1):15–28. doi: 10.1093/aje/kwu115. [DOI] [PMC free article] [PubMed] [Google Scholar]
- 26.Israel Elecrtic Corporation. www.iec.co.il
- 27.In a conversation (Basel, Switzerland. Oral communication, August 2013).
- 28.Yinon Lital. An Evaluation of the Health Benefits of an Air Quality Intervention in Three Israeli Cities. Ann Arbor: ProQuest; 2015. (Order No. 3716632 New York University). Web. 22 July 2016. [Google Scholar]
- 29.Thurston GD, Burnett RT, Turner MC, Shi Y, Krewski D, Lall R, Ito K, Jerrett M, Gapstur SM, Diver WR, Pope CA., III . Ischemic Heart Disease Mortality and Long-Term Exposure to Source-Related Components of US Fine Particle Air Pollution. Environ Health Perspect; 2015. Dec 2, [DOI] [PMC free article] [PubMed] [Google Scholar]
- 30.Pope CA, Burnett RT, Thurston GD, Thun MJ, Calle EE, Krewski D, Godleski JJ. Cardiovascular mortality and long-term exposure to particulate air pollution epidemiological evidence of general pathophysiological pathways of disease. Circulation. 2004 Jan 6;109(1):71–7. doi: 10.1161/01.CIR.0000108927.80044.7F. [DOI] [PubMed] [Google Scholar]
- 31.Hedley AJ, Wong CM, Thach TQ, Ma S, Lam TH, Anderson HR. Cardiorespiratory and all-cause mortality after restrictions on sulphur content of fuel in Hong Kong: an intervention study. The lancet. 2002 Nov 23;360(9346):1646–52. doi: 10.1016/s0140-6736(02)11612-6. [DOI] [PubMed] [Google Scholar]
- 32.Lazarus SC, Wong HH, Watts MJ, Boushey HA, Lavins BJ, Minkwitz MC. The leukotriene receptor antagonist zafirlukast inhibits sulfur dioxide–induced bronchoconstriction in patients with asthma. American journal of respiratory and critical care medicine. 1997 Dec 1;156(6):1725–30. doi: 10.1164/ajrccm.156.6.9608006. [DOI] [PubMed] [Google Scholar]
- 33.Krewski D, Burnett R, Goldberg M, Hoover BK, Siemiatycki J, Jerrett M, Abrahamowicz M, White W. Overview of the reanalysis of the Harvard six cities study and American Cancer Society study of particulate air pollution and mortality. Journal of Toxicology and Environmental Health Part A. 2003 Jan 1;66(16–19):1507–52. doi: 10.1080/15287390306424. [DOI] [PubMed] [Google Scholar]
- 34.Schwartz J. Daily deaths are associated with combustion particles rather than SO2 in Philadelphia. Occupational and environmental medicine. 2000 Oct 1;57(10):692–7. doi: 10.1136/oem.57.10.692. [DOI] [PMC free article] [PubMed] [Google Scholar]
- 35.Hill AB. The environment and disease: association or causation? Proceedings of the Royal Society of Medicine. 1965 May;58(5):295. doi: 10.1177/003591576505800503. [DOI] [PMC free article] [PubMed] [Google Scholar]
- 36.Zhang F, Wagner AK, Ross-Degnan D. Simulation-based power calculation for designing interrupted time series analyses of health policy interventions. Journal of clinical epidemiology. 2011 Nov 30;64(11):1252–61. doi: 10.1016/j.jclinepi.2011.02.007. [DOI] [PubMed] [Google Scholar]
- 37.Guo HR. Age adjustment in ecological studies: using a study on arsenic ingestion and bladder cancer as an example. BMC Public Health. 2011 Oct 20;11(1):820. doi: 10.1186/1471-2458-11-820. [DOI] [PMC free article] [PubMed] [Google Scholar]
- 38.Central Bureau of Statistics. Mortality and Life Expectancy. [Internet] [Cited 2015 Apr 28]. Available from: http://www.cbs.gov.il/reader/cw_usr_view_SHTML?ID=591.
Associated Data
This section collects any data citations, data availability statements, or supplementary materials included in this article.


