

Summary
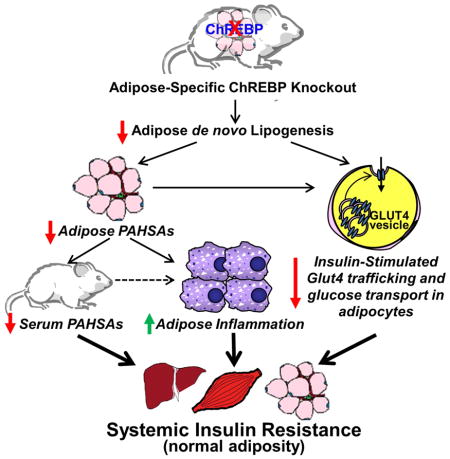
Lower adipose-ChREBP and de novo lipogenesis (DNL) are associated with insulin resistance in humans. Here we generated adipose-specific ChREBP knockout (AdChREBP KO) mice with negligible sucrose-induced DNL in adipose tissue (AT). Chow-fed AdChREBP KO mice are insulin-resistant with impaired insulin action in liver, muscle and AT, and increased AT inflammation. HFD-fed AdChREBP KO mice are also more insulin-resistant than controls. Surprisingly, adipocytes lacking ChREBP display a cell-autonomous reduction in insulin-stimulated glucose transport which is mediated by impaired Glut4 translocation and exocytosis, not lower Glut4 levels.. AdChREBP KO mice have lower levels of palmitic acid esters of hydroxy stearic acids (PAHSAs) in serum and AT. 9-PAHSA supplementation completely rescues their insulin resistance and AT inflammation. 9-PAHSA also normalizes impaired glucose transport and Glut4 exocytosis in ChREBP KO adipocytes. Thus, loss of adipose-ChREBP is sufficient to cause insulin resistance potentially by regulating AT glucose transport and flux through specific lipogenic pathways.
eTOC blurb
ChREBP expression in fat strongly correlates with insulin sensitivity in people. Vijayakumar et al demonstrate that fat-specific knockout of ChREBP in mice is sufficient to cause insulin resistance and cell-autonomous impairments in glucose transport and Glut4 trafficking potentially by altering substrate flux through specific lipogenic pathways.
Introduction
Insulin resistance is an early hallmark of Type 2 diabetes (T2D) and obesity, and is characterized by decreased insulin-stimulated glucose transport into white adipose tissue (WAT) and muscle (Shepherd and Kahn, 1999). The insulin-responsive glucose transporter, Glut4, is at the crux of this defect. Glut4 protein levels are down-regulated in WAT of insulin- resistant humans and its translocation from intracellular storage vesicles to the plasma membrane is impaired in muscle (Shepherd and Kahn, 1999). Modulation of glucose flux into WAT is sufficient to alter systemic metabolic homeostasis. Adipose-specific deletion of Glut4 in mice (AG4KO) causes systemic insulin resistance (Abel et al., 2001), while adipose-specific overexpression of Glut4 in mice (AG4OX) results in improved glucose tolerance despite increased adiposity (Shepherd et al., 1993). Global gene expression profiles in AG4KO and AG4OX WAT revealed reciprocal changes in genes regulating de novo lipogenesis (DNL, fatty acid synthesis). This metabolic switch is controlled by the transcription factor, Carbohydrate Response Element Binding Protein (ChREBP) (Herman et al., 2012).
ChREBP is activated by simple carbohydrates such as glucose and fructose. In addition to DNL, ChREBP regulates glycolysis and the pentose phosphate pathway (Baraille et al., 2015; Iizuka et al., 2004). It dimerizes with the co-factor Max-like protein X (Mlx) and directly binds to carbohydrate response elements (ChOREs), consensus sequences in target genes promoters (Baraille et al., 2015). The recently discovered ChREBPβ isoform is more potent than the more abundant ChREBPα isoform (Herman et al., 2012). The current model of ChREBP activation involves post-translational modification of ChREBPα in response to high glucose/fructose which induces ChREBPβ transcription, resulting in target gene induction (Baraille et al., 2015; Herman et al., 2012).
Our lab showed that ChREBP is an important mediator of WAT DNL, and that down-regulation of this pathway in WAT is associated with insulin resistance (Herman et al., 2012). ChREBP expression is increased in WAT of AG4OX mice in association with up-regulation of lipogenic enzymes and DNL (Herman et al., 2012; Tozzo et al., 1995). Systemic deletion of ChREBP in AG4OX mice decreases this elevated WAT DNL and reverses their improved glucose tolerance (Herman et al., 2012). Higher WAT DNL is also observed in other metabolically favorable states such as calorie restriction and adaptive thermogenesis (Bruss et al., 2010; Mottillo et al., 2014). In contrast, high-fat diet (HFD) feeding in wild-type mice lowers ChREBP expression and DNL specifically in WAT and not in liver, another tissue with high rates of DNL and ChREBP expression (Herman et al., 2012). Moreover, in humans, WAT ChREBP and lipogenic enzyme expression strongly correlate with insulin sensitivity even in obesity (Eissing et al., 2013; Kursawe et al., 2013; Roberts et al., 2009). Improving insulin sensitivity in insulin resistant people restores WAT ChREBP expression (Eissing et al., 2013; Kursawe et al., 2013). Thus, in humans, ChREBP and DNL in WAT are highly associated with insulin sensitivity and down-regulation of this pathway may promote insulin resistance.
A metabolic signature of increased fatty acid desaturation (monounsaturated to saturated fatty acid ratio) and elongation is associated with insulin sensitivity in humans and rodents (Benhamed et al., 2012; Rhee et al., 2011). Also, we recently identified a class of insulin-sensitizing lipids, branched fatty acid esters of hydroxy fatty acids (FAHFAs) that are regulated by ChREBP (Lee et al., 2016; Yore et al., 2014). Serum and WAT levels of one FAHFA sub-family, palmitic acid hydroxy stearic acid (PAHSA) strongly correlate with insulin sensitivity in humans and rodents. Moreover, PAHSAs improve glucose homeostasis and have potent anti-inflammatory effects. PAHSAs also promote insulin-stimulated glucose transport and Glut4 translocation in adipocytes. A total of 8 PAHSA isomers, defined by the position of the ester bond, were identified in mammalian tissues. PAHSAs are most abundant in WAT which has the highest number of PAHSA isomers, suggesting that it is an important site for PAHSA synthesis and/or storage (Yore et al., 2014). Thus, adipose-ChREBP and DNL may be insulin sensitizing by promoting the synthesis and/or accumulation of metabolically beneficial lipids.
The aims of the current study were to investigate whether loss of ChREBP selectively in adipose tissue is sufficient to decrease DNL and cause insulin resistance, and to determine the underlying mechanisms. We generated mice with adipose tissue-specific deletion of ChREBP (AdChREBP KO mice) and show that this abrogates sucrose-induced DNL in WAT and causes systemic insulin resistance with impaired insulin action in liver, muscle and WAT. Unexpectedly, there is a cell autonomous reduction in insulin-stimulated glucose transport in adipocytes lacking ChREBP. This defect arises from impaired Glut4 translocation in spite of intact Akt signaling. Abundance of PAHSA isomers is reduced in WAT and serum of AdChREBP KO mice and 9-PAHSA supplementation completely reverses their insulin resistance. The mechanism appears to involve decreased WAT inflammation and increased insulin-stimulated adipocyte glucose transport. Thus, ChREBP in adipocytes plays an important role in systemic insulin sensitivity most likely by regulating glucose flux through specific lipogenic pathways.
Results
Generation of AdChREBP KO mice
Exons 9–11 of ChREBP were excised in adipose tissue using Cre recombinase driven by the adiponectin promoter. The resulting AdChREBP KO mice had >90% lower chrebptotal and chrebpβ and ~70% lower chrebpα mRNA expression in WAT (Fig 1A) and brown adipose tissue (BAT) (Fig S1A). Expression of ChREBP targets such as glucose transporter 5 (glut5) and fibroblast growth factor 21 (fgf21) are 88% and 60% lower respectively in subcutaneous (SQ) WAT of AdChREBP KO mice indicating reduced ChREBP transcriptional activity (Fig 1B). However, expression of thioredoxin interacting protein (txnip) is unaltered in WAT of AdChREBP KO vs. ChREBPfl/fl mice (Fig 1B). Expression of lipogenic enzymes and transcriptional cofactors such as thyroid responsive protein/SPOT14 (spot14), ATP-citrate lyase (acly), acetyl-CoA carboxylase-1 (acc1), fatty acid synthase (fas), stearoyl-CoA desaturase-1 (scd1), and fatty acid elongase-6 (elovl6) with known ChOREs are reduced in SQ WAT of AdChREBP KO mice suggesting down-regulation of DNL (Fig 1C). In liver, ChREBP regulates expression of rate controlling enzymes in the pentose phosphate pathway (glucose 6-phosphate dehydrogenase (g6pd)) and glycolysis (liver-type pyruvate kinase (pklr)) (Baraille et al., 2015; Ma et al., 2006). g6pd expression is not altered in AdChREBP KO WAT (Fig 1C). WAT expresses the M2-type pyruvate kinase isoform (pkm2), and not pklr. ChREBP does not regulate pkm2 and its expression is unchanged in AdChREBP KO WAT (Fig 1C). Expression of ChREBP targets and lipogenic enzymes are similarly altered in BAT of AdChREBP KO mice (Fig S1B).
Figure 1. Deletion of ChREBP selectively in adipocytes abrogates sucrose-induced DNL in WAT but not liver.

Expression of total ChREBP and its isoforms (A), ChREBP target genes (B), and lipogenic genes (C) in SQ WAT (n=7–8/group).
DNL from all substrates (D) and glucose (E) in WAT in ad lib-fed (n=7–11/group) and sucrose re-fed (n=3–5/group) mice.
(F) Expression of chrebptotal and chrebpβ in PG WAT.
(G) Serum insulin levels.
Expression of lipogenic transcription factors (H) and lipogenic genes (I) in PG WAT.
n=3–5/group for F–I
(J) DNL from all substrates (left) and glucose (right) in liver in ad lib-fed (n=7–11/group) and sucrose re-fed (n=3–5/group) mice.
Hepatic expression of ChREBP and its isoforms (K) and lipogenic genes (L) (n=3–5/group).
Data are mean±SEM. 16-week old female mice were used for all experiments. mRNA expression was normalized to tbp and shown as fold change over ChREBPfl/fl (A–C) or ad lib-fed controls (F, H–I, K–L). In D–G & J, F= ad lib-fed and R= sucrose re-fed. *p<0.05; $p<0.06 vs. ChREBPfl/fl, same feeding condition; #p<0.05 vs. ad lib-fed, same genotype. (also see Fig S1)
Adipose deletion of ChREBP abrogates sucrose-induced DNL in adipose tissue but not liver
Despite down-regulation of lipogenic genes in WAT of AdChREBP KO mice, DNL from all substrates or glucose is similar between ad lib-fed control (wild-type, adiponectin-Cre+/−, ChREBPfl/fl) and AdChREBP KO mice in perigonadal (PG) and SQ WAT depots (Fig 1D–E). Sucrose re-feeding induces DNL from all substrates ~30–35 fold above ad lib-fed in WAT of control mice and only 6–9 fold in AdChREBP KO mice (Fig 1D). The effect is even more pronounced for DNL from glucose. Sucrose re-feeding induces DNL from glucose by 7.5 fold in PG WAT and 15 fold in SQ WAT of control mice. This is completely abrogated in AdChREBP KO mice (Fig 1E). Sucrose re-feeding results in 5 fold higher chrebptotal and >100 fold higher chrebpβ expression vs. ad lib-fed in control WAT. As expected, this induction is completely lost in AdChREBP KO mice (Fig 1F). In ad lib-fed control mice, the rates of DNL in BAT are ~40 fold higher than in WAT (Fig S1C). Moreover, ad lib-fed DNL from all substrates and glucose in BAT is lower in AdChREBP KO mice than controls (Fig S1C). Sucrose re-feeding induces DNL from all substrates by 1.5 fold in control BAT and 1.7 fold in AdChREBP KO BAT (Fig S1C). However, similar to WAT, sucrose re-feeding induces DNL from glucose by 6 fold in control BAT and only 1.6 fold in AdChREBP KO BAT (Fig S1C). These data suggest that while adipose-ChREBP may not be critical to maintain ad lib-fed DNL, it is required for induction of DNL in WAT and BAT in response to sucrose.
Reduced DNL in WAT and BAT of AdChREBP KO mice with sucrose re-feeding is not due to lower serum insulin levels (Fig 1G) which regulates DNL by inducing the sterol response element binding protein (SREBP) family of transcription factors (Baraille et al., 2015). Expression of srebp1 and srebp2 is normal in PG WAT of ad lib-fed AdChREBP KO mice relative to controls (Fig 1H). Sucrose re-feeding induces srebp1 similarly in both genotypes, but srebp2 expression is higher in sucrose re-fed AdChREBP KO mice than controls (Fig 1H). Expression of SREBP1 target genes, acyl-CoA synthetase short-chain family member-2 (acss2) and glycerol-3-phosphate acyltransferase-1 (gpat1), are not different between the genotypes in either feeding condition (Fig S1D). Expression of liver X receptor isoforms (lxrα and lxrβ), and their target genes ATP-Binding Cassette, sub-family A, member 1 (abca1) and inducible degrader of the LDL receptor (idol) are also unaltered in AdChREBP KO mice (Fig 1H, S1D). Yet, expression of a majority of lipogenic genes (spot14, pyruvate carboxylase (pcx), acly, acc1, fas, and elovl6) is markedly elevated in WAT and BAT of control but not AdChREBP KO mice with sucrose re-feeding (Fig 1I, S1B). These data suggest that ChREBP, but not other lipogenic transcription factors, is critical for driving the increased DNL with sucrose re-feeding in adipose tissue.
DNL from all substrates in liver is comparable in ad lib-fed mice, and is induced by 3 and 6 fold in control and AdChREBP KO mice respectively with sucrose re-feeding (Fig 1J left). Hepatic DNL from glucose is not altered in AdChREBP KO mice (ad lib-fed p=0.19; re-fed p=0.8) (Fig 1J right). The expression of ChREBP, and target/lipogenic genes are unchanged in livers of ad lib-fed AdChREBP KO mice relative to controls (Fig 1K, S1E). Unlike in WAT, sucrose re-feeding does not induce hepatic chrebptotal which mainly reflects ChREBPα. But hepatic chrebpβ is induced 4–5 fold with sucrose re-feeding in both genotypes (Fig 1K). srebp2 expression is slightly elevated in livers of ad-lib-fed AdChREBP KO mice compared to controls. But there is no genotypic difference in expression of srebp1, srebp2, lxrα, and lxrβ, or their target genes with sucrose re-feeding (Fig S1F). Sucrose re-feeding also increases hepatic expression of lipogenic genes in both control and AdChREBP KO mice, unlike in WAT and BAT (Fig 1L). Thus, loss of adipose-ChREBP does not reduce DNL or ChREBP expression and/or activity in liver.
Loss of adipose-ChREBP is sufficient to cause systemic insulin resistance and increased WAT inflammation in chow-fed mice
Male and female AdChREBP KO mice have normal development with no difference in body weight or total body fat mass relative to chow-fed littermate ChREBPfl/fl controls (Fig 2A–B, S2A–B). PG, but not SQ, WAT mass is reduced in 16-week and older female AdChREBP KO mice, with no difference in liver or muscle mass (Fig 2C).
Figure 2. Loss of adipose-ChREBP causes insulin resistance and WAT inflammation in lean mice.

Body weight (A), fat mass [per mouse (left) and relative to body weight (right)] (B), and wet tissue weight (C) (n=6–11/group).
ITT (0.5U/kg, i.p.) (D) Inset: AAC (mg/dl*min*103) (left) and slope0–15 (mg/dl/min) (right). GTT (2g/kg, i.p.) area under the curve (AUC, mg/dl*min*103) (E) in 9–11 week-old mice n=7–8/group.
GIR (F) and endogenous glucose production (EGP) (G) during hyperinsulinemic-euglycemic clamps. #-p<0.05 vs. basal, same genotype.
(H) Liver TG levels 6h after food removal.
(I) In vivo tissue 2DOG transport at the end of the clamp.
n=7–8/group for F–I
GSIS (J) and serum FFAs (K) in overnight fasted mice during GTT (n=19–23/group). †p<0.05 vs. T0, same genotype; ϕp<0.05 vs. T0 ChREBPfl/fl; #-p<0.05 vs. all, same genotype, t-test.
(L) Glycerol secretion from PG WAT explants after 6h of food removal. #-p<0.05, $p<0.06 vs. no insulin, no 8-Br cAMP, same genotype; †p<0.05 vs. 8-BrcAMP, no insulin, same genotype (n=7/group).
(M) Insulin signaling (1U/kg, 5min) (n=4–5/group). #p< 0.05 vs. saline.
(N) Numbers of total, pro-inflammatory (M1) and anti-inflammatory (M2), TNFα+, and IL-1β+ adipose tissue macrophages (ATMs) in PG WAT of 8 week-old male mice measured by flow cytometry (n=9/group).
Data are mean±SEM. A–M were performed in chow-fed female mice. *p< 0.05 vs. ChREBPfl/fl, same condition. (also see Fig S2–3)
Female (4–40 weeks of age) and young male (9–12 weeks of age) AdChREBP KO mice are insulin resistant by insulin tolerance tests (ITT) with a lower area above the curve (AAC) than ChREBPfl/fl mice (Figs 2D, S2C). Slope of glycemia between 0–15 min of the ITT, an index of insulin sensitivity (Hughey et al., 2014), is also reduced in AdChREBP KO mice (Fig 2D). Glucose tolerance is impaired in female (Fig 2E), but not male (Fig S2D), AdChREBP KO mice relative to ChREBPfl/fl littermates.
During hyperinsulinemic-euglycemic clamps AdChREBP KO mice have lower steady state glucose infusion rate (GIR) than ChREBPfl/fl mice (Fig 2F) indicating systemic insulin resistance. Also, liver, muscle and WAT from AdChREBP KO mice are insulin resistant. AdChREBP KO mice have impaired suppression (13%) of endogenous glucose production (which mainly reflects hepatic glucose production) compared to ChREBPfl/fl mice (64%) during the clamp (Fig 2G). This hepatic insulin resistance does not result from steatosis since hepatic triglyceride (TG) levels are lower in AdChREBP KO mice (Fig 2H). In addition, 2-deoxyglucose (2DOG) uptake at the end of the clamp is reduced by 44% in muscle and 29% in WAT of AdChREBP KO versus ChREBPfl/fl mice (Fig 2I). Thus, loss of adipose-ChREBP is sufficient to impair insulin action in other tissues such as liver and muscle.
Despite systemic insulin resistance, levels of circulating metabolites are not drastically altered in AdChREBP KO mice. While serum insulin levels tend to be higher in fasted and re-fed AdChREBP KO mice, glycemia, free fatty acids (FFA), TG and cholesterol levels are similar in both genotypes in ad-lib-fed, fasted and re-fed states (Fig S2E–I). Serum adiponectin, leptin and retinol binding protein 4 levels are also similar between genotypes (Fig S2J–L).
Similar to fasted and re-fed insulin levels (Fig S2F), glucose-stimulated insulin secretion (GSIS) tends to be higher during early time points of GTT in AdChREBP KO mice (Fig 2J). In addition, FFA levels are higher at 3min and tend to be higher at 15min after glucose administration in AdChREBP KO mice (Fig 2K) suggesting resistance to insulin suppression of lipolysis. Moreover, glycerol secretion from AT explants harvested from AdChREBP KO mice 6h after food removal is higher under basal and β-adrenergic receptor-stimulated states indicating increased lipolysis (Fig 2L). Glycerol secretion is similarly suppressed after prolonged (3 hr) incubation with increasing insulin doses in both genotypes (Figure 2L) indicating that longer incubation can overcome this resistance, as is also seen at later time points of the GTT. FFA levels and glycerol turnover at the end of the hyperinsulinemic clamp are also similarly decreased in both genotypes (Fig S2M–N). These data suggest that with a physiological rise in insulin levels, such as during a GTT, AdChREBP KO mice demonstrate an early and transient resistance to the anti-lipolytic effects of insulin.
We next assessed insulin-stimulated phosphorylation of IRY1150/1151, IRS1Y608, AktT308 and AktS473 in WAT, BAT, liver and muscle (Figure 2M, S3). IRY1150/1151 phosphorylation is higher in insulin-treated AdChREBP KO mice in BAT, but not WAT. There is no genotypic difference in the phosphorylation of downstream intermediates in WAT or BAT. In muscle and liver, AktS473 phosphorylation, but not upstream intermediates, is lower in insulin-stimulated AdChREBP KO than ChREBPfl/fl mice. However, phosphorylation of downstream Akt targets, such as GSK3βS9 or S6RPS235/236 is not impaired in these tissues (Fig S3), suggesting no pervasive defects in insulin signaling in these tissues.
Many insulin resistant states are associated with WAT inflammation. Compared to ChREBPfl/fl mice, PG WAT total macrophage (ATM) number is higher in AdChREBP KO mice (Fig 2N, panel 1). This is associated with higher numbers of both CD11c+ pro-inflammatory M1 ATMs and CD206+ anti-inflammatory M2 ATMs (Fig 2N, panel 2). Moreover, number of ATMs expressing pro-inflammatory cytokines, like tumor necrosis factor-α (TNFα) and interleukin-1β (IL-1β), are higher in AdChREBP KO than ChREBPfl/fl mice (Fig 2N, panels 3–4). Thus, loss of adipose-ChREBP in lean mice results in systemic insulin resistance in multiple tissues and increased WAT inflammation without altering body weight or adiposity.
Adipose-ChREBP regulates PAHSA levels in WAT
Loss of ChREBP may alter fatty acid composition in WAT thereby contributing to insulin resistance in AdChREBP KO. AdChREBP KO mice have lower abundance of long chain fatty acids, myristic acid (C14:0), palmitic acid (C16:0), and palmitoleic acid (C16:1), but not stearic acid (C18:0), oleic acid (C18:1) and arachidonic acid (C20:4) (Fig 3A, left). Δ9 desaturation index and C16 elongation index, indicative of SCD1 and elongase activity respectively, are associated with insulin sensitivity in humans and mice (Benhamed et al., 2012; Rhee et al., 2011). These parameters are not decreased in AdChREBP KO mice (Fig 3A, right).
Figure 3. Loss of adipose-ChREBP lowers WAT PAHSA levels.

(A) Relative abundance of fatty acids in SQ WAT (left). Δ9 desaturation index and C16 elongation index (right) (n=7/group).
Levels of total PAHSAs (B) and individual PAHSA isomers (C) in SQ WAT (n=3/group except n=2 for 9-PAHSA levels in ChREBPfl/fl mice).
Data are mean±SEM. 16 week-old chow-fed female ChREBPfl/fl and AdChREBP KO mice were used. *p<0.05 vs. ChREBPfl/fl
In contrast, total PAHSA levels are >50% lower in SQ WAT of AdChREBP KO mice (Fig 3B) Moreover, all 8 PAHSA isomers tend to be lower compared to ChREBPfl/fl mice, reaching statistical significance for 13/12, 11, 9 and 5 -PAHSA isomers (Fig 3C). Thus, it is likely that absence of adipose-ChREBP causes insulin resistance, at least in part, by lowering WAT PAHSA levels.
Decreased adipose-ChREBP causes insulin resistance even in the obese state
HFD feeding down-regulates ChREBP and DNL in WAT (Herman et al., 2012). Thus, we assessed if loss of adipose-ChREBP has an additive effect on insulin resistance with HFD. chrebptotal mRNA is >90% lower and chrebpβ mRNA tends to be lower in WAT of HFD-fed AdChREBP KO vs. ChREBPfl/fl mice with similar expression in liver (Fig 4A). HFD feeding increases body weight and adiposity similarly in female AdChREBP KO and ChREBPfl/fl mice (Fig 4B–C). Similar to ad lib-fed lean mice, DNL from all substrates or glucose is not different in PG and SQ WAT, or liver of ad lib HFD-fed AdChREBP KO and ChREBPfl/fl mice (Fig 4D–E). However, in BAT, which has >30 fold higher DNL rates than WAT, DNL from all substrates is 75% lower and DNL from glucose is 90% lower in HFD-fed AdChREBP KO mice (Fig 4D–E). Liver TGs which are higher in HFD-fed mice than lean mice are similar in HFD-fed ChREBPfl/fl and AdChREBP KO mice (Fig 4G). Serum insulin, FFA, TG and adiponectin levels are also similar in HFD-fed AdChREBP KO and ChREBPfl/fl mice (Fig 4H–K). FGF21 is a ChREBP target gene and its expression in WAT is lower in chow-fed AdChREBP KO mice (Fig 1B). However, serum and WAT FGF21 levels, though higher in obese vs. lean mice, are similar between genotypes on both diets (Fig S4A, panel 1–3).
Figure 4. ChREBP deletion in adipocytes results in insulin resistance even in the obese state.

Female mice were used for all experiments. (A) ChREBP expression in SQ WAT and liver of 16 week HFD-fed mice (n=5–6/group).
Body weight (B) and fat mass (C) (n=26–27/group) with HFD.
Ad lib-fed DNL from all substrates (D) and glucose (E) in HFD-fed mice (n=6/group).
(F) Terminal wet tissue weight after 16 weeks of HFD (n=5–6/group).
(G) Liver TG content after 8 weeks of HFD (n=5/group). Chow-fed mice (n=2) were used for comparison. #p<0.05 vs. chow,
Ad lib-fed serum insulin (H), FFA (I), TG (J) and adiponectin (AdipoN) (K) levels after 16 week of HFD.
ITT (0.5U/kg, i.p) (L) and GTT (2g/kg, i.p) (M) after 16 weeks of HFD.
n=13–14/group for H–M
(N) Insulin signaling (1U/kg, 15min) after 20 weeks of HFD. (n=3–7/group). #p< 0.05 (Two-Way ANOVA), @p< 0.05 (t-test) vs. saline.
(O) Numbers of total, and pro-inflammatory (M1) and anti-inflammatory (M2) ATMs in PG WAT measured by flow cytometry after 16–20 weeks of HFD (n=5/group).
Data are mean±SEM. *p<0.05 vs. ChREBPfl/fl, same condition; (also see Fig S4)
HFD-fed AdChREBP KO mice are more insulin resistant, but not more glucose intolerant, than ChREBPfl/fl mice (Fig 4L–M). In PG WAT, insulin-stimulated phosphorylation of AktT308, but not AktS473, is lower in HFD-fed AdChREBP KO mice (Fig 4N, S4B). This does not impair insulin-stimulated glucose transport in adipocytes isolated from HFD-fed AdChREBP KO mice (see below). Insulin-stimulated AktS473 phosphorylation in liver and muscle is not different between the genotypes on HFD (Fig 4N, S4B). AktT308 phosphorylation could not be detected in these tissues. Similar to chow fed-AdChREBP KO mice, HFD-fed AdChREBP KO mice also have higher WAT inflammation with higher numbers of total and CD206+ M2 ATMs (Fig 4O). In sum, decreased adipose-ChREBP increases insulin resistance even in mice on HFD, independent of changes in body weight or adiposity.
Lower insulin-stimulated glucose transport in adipocytes lacking ChREBP is cell autonomous
Primary PG WAT adipocytes from female chow-fed AdChREBP KO mice have markedly reduced glucose transport over an insulin dose range (Fig 5A). This defect persisted in adipocytes from 6–40 week-old mice. The effective dose50, the insulin concentration eliciting half-maximal glucose transport, is not different (Figure S5A). Consistent with that, the dose response expressed as a percentage of maximal glucose uptake is not different between genotypes (Fig S5A). This suggests that the lower glucose transport in AdChREBP KO adipocytes does not result from impaired insulin signaling which would shift the dose-response curve to the right. This agrees with the signaling results in WAT of chow-fed mice (Fig 2M, S3). Primary adipocytes from young chow-fed male AdChREBP KO mice and female whole-body ChREBP KO mice also demonstrate similar defects in insulin-stimulated glucose transport (Fig S5B–C). HFD feeding causes a reduction in insulin-stimulated glucose transport in adipocytes from ChREBPfl/fl and AdChREBP KO mice compared to chow-fed mice. However, despite lower insulin-stimulated AktT308 phosphorylation in WAT of HFD-fed AdChREBP KO mice (Fig 4N, S4B), there is no additional decrease in glucose transport in HFD-fed AdChREBP KO mice compared to HFD-fed ChREBPfl/fl mice (Fig S5D).
Figure 5. Absence of ChREBP in adipocytes impairs insulin-stimulated glucose transport cell autonomously.

(A) Glucose transport in primary adipocytes isolated from 16 week-old chow-fed female mice (n=7–8/group).
Adipocyte number (B) and size (C) in PG and SQ WAT of female mice (n=17–25/group).
(D) Expression of glucose transporters (Gluts) in SQ WAT of chow-fed mice.
(E) Glut4 protein content in total cellular membranes from PG WAT.
(D–E) Data are fold change over ChREBPfl/fl (n=5–9/group).
(F) Expression of chrebptot (n=6–7/group) (left) and chrebpβ (n=2–6/group) (right) during differentiation of SVF-derived adipocytes. Data are fold change over Day 0 control (ChREBPfl/fl). Expression of differentiation markers (G) and lipogenic genes (H) in Day 7 differentiated SVF-derived adipocytes. Data are fold change over preadipocytes (G) or control (H) (n=8/group).
(I) Insulin-stimulated glucose transport in SVF-derived adipocytes. Data are normalized to protein concentration (n=3 experiments).
(J) Insulin-stimulated glucose transport in 3T3L1 adipocytes with scrambled (control) or ChREBP shRNA (ChREBP KD) after pre-incubation with 9-PAHSA (20μM, overnight). Data are normalized to protein concentration (n=6/group).
Data are mean±SEM. mRNA was normalized to tbp, and protein to p85. *p<0.05 vs. ChREBPfl/fl (A–E) or control (F–J), same condition; #p<0.05 vs. no insulin (I) or no 9-PAHSA (J), same genotype. (also see Fig S5)
Reduced glucose transport in adipocytes from chow-fed AdChREBP KO mice is not due to increased adipocyte size or lower adipocyte number in WAT, both of which are associated with insulin resistance (Roberts et al., 2009; Shepherd et al., 1993). In fact, while adipocyte number is similar in PG and SQ WAT of ChREBPfl/fl and AdChREBP KO mice, adipocytes in PG, but not SQ, WAT are 11% smaller in AdChREBP KO mice (Fig 5B–C). glut1 and glut4 expression are similar in SQ WAT of chow-fed ChREBPfl/fl and AdChREBP KO mice (Fig 5D). Further, Glut4 protein levels in PG WAT are similar in ChREBPfl/fl and AdChREBP KO mice on both chow and HFD (Fig 5E). Together these data suggest that decreased insulin-stimulated adipocyte glucose transport in chow-fed AdChREBP KO mice is not mediated by altered adipocyte morphology or decreased Glut4 protein levels.
To determine if the glucose transport defect in AdChREBP KO adipocytes is cell autonomous, SQ WAT stromavascular fraction (SVF) preadipocytes were harvested and differentiated into adipocytes in vitro. Differentiation induces chrebptotal by 930 fold and chrebpβ by 115 fold in control (ChREBPfl/fl) SVF-derived adipocytes but not in ChREBP KO adipocytes (Fig 5F). Nevertheless, day 7 differentiated ChREBP KO adipocytes have comparable or increased induction of differentiation markers such as adipocyte protein 2 (aP2), CCAAT-enhancer binding proteins (cebpα, cebpβ, and cebpδ), peroxisome proliferator-activated receptor (pparγ1 and pparγ2), adiponectin (adipoq), adipose tissue triglyceride lipase (atgl), lipoprotein lipase (lpl), glut1 and glut4 compared to control adipocytes (Fig 5G). spot14, but not other lipogenic genes, is decreased in ChREBP KO adipocytes (Fig 5H). This could be due to a compensatory increase in srebp1 and srebp2 expression in ChREBP KO vs. control adipocytes (Fig 5H). The ChREBP KO and control adipocytes are also morphologically indistinguishable and have multilocular lipid droplets characteristic of differentiated adipocytes (Fig S5E).
Importantly, in SVF-derived adipocytes, loss of ChREBP results in reduced insulin-stimulated glucose transport (Fig 5I) similar to the defect in primary adipocytes from AdChREBP KO mice (Fig 5A). ChREBP is also induced with differentiation in 3T3L1 adipocytes; however at 10 fold lower levels than in SVF-derived adipocytes (Fig S5F). ChREBP knockdown in 3T3L1 adipocytes (Fig S5G) also decreases insulin-stimulated glucose transport (Fig 5J). Incubating these adipocytes with 9-PAHSA (20μM, overnight) completely rescues this glucose transport defect (Fig 5J). Thus absence of ChREBP decreases insulin-stimulated glucose transport cell autonomously, and this defect can be rescued by 9-PAHSA.
Impaired insulin-stimulated Glut4 translocation in AdChREBP KO adipocytes mediates their glucose transport defects
Similar to WAT, Glut4 levels are not decreased with ChREBP knockdown in adipocytes (p=0.17) (Fig 6A). Insulin-stimulated AktS473 and AS160T642 phosphorylation are comparable in ChREBP KO and control adipocytes (Fig 6B, S6A). Phosphorylation of another Akt substrate, GSK3βS9 is also not impaired in ChREBP KO adipocytes (Fig S6A), indicating intact insulin signaling in ChREBP KO adipocytes. However, insulion-stimulated Glut4 translocation is reduced from ~4-fold in control adipocytes to only 2-fold in ChREBP KO adipocytes (Fig 6C).
Figure 6. Adipocytes lacking ChREBP have defects in insulin-stimulated Glut4 translocation.

(A) Quantitation of western blot analysis for Glut4 in 3T3L1 adipocytes with scrambled (Con) or ChREBP shRNA (KD). Glut4 levels are normalized to p85 and expressed as fold change over Control (n=5–8/group).
(B) Western blot analysis of insulin (10nM, 10min) signaling in control and ChREBP KO adipocytes (left). The ratio of phosphorylated/total protein is expressed as fold change over control/insulin (n=8–12/group).
(C) Representative images of Glut4 translocation using the HA-Glut4-GFP reporter assay (left). Surface:Total HA-Glut4-GFP was quantified under basal and insulin (1nM)-stimulated conditions (right).
Insulin (1nM)-stimulated Glut4 exocytosis (D), exocytosis rate constant (kex) (E), and effect of 9-PAHSA (9P) (20μM, 2h) on Glut4 exocytosis (F).
Data represented as a fold over control (D, F).
B–F were performed in SVF-derived adipocytes
C–F n=>50 cells from 2–3 combined experiments
(G) Insulin (1nM)-stimulated glucose transport in primary adipocytes isolated from chow-fed female mice. Cells were pre-incubated with DMSO or increasing concentrations of 9-PAHSA for 2.5h prior to insulin (1nM) stimulation (n=8–20/group).
D=DMSO (F–G) Data are mean±SEM. *p<0.05 vs. ChREBPfl/fl(control) same condition (B–E), ChREBPfl/fl DMSO insulin (F–G). #p<0.05 vs. no insulin/basal (B, C), DMSO+insulin (F, G), same genotype. (also see Fig S6)
Glut4 constantly cycles between intracellular compartments and the plasma membrane, and insulin predominantly drives Glut4 exocytosis (Zeigerer et al., 2002). ChREBP KO adipocytes have slower insulin-stimulated Glut4 exocytosis at 15min after insulin stimulation (Fig 6D). Moreover, insulin-stimulated Glut4 exocytosis over a time-course spanning 60min is also slower in ChREBP KO adipocytes with a half-time (t1/2) of ~7.35min in ChREBPfl/fl and ~32.71min in ChREBP KO adipocytes (Fig S6). Further, the exocytosis rate constant, a function of t1/2, is lower in ChREBP KO adipocytes, indicating slower Glut4 exocytosis (Fig 6E). Notably, similar to the rescue of glucose transport in adipocytes with ChREBP knockdown (Fig 5J), 9-PAHSA also normalizes the reduced Glut4 exocytosis in ChREBP KO adipocytes (Fig 6F).
Further, in mature adipocytes isolated from AdChREBP KO mice, 9-PAHSA treatment restores insulin-stimulated glucose transport to levels seen in control adipocytes (Fig 6G, black stippled bars to solid grey bar) and also enhances glucose transport in ChREBPfl/fl adipocytes (Fig 6G left). Thus, loss of ChREBP in adipocytes impairs insulin-stimulated Glut4 translocation, potentially by slowing Glut4 exocytosis. Importantly, 9-PAHSA can rescue both reduced insulin-stimulated Glut4 exocytosis and glucose transport in ChREBP KO adipocytes.
9-PAHSA supplementation restores insulin sensitivity and reverses WAT inflammation in AdChREBP KO mice
9-PAHSA is the most abundant PAHSA isomer in WAT and serum. Its levels are reduced by 64% in SQ WAT (Fig 3C) and 37% in serum (Fig 7A) of AdChREBP KO mice Treating chow-fed ChREBPfl/fl and AdChREBP KO mice with 9-PAHSA (oral gavage) for 26 days completely normalizes serum 9-PAHSA levels in AdChREBP KO mice with marginal effects in ChREBPfl/fl mice (Fig 7A). In SQ WAT, 9-PAHSA levels are increased 2 fold in AdChREBP KO mice but do not reach ChREBPfl/fl levels (Fig 7B, left). 5-PAHSA levels are lower in AdChREBP KO WAT as expected, and are not affected by chronic 9-PAHSA treatment in either genotype (Fig 7B, right).
Figure 7. Restoring reduced PAHSA levels in AdChREBP KO mice reverses their insulin resistance.

7–9 week old male mice were treated with vehicle (V) or 9-PAHSA (9P, 15mg/kg/d, oral gavage) for 26 days. Serum (A) and WAT (B) PAHSA levels (n=4–5/group).
Body weight (C), fat mass (D), and ad lib-fed serum insulin (E), and TG (F) levels after 26 days of treatment.
(G) ITT (0.5U/kg, i.p.) after 14 days of treatment.
(C–G) n=7–10/group
(H) Numbers of total, TNFα+ and IL-1β+ ATMs in PG WAT of AdChREBP KO mice after 26 days of treatment (n=5/group).
Data are mean±SEM. *p< 0.05 vs. ChREBPfl/fl, same treatment; #p< 0.05 vs. vehicle. (also see Fig S7)
Chronic 9-PAHSA treatment does not alter body weight (Fig 7C), adiposity (Fig 7D), or food intake (data not shown) in either genotype. 26 days of 9-PAHSA treatment also does not alter ad lib-fed insulin levels in either genotype but lowers TGs only in AdChREBP KO mice (Fig 7E, F). 9-PAHSA treatment completely reverses insulin resistance in AdChREBP KO mice without affecting insulin sensitivity in ChREBPfl/fl mice (Fig 7G). Glucose tolerance is not altered in either genotype when the last 9-PAHSA dose was administered 14h before GTT (Fig S7A).
AdChREBP KO mice have enhanced WAT inflammation (Fig 2N). Chronic 9-PAHSA treatment reduces the number of total ATMs by 95%, TNFα+ ATMs by 81%, and IL-1β+ ATMs by 92% in PG WAT of AdChREBP KO mice (Fig 7H). 9-PAHSA treatment also has modest anti-inflammatory effects in ChREBPfl/fl mice, and reduces total numbers of ATMs with no effect on numbers of TNFα+ and IL1β+ ATMs (Fig S7B).
Thus chronic 9-PAHSA treatment raises WAT 9-PAHSA levels and normalizes serum 9-PAHSA levels in AdChREBP KO mice, and completely recues their insulin resistance potentially by reducing WAT inflammation which could alter insulin sensitivity in other tissues and/or by directly increasing insulin-stimulated adipocyte glucose transport (Fig S7C).
Discussion
Insulin resistance is associated with lower expression of ChREBP and lipogenic enzymes in WAT of humans and rodents (Eissing et al., 2013; Herman et al., 2012; Kursawe et al., 2013; Roberts et al., 2009). Here we demonstrate that ChREBP deletion specifically in adipocytes is sufficient to cause insulin resistance in both lean and obese mice. This agrees with data showing a strong correlation between WAT ChREBP expression and insulin sensitivity in humans over a range of BMI (Herman et al., 2012), and suggests that lower WAT ChREBP expression may predict insulin resistance even in obesity. Deletion of adipose-ChREBP abrogates the induction of WAT DNL in response to sucrose re-feeding demonstrating the dominance of ChREBP over other WAT lipogenic transcription factors. The abundance of several PAHSA isomers is lower in WAT of AdChREBP KO mice, and 9-PAHSA supplementation completely rescues their insulin resistance. Thus, our findings demonstrate that reduction in adipose-ChREBP is sufficient to cause insulin resistance, and adipose-ChREBP regulates insulin sensitivity, at least in part, by driving glucose flux through specific lipogenic pathways involved in the production of metabolically beneficial lipids such as PAHSAs.
Chow-fed AdChREBP KO mice are insulin resistant with impaired insulin action in liver, muscle and WAT. Our study identifies several potential mechanisms by which loss of adipose-ChREBP causes insulin resistance in these tissues. 1) WAT inflammation is increased in AdChREBP KO mice on both chow and HFD which could contribute to their systemic insulin resistance. 2) Serum 9-PAHSA levels are lower in AdChREBP KO mice, and normalizing these levels completely rescues their insulin resistance suggesting reduced PAHSA levels play a role (Fig S7C). 3) Lipolysis is increased in AdChREBP KO mice, and this may contribute to their hepatic insulin resistance since dysregulation of WAT lipolysis can lead to increased hepatic gluconeogenesis by increasing hepatic acetyl CoA content, which stimulates pyruvate carboxylase activity, and by increased conversion of glycerol to glucose by a substrate push mechanism (Perry et al., 2015). Evidence supporting this is higher glycerol secretion in WAT explants of AdChREBP KO mice under unstimulated and β-adrenergic-stimulated states (Fig 2L). Moreover, under physiological increases in insulin levels during a GTT (Fig 2K), AdChREBP KO mice demonstrate resistance to the anti-lipolytic effects of insulin. Although the impairment is transient with a GTT, it could last longer with a meal. These mechanisms may not be mutually exclusive, as increased WAT inflammation may promote hepatic insulin resistance by stimulating WAT lipolysis (Chawla et al., 2011; Perry et al., 2015). Thus, loss of adipose-ChREBP may cause insulin resistance by multiple mechanisms.
Surprisingly, AdChREBP KO is associated with a cell autonomous reduction in insulin-stimulated adipocyte glucose transport. This defect is not secondary to systemic insulin resistance in AdChREBP KO mice since loss of ChREBP in cultured cells (SVF-derived and 3T3L1 adipocytes) also results in reduced glucose transport. The reduced insulin-stimulated glucose transport in adipocytes lacking ChREBP is mediated by impaired Glut4 translocation, and not by lower Glut4 protein levels or impaired insulin-stimulated Akt or AS160 phosphorylation. Abnormalities in the cellular machinery that regulates Glut4 trafficking may also play a role. This is supported by studies showing that disruption of Glut4 trafficking in adipocytes by deleting Rab10 (Ras-related protein 10) also reduces glucose transport without impairing insulin signaling or Glut4 content (Vazirani et al., 2016). Indeed, loss of ChREBP in adipocytes delays insulin-stimulated Glut4 exocytosis. This could result from decreased DNL which may affect the synthesis of structural lipids (such as sphingolipids and phospholipids) that are incorporated into vesicles and membranes. Moreover, while lipidomic analysis of whole tissue did not reveal large changes in fatty acid composition, we cannot exclude potential changes in fatty acid composition of adipocyte plasma membrane or Glut4-containing vesicles which could impact Glut4 trafficking. Reduced DNL may also affect lipid modification of proteins including Glut4 and associated vesicle proteins, which can affect Glut4 translocation (Ren et al., 2013; Ren et al., 2015). Decreased ChREBP/DNL in adipocytes may also result in lower levels of signaling lipids that could impair Glut4 trafficking as demonstrated by rescue of the glucose transport defect in AdChREBP KO adipocytes with PAHSAs. PAHSAs exert their biological activity by activating G protein-coupled receptors (GPCRs) (Lee et al., 2016; Yore et al., 2014). In particular, PAHSA-induced increase in insulin-stimulated glucose transport is mediated by GPR120. Thus, decreased ChREBP/DNL in adipocytes may result in lower levels of structural and/or signaling lipids that could impair Glut4 trafficking.
Insulin-stimulated AktS473 phosphorylation is lower in muscle and liver of chow-fed AdChREBP KO mice, but we do not observe defects in phosphorylation of some downstream Akt substrates. Further, insulin-stimulated AktS473 phosphorylation is not impaired in WAT of AdChREBP KO mice, yet 2DOG uptake during clamps is lower in WAT of AdChREBP KO mice (Fig 2I). This suggests that there is no generalized defect in insulin signaling in tissues of the AdChREBP KO mice. It is also conceivable that a permissive amount of insulin signaling may be sufficient for the full biological effects of insulin. This concept is supported by literature showing a lack of linearity between insulin signaling and insulin effects on glucose transport (Gonzalez et al., 2011; Kajno et al., 2015; Tan et al., 2015) and other biological processes (Guilherme et al., 2017; Kajno et al., 2015). Consistent with this, we observe impaired insulin-stimulated AktT308 phosphorylation in WAT of HFD-fed AdChREBP KO vs. ChREBPfl/fl mice (Fig 4N, grey vs. black bars) without impairments in insulin-stimulated glucose transport in adipocytes isolated from HFD-fed AdChREBP KO mice (Fig S5D, white vs. black bars). Thus, our studies clearly show insulin resistance in muscle, liver and fat from AdChREBP KO mice in vivo and in vitro in multiple functional assays, and this is unlikely to be from a defect in insulin signaling.
Our previous study showed that modulating glucose flux into WAT (by altering Glut4 levels) regulates ChREBP (Herman et al., 2012). The current study shows that modulating ChREBP regulates glucose transport. Most insulin-resistant states (obesity, T2D, pre-diabetes, and animal models of obesity-dependent insulin resistance) are associated with decreased adipose-Glut4 levels (Shepherd and Kahn, 1999). This plays a major role in the reduced glucose transport in adipocytes in these states. In this study, we don’t see a reduction in Glut4 protein but we see impaired Glut4 trafficking. In fact in insulin-resistant humans and rodents, insulin-stimulated Glut4 translocation is also impaired in adipocytes (Garvey et al., 1993; Karnieli et al., 1981). Thus, our data suggest the existence of a novel feedback loop between glucose transport and ChREBP in adipocytes which appears to be critical for metabolic homeostasis. Reduced glucose transport in WAT of insulin resistant people is initiated by down-regulation of Glut4 which results in a reduction of ChREBP-driven DNL. Our current results suggest that this may further exacerbate the glucose transport defect by impairing Glut4 trafficking. Determining how to increase Glut4 translocation even in the setting of reduced Glut4 levels could be beneficial in people with pre-diabetes or overt diabetes.
Hepatic DNL and the expression of some lipogenic enzymes (fas, acly) tend to be higher in AdChREBP KO mice although expression of lipogenic transcription factors and other targets of these factors is not increased. Hepatic TG content is not increased but lower, in AdChREBP KO livers. TG secretion also appears to be normal in AdChREBP KO mice as serum TGs are not elevated and expression of other lipogenic enzymes in liver is similar in AdChREBP KO and ChREBPfl/fl mice. Thus, our data indicate that net hepatic TG synthesis is not increased in livers of AdChREBP KO mice and therefore, increased hepatic DNL most likely does not contribute to the systemic phenotype of the mice.
Levels of several PAHSA isomers are reduced in WAT of AdChREBP KO mice. This is similar to our observations in whole-body ChREBP KO mice (Yore et al., 2014), and further supports our conclusion that ChREBP directly regulates biosynthetic and/or degradative pathways that maintain WAT PAHSA levels. Strikingly, chronic 9-PAHSA treatment completely reverses insulin resistance and lowers ambient TG levels in young chow-fed AdChREBP KO mice without impacting body weight or adiposity. The lack 9-PAHSA effects on glucose tolerance in this study is probably because of the low dose that was administered and because it was given 14h before the OGTT. Our previous data showed striking acute (30min before OGTT) effects of a single, higher dose of PAHSAs on glucose tolerance which may be explained by the rapid increase in GLP1 and insulin secretion (Yore et al., 2014). 9-PAHSA treatment also markedly decreases WAT inflammation in AdChREBP KO mice, suggesting that lower PAHSA levels in AdChREBP KO WAT may induce WAT inflammation (Fig S7C). Treating adipocytes lacking ChREBP with 9-PAHSA also rescues their glucose transport defect, demonstrating direct effects of PAHSAs on AdChREBP KO adipocytes. Thus, ChREBP plays a major role in WAT in maintaining levels of PAHSAs, and potentially other FAHFA family members, and down-regulation of these lipids is deleterious to metabolic health (Fig S7C).
In summary, our study shows that ChREBP is the dominant transcription factor regulating DNL in adipose tissue, and that reduced adipose-ChREBP is sufficient to cause insulin resistance in adipocytes and systemically. Surprisingly, this is associated with impaired insulin-stimulated adipocyte glucose transport and Glut4 translocation, and increased WAT inflammation. Adipose and serum PAHSA levels are reduced in AdChREBP KO mice and 9-PAHSA supplementation completely reverses their WAT inflammation and insulin resistance. Since Glut4, ChREBP and PAHSAs are reduced in WAT of insulin-resistant people (Herman et al., 2012; Shepherd et al., 1993; Yore et al., 2014), our data suggest an exciting potential for PAHSAs to overcome Glut4 and ChREBP deficiency to treat insulin resistance and T2D.
Experimental Procedures
Animal studies and measurement of metabolic parameters
AdChREBP KO mice were generated by crossing ChREBPfl/fl mice, a gift from Dr. Jay Horton (U.T Southwestern Medical Center), to Adiponectin-Cre mice (Eguchi et al., 2011). All experimental procedures were in accordance with the Institutional Animal Care and Use Committee of Beth Israel Deaconess Medical Center. The mice had ad libitum access to water and either standard mouse chow (LabDiet), or high-fat (55% fat) diet (Harlan Laboratories).
In vivo lipogenesis
Ad lib-fed or sucrose re-fed mice received a bolus of 5mCi of [3H]-H2O (American Radiolabeled Chemicals) and 10μCi of [U-14C]-glucose (Perkin Elmer), and were sacrificed 1h later. Lipids were extracted from tissue samples and rates of incorporation of 3H and 14C tracers were calculated as described (Herman et al., 2012).
Glucose transport in isolated adipocytes
Primary adipocytes were isolated from PG WAT of mice and glucose transport was performed as published (Herman et al., 2012). For PAHSA studies primary adipocytes were pre-incubated with DMSO or 9-PAHSA for 2.5h.
9-PAHSA treatment studies
7–9 week-old male mice were gavaged daily with vehicle (50% PEG-400/0.5% Tween-80/49.5% saline) or 15mg/kg of 9-PAHSA between 6:30–7:30pm for 26 days. All in vivo studies were performed ~12–16h after last 9-PAHSA gavage.
Lipidomic analysis
Lipids were extracted from 80–100mg WAT tissue or 80–100μL serum, and targeted mass spectrometry (for PAHSA measurement) and untargeted lipidomic analysis (to determine relative fatty acid abundance) were performed and analyzed as described (Yore et al., 2014; Zhang et al., 2016).
In vitro studies
Glut4 translocation and exocytosis studies were performed as published (Blot and McGraw, 2008). Day 7 and later differentiated 3T3L1 adipocytes were treated with lentiviral particles containing ChREBP shRNA or scrambled shRNA (Clonetech). Experiments were performed 4 days later.
Statistics
Data are mean ± SEM. SigmaStat for Windows Version 3.5 was used for one-way or two-way ANOVA with Holm Sidak post-hoc test to determine statistical validity of the data. p≤0.05 was considered statistically significant.
Supplementary Material
Highlights.
Loss of ChREBP in adipocytes of mice causes insulin resistance in liver, muscle and fat.
Adipocytes lacking ChREBP have defects in glucose transport and Glut4 translocation.
ChREBP deletion in fat lowers abundance of palmitic acid hydroxy stearic acids (PAHSAs).
PAHSAs reverse insulin resistance and glucose transport defects with ChREBP loss in fat.
Acknowledgments
We thank Jay D. Horton for providing the ChREBPfl/fl mice and for helpful discussions; Evan D. Rosen for the adiponectin-Cre mice; David Wasserman and the Vanderbilt Mouse Metabolic Phenotyping Center (DK059637) for thoughtful discussion; Andrew T. Nelson and Dionicio Siegel for synthesizing 9-PAHSA; and Sanam Dharma, Junning Wang, Kerry Wellenstein, Juan Juan Zhao, Marlee Jackson and Peter Dwyer for technical assistance. Supported by grants from the NIH R01DK43051 and P30 DK57521 (B.B.K.); R01 DK098002 (B.B.K. and T.E.M.); R01 DK40936 and P30 DK059635 (G.I.S); a grant from the JPB foundation (B.B.K.).
Footnotes
Author contributions
A.V. and B.B.K. conceived of, designed, and interpreted experiments. A.V., P.A., O.D.P., and M.G. performed experiments. P.M.M.-V. designed, performed and interpreted the immunology experiments. A.S. directed the analysis and interpretation of lipidomic data, and chemical synthesis of 9-PAHSA. I.S. performed targeted mass spectrometry measurements of PAHSAs, and interpreted the data. A.V., J.W., R.V. and T.E.M. designed and performed Glut4 translocation and exocytosis assays. J.P.C, R.P, and G.I.S. designed, performed and interpreted hyperinsulinemic-euglycemic clamp studies. A.V. made the figures. B.B.K. and A.V. wrote the manuscript. T.E.M. edited the manuscript.
Publisher's Disclaimer: This is a PDF file of an unedited manuscript that has been accepted for publication. As a service to our customers we are providing this early version of the manuscript. The manuscript will undergo copyediting, typesetting, and review of the resulting proof before it is published in its final citable form. Please note that during the production process errors may be discovered which could affect the content, and all legal disclaimers that apply to the journal pertain.
References
- Abel ED, Peroni O, Kim JK, Kim YB, Boss O, Hadro E, Minnemann T, Shulman GI, Kahn BB. Adipose-selective targeting of the GLUT4 gene impairs insulin action in muscle and liver. Nature. 2001;409:729–733. doi: 10.1038/35055575. [DOI] [PubMed] [Google Scholar]
- Baraille F, Planchais J, Dentin R, Guilmeau S, Postic C. Integration of ChREBP-Mediated Glucose Sensing into Whole Body Metabolism. Physiology (Bethesda) 2015;30:428–437. doi: 10.1152/physiol.00016.2015. [DOI] [PubMed] [Google Scholar]
- Benhamed F, Denechaud PD, Lemoine M, Robichon C, Moldes M, Bertrand-Michel J, Ratziu V, Serfaty L, Housset C, Capeau J, et al. The lipogenic transcription factor ChREBP dissociates hepatic steatosis from insulin resistance in mice and humans. J Clin Invest. 2012;122:2176–2194. doi: 10.1172/JCI41636. [DOI] [PMC free article] [PubMed] [Google Scholar]
- Blot V, McGraw TE. Use of quantitative immunofluorescence microscopy to study intracellular trafficking: studies of the GLUT4 glucose transporter. Methods Mol Biol. 2008;457:347–366. doi: 10.1007/978-1-59745-261-8_26. [DOI] [PubMed] [Google Scholar]
- Bruss MD, Khambatta CF, Ruby MA, Aggarwal I, Hellerstein MK. Calorie restriction increases fatty acid synthesis and whole body fat oxidation rates. Am J Physiol Endocrinol Metab. 2010;298:E108–116. doi: 10.1152/ajpendo.00524.2009. [DOI] [PMC free article] [PubMed] [Google Scholar]
- Chawla A, Nguyen KD, Goh YP. Macrophage-mediated inflammation in metabolic disease. Nat Rev Immunol. 2011;11:738–749. doi: 10.1038/nri3071. [DOI] [PMC free article] [PubMed] [Google Scholar]
- Eguchi J, Wang X, Yu S, Kershaw EE, Chiu PC, Dushay J, Estall JL, Klein U, Maratos-Flier E, Rosen ED. Transcriptional control of adipose lipid handling by IRF4. Cell Metab. 2011;13:249–259. doi: 10.1016/j.cmet.2011.02.005. [DOI] [PMC free article] [PubMed] [Google Scholar]
- Eissing L, Scherer T, Todter K, Knippschild U, Greve JW, Buurman WA, Pinnschmidt HO, Rensen SS, Wolf AM, Bartelt A, et al. De novo lipogenesis in human fat and liver is linked to ChREBP-beta and metabolic health. Nat Commun. 2013;4:1528. doi: 10.1038/ncomms2537. [DOI] [PMC free article] [PubMed] [Google Scholar]
- Garvey WT, Maianu L, Zhu JH, Hancock JA, Golichowski AM. Multiple defects in the adipocyte glucose transport system cause cellular insulin resistance in gestational diabetes. Heterogeneity in the number and a novel abnormality in subcellular localization of GLUT4 glucose transporters. Diabetes. 1993;42:1773–1785. doi: 10.2337/diab.42.12.1773. [DOI] [PubMed] [Google Scholar]
- Gonzalez E, Flier E, Molle D, Accili D, McGraw TE. Hyperinsulinemia leads to uncoupled insulin regulation of the GLUT4 glucose transporter and the FoxO1 transcription factor. Proc Natl Acad Sci U S A. 2011;108:10162–10167. doi: 10.1073/pnas.1019268108. [DOI] [PMC free article] [PubMed] [Google Scholar]
- Guilherme A, Pedersen DJ, Henchey E, Henriques FS, Danai LV, Shen Y, Yenilmez B, Jung D, Kim JK, Lodhi IJ, et al. Adipocyte lipid synthesis coupled to neuronal control of thermogenic programming. Molecular Metabolism. 2017 doi: 10.1016/j.molmet.2017.05.012. (in press) [DOI] [PMC free article] [PubMed] [Google Scholar]
- Herman MA, Peroni OD, Villoria J, Schon MR, Abumrad NA, Bluher M, Klein S, Kahn BB. A novel ChREBP isoform in adipose tissue regulates systemic glucose metabolism. Nature. 2012;484:333–338. doi: 10.1038/nature10986. [DOI] [PMC free article] [PubMed] [Google Scholar]
- Hughey CC, Wasserman DH, Lee-Young RS, Lantier L. Approach to assessing determinants of glucose homeostasis in the conscious mouse. Mamm Genome. 2014;25:522–538. doi: 10.1007/s00335-014-9533-z. [DOI] [PMC free article] [PubMed] [Google Scholar]
- Iizuka K, Bruick RK, Liang G, Horton JD, Uyeda K. Deficiency of carbohydrate response element-binding protein (ChREBP) reduces lipogenesis as well as glycolysis. Proc Natl Acad Sci U S A. 2004;101:7281–7286. doi: 10.1073/pnas.0401516101. [DOI] [PMC free article] [PubMed] [Google Scholar]
- Kajno E, McGraw TE, Gonzalez E. Development of a new model system to dissect isoform specific Akt signalling in adipocytes. Biochem J. 2015;468:425–434. doi: 10.1042/BJ20150191. [DOI] [PMC free article] [PubMed] [Google Scholar]
- Karnieli E, Hissin PJ, Simpson IA, Salans LB, Cushman SW. A possible mechanism of insulin resistance in the rat adipose cell in streptozotocin-induced diabetes mellitus. Depletion of intracellular glucose transport systems. J Clin Invest. 1981;68:811–814. doi: 10.1172/JCI110318. [DOI] [PMC free article] [PubMed] [Google Scholar]
- Kursawe R, Caprio S, Giannini C, Narayan D, Lin A, D’Adamo E, Shaw M, Pierpont B, Cushman SW, Shulman GI. Decreased transcription of ChREBP-alpha/beta isoforms in abdominal subcutaneous adipose tissue of obese adolescents with prediabetes or early type 2 diabetes: associations with insulin resistance and hyperglycemia. Diabetes. 2013;62:837–844. doi: 10.2337/db12-0889. [DOI] [PMC free article] [PubMed] [Google Scholar]
- Lee J, Moraes-Vieira PM, Castoldi A, Aryal P, Yee EU, Vickers C, Parnas O, Donaldson CJ, Saghatelian A, Kahn BB. Branched Fatty Acid Esters of Hydroxy Fatty Acids (FAHFAs) Protect against Colitis by Regulating Gut Innate and Adaptive Immune Responses. J Biol Chem. 2016;291:22207–22217. doi: 10.1074/jbc.M115.703835. [DOI] [PMC free article] [PubMed] [Google Scholar]
- Ma L, Robinson LN, Towle HC. ChREBP*Mlx is the principal mediator of glucose-induced gene expression in the liver. J Biol Chem. 2006;281:28721–28730. doi: 10.1074/jbc.M601576200. [DOI] [PubMed] [Google Scholar]
- Mottillo EP, Balasubramanian P, Lee YH, Weng C, Kershaw EE, Granneman JG. Coupling of lipolysis and de novo lipogenesis in brown, beige, and white adipose tissues during chronic beta3-adrenergic receptor activation. J Lipid Res. 2014;55:2276–2286. doi: 10.1194/jlr.M050005. [DOI] [PMC free article] [PubMed] [Google Scholar]
- Perry RJ, Camporez JP, Kursawe R, Titchenell PM, Zhang D, Perry CJ, Jurczak MJ, Abudukadier A, Han MS, Zhang XM, et al. Hepatic acetyl CoA links adipose tissue inflammation to hepatic insulin resistance and type 2 diabetes. Cell. 2015;160:745–758. doi: 10.1016/j.cell.2015.01.012. [DOI] [PMC free article] [PubMed] [Google Scholar]
- Ren W, Jhala US, Du K. Proteomic analysis of protein palmitoylation in adipocytes. Adipocyte. 2013;2:17–28. doi: 10.4161/adip.22117. [DOI] [PMC free article] [PubMed] [Google Scholar]
- Ren W, Sun Y, Du K. Glut4 palmitoylation at Cys223 plays a critical role in Glut4 membrane trafficking. Biochem Biophys Res Commun. 2015;460:709–714. doi: 10.1016/j.bbrc.2015.03.094. [DOI] [PMC free article] [PubMed] [Google Scholar]
- Rhee EP, Cheng S, Larson MG, Walford GA, Lewis GD, McCabe E, Yang E, Farrell L, Fox CS, O’Donnell CJ, et al. Lipid profiling identifies a triacylglycerol signature of insulin resistance and improves diabetes prediction in humans. J Clin Invest. 2011;121:1402–1411. doi: 10.1172/JCI44442. [DOI] [PMC free article] [PubMed] [Google Scholar]
- Roberts R, Hodson L, Dennis AL, Neville MJ, Humphreys SM, Harnden KE, Micklem KJ, Frayn KN. Markers of de novo lipogenesis in adipose tissue: associations with small adipocytes and insulin sensitivity in humans. Diabetologia. 2009;52:882–890. doi: 10.1007/s00125-009-1300-4. [DOI] [PubMed] [Google Scholar]
- Shepherd PR, Gnudi L, Tozzo E, Yang H, Leach F, Kahn BB. Adipose cell hyperplasia and enhanced glucose disposal in transgenic mice overexpressing GLUT4 selectively in adipose tissue. J Biol Chem. 1993;268:22243–22246. [PubMed] [Google Scholar]
- Shepherd PR, Kahn BB. Glucose transporters and insulin action--implications for insulin resistance and diabetes mellitus. N Engl J Med. 1999;341:248–257. doi: 10.1056/NEJM199907223410406. [DOI] [PubMed] [Google Scholar]
- Tan SX, Fisher-Wellman KH, Fazakerley DJ, Ng Y, Pant H, Li J, Meoli CC, Coster AC, Stockli J, James DE. Selective insulin resistance in adipocytes. J Biol Chem. 2015;290:11337–11348. doi: 10.1074/jbc.M114.623686. [DOI] [PMC free article] [PubMed] [Google Scholar]
- Tozzo E, Shepherd PR, Gnudi L, Kahn BB. Transgenic GLUT-4 overexpression in fat enhances glucose metabolism: preferential effect on fatty acid synthesis. Am J Physiol. 1995;268:E956–964. doi: 10.1152/ajpendo.1995.268.5.E956. [DOI] [PubMed] [Google Scholar]
- Vazirani RP, Verma A, Sadacca LA, Buckman MS, Picatoste B, Beg M, Torsitano C, Bruno JH, Patel RT, Simonyte K, et al. Disruption of Adipose Rab10-Dependent Insulin Signaling Causes Hepatic Insulin Resistance. Diabetes. 2016;65:1577–1589. doi: 10.2337/db15-1128. [DOI] [PMC free article] [PubMed] [Google Scholar]
- Yore MM, Syed I, Moraes-Vieira PM, Zhang T, Herman MA, Homan EA, Patel RT, Lee J, Chen S, Peroni OD, et al. Discovery of a class of endogenous mammalian lipids with anti-diabetic and anti-inflammatory effects. Cell. 2014;159:318–332. doi: 10.1016/j.cell.2014.09.035. [DOI] [PMC free article] [PubMed] [Google Scholar]
- Zeigerer A, Lampson MA, Karylowski O, Sabatini DD, Adesnik M, Ren M, McGraw TE. GLUT4 retention in adipocytes requires two intracellular insulin-regulated transport steps. Mol Biol Cell. 2002;13:2421–2435. doi: 10.1091/mbc.E02-02-0071. [DOI] [PMC free article] [PubMed] [Google Scholar]
- Zhang T, Chen S, Syed I, Stahlman M, Kolar MJ, Homan EA, Chu Q, Smith U, Boren J, Kahn BB, et al. A LC-MS-based workflow for measurement of branched fatty acid esters of hydroxy fatty acids. Nat Protoc. 2016;11:747–763. doi: 10.1038/nprot.2016.040. [DOI] [PMC free article] [PubMed] [Google Scholar]
Associated Data
This section collects any data citations, data availability statements, or supplementary materials included in this article.