

Abstract
The purpose of the present study was to evaluate an intervention to prevent weight gain among households (HHs) in the community. Ninety HHs were randomized to intervention or control group for 1 year. Intervention consisted of six face-to-face group sessions, placement of a television (TV) locking device on all home TVs, and home-based intervention activities. Measures were collected in person at baseline and 1 year. Weight, height, eating behaviors, physical activity (PA), and TV viewing were measured among HH members ages ≥12 years. Follow-up rate at 1 year was 96%. No significant intervention effects were observed for change in HH BMI-z score. Intervention HHs significantly reduced TV viewing, snacks/sweets intake, and dollars per person spent eating out, and increased (adults only) PA and self-weighing frequency compared with control HHs. A 1 year obesity prevention intervention targeting entire HHs was effective in reducing TV viewing, snack/sweets intake and eating out purchases. Innovative methods are needed to strengthen the home food environment intervention component. Longer intervention durations also need to be evaluated.
INTRODUCTION
Overweight is a serious public health epidemic that affects the majority of US adults and a growing proportion of youth (1,2). Obesity prevention is the focus of national and international prevention initiatives and has received a great deal of attention because of the scope, severity, and seriousness of the epidemic (3). Effective primary prevention programs are urgently needed to address this public health issue (4).
The important role of parents and the home environment recently have been highlighted in child obesity prevention efforts (5–7). Television (TV) viewing, low physical activity (PA), large portion sizes, energy-dense prepackaged foods, sugar-sweetened beverages, and restaurant foods are important influences on weight-related behaviors and the development of obesity (8–15). The home environment is a setting in which these behaviors frequently occur.
The family is recognized as the primary source of influence on the development of children’s eating and PA behaviors (16), and parents play a major role in structuring the home environment around these behaviors (17). Parents influence children’s dietary and PA behaviors by providing food, modeling eating and PA behaviors, and transmitting attitudes and values about these behaviors. Parents influence children’s PA behaviors by limiting time spent in sedentary activities, such as TV viewing, modeling healthy exercise habits, reinforcing their child for choosing physically active leisure time activities, and promoting and supporting their child’s PA by encouraging active play, enrolling their child and providing transportation to extra-curricular sports teams, lessons, or classes.
Little research for obesity prevention has been conducted with families in the home environment, despite their well-documented influence on energy balance behaviors (18,19). We are aware of no previous obesity prevention research that has intervened on all family members in the home environment. The present study evaluated the effects of a family-based intervention to prevent excess weight gain among a community-based sample of households (HH). The intervention targeted the known behavioral and HH environmental variables associated with obesity, including TV viewing, low PA, and consumption of fast foods, prepackaged snacks, sweets and sugar-sweetened beverages (8–15,20). The study was unique in targeting entire HHs for prevention activities, and focusing on both the home environment and individual behavior changes (21). It was hypothesized that compared to HHs in the control group, intervention HHs would gain less weight and increase healthful behaviors related to energy balance over the 1 year study period.
METHODS AND PROCEDURES
Study overview and design
The goal of the Take Action study was to evaluate an intervention to prevent weight gain over one-year among families in community HHs. The intervention included both HH environment and individual-level behavioral components (21). The HH environment intervention included: (i) placement of TV time-limiting devices on all HH TV sets; (ii) provision of guidelines about HH food availability; and (iii) provision of a home scale for daily self-weighing (adults only). The individual behavioral intervention component promoted specific individual behavior changes related to weight control that were consistent with the HH-level intervention. The intervention was delivered using face-to-face group meetings, telephone calls, and monthly newsletters. Control HHs received no intervention. The HH and individual behavioral goals are listed in Table 1.
Table 1.
Take Action intervention behavioral goals
| Household-level |
| 1. Reduce total household television viewing time by half. |
| 2. Encourage each other to do 30 min of activity daily. Do some together. |
| 3. Limit availability of high calorie snack foods to one regular sized package per household member. |
| 4. Replace half of high calorie prepackaged meals with lower calorie versions. |
| 5. Limit the HH availability of sweetened drinks to ≤12 ounces per person. |
| 6. Make at least two fruits and three vegetables available and visible in your home for each person. |
| 7. Serve smaller food portions. |
| 8. Limit trips to fast food restaurants to ≤2 times per week. |
| 9. Make healthy choices when eating out. |
| Individual-level |
| 1. Limit televsion viewing. |
| 2. Be physically active for a total of 30 min or more each day. |
| 3. Limit consumption of high calorie snack foods (such as chips, cookies, or cake) to ≤1 per day. |
| 4. Replace half of your high calorie prepackaged meals with lower calorie versions. |
| 5. Limit sweetened drinks to ≤12 ounces per day. |
| 6. Eat at least five servings of fruits and vegetables each day. |
| 7. Eat smaller portions (“eat less”). |
| 8. Limit eating fast foods to ≤2 per week. |
| 9. Make healthy choices when eating out. |
| 10. Adults: weigh yourselves daily. |
Study population and recruitment
HHs were recruited from the community over an 8-month period. Recruitment sources included community libraries, worksites, schools, daycare centers, health clinics, religious institutions, park and recreation centers, grocery stores, and food co-ops. Overall, 732 inquiries were received, 289 families were eligible, and 90 HHs enrolled in the study (see Figure 1). The main reasons for ineligibility were living too far from the university, HH TV viewing hours below the enrollment criteria, and HH configuration that did not meet enrollment criteria.
Figure 1.
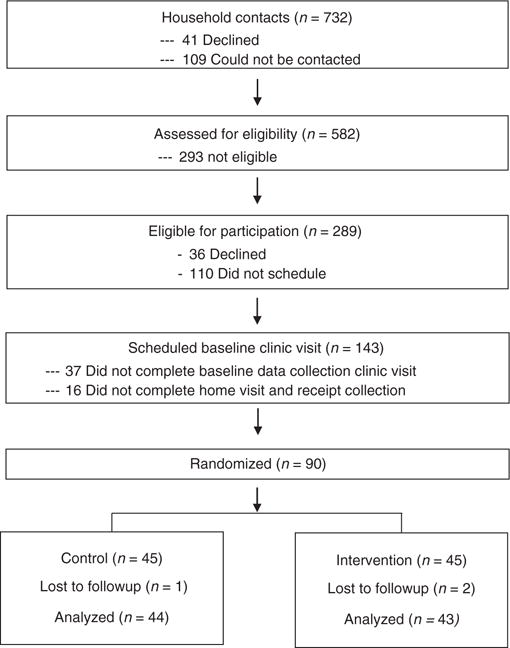
Take Action household enrollment and follow-up flow diagram.
Eligibility criteria included: (i) at least one child ages ≥5 years and two HH members ages ≥12 years; (ii) residence in a private house or apartment within 20 miles of the university; (iii) HH TV viewing weekly average of ≥10 h per person; (iv) no HH members with dietary, medical, psychological, or physical limitations that would prevent their participation in intervention activities; and (v) willingness to be randomized to active intervention or control group. Eligibility was assessed during an initial telephone call conducted by a trained staff member and confirmed during an in-person baseline clinic visit. The University of Minnesota institutional review board approved the study.
Baseline measurement and randomization
HHs completed a face-to-face clinic visit conducted by trained research staff. Following the clinic visit, a home visit was scheduled. During the home visit, the research staff person completed a home food inventory and trained the primary HH shopper on the receipt collection and annotation protocol. Home visits required between 45 min and 2 h, depending on the amount of food present in the HH.
The HH primary shopper completed 4 weeks of receipt collection and annotation. Annotated receipts were mailed weekly to research staff. HHs were randomized following the completion of the 4th week of receipt annotation. One hundred six HHs completed the initial baseline clinic visit. Of these, 90 HHs completed 4 weeks of receipt collection and were randomized. Thus, the drop out rate from clinic visit to randomization was 15% (90/106 = 85%). The 90 participating HHs were comprised of 158 adults, 75 adolescents ages 12–17 years, 84 children ages 5–11 years, and 23 children <5 years.
HHs randomized to the intervention group were contacted and scheduled for their first intervention group session. HHs randomized to the control group were informed of their group assignment.
Intervention program
The intervention program was 1 year in duration and included 6 monthly face-to-face group sessions, monthly newsletters, and 12 home-based activities.
Group sessions
Group sessions were held at the University of Minnesota monthly for the first 6 months of the intervention. Two trained research intervention staff led each session. Three to five HHs attended each session and remained as a group for the six sessions. All HH members age ≥12 years were encouraged to attend and participate. Sessions were 2 h in length, held on a weekday evening, included behavioral education, interactive activities, 20–30 min of PA, and a healthy snack. HHs received a $25 gift card for a local grocery store chain for each session attended.
Behavioral strategies
Behavioral strategies, including goal setting, self-monitoring, and positive reinforcement, were used to promote and support behavior changes at the HH and individual level. HHs were encouraged to set goals for each of the target behavior areas. In addition to HH-level goals, each individual member was encouraged to set his or her personal behavioral goals for each of the target behaviors. HH-level goals were defined, tracked, and posted at home on a goal sheet. Individual behavioral goals and behaviors were tracked using an individual behavioral self-monitoring booklet.
Home activities
Home activities were designed to reinforce behavioral messages addressed at the previous group session, and to encourage parents to discuss the behaviors with any HH members not present at the group intervention session. Home activity instructions and materials were included with each monthly newsletter and were completed over the course of 2–3 weeks by the HH as a group. Incentives were provided for each home activity completed and included items such as gift cards for local discount stores, sports balls, and hand-weight sets.
Home scale
Each intervention HH was given a digital scale at the first group session. Adults were instructed to self-weigh daily to monitor their body weight. Adults were explicitly instructed not to weigh their children or adolescents because weight gain is normal and expected during childhood and adolescence.
TV limiting device
At the beginning of the study, a TV limiting device was attached to every TV in the HH. The purpose of the device was to assist HHs with meeting TV viewing reduction goals. The TV limiting device provided an objective method to limit TV viewing by all HH members during the intervention period. Research staff visited each HH following the first group session to attach the devices to the HH TVs. Devices were programmed to allow only the number of hours of TV viewing that HHs selected as the weekly HH viewing limit. After the limit was reached, the TV limiting device disabled the TV until the start of the next week. Goals recommended by study staff were 50% reduction from the HH baseline TV viewing hours per week. One or more individual pin codes could be programmed into the device. The devices remained on the HH TVs for the 12-month study duration unless HH requested otherwise.
Telephone support calls
Intervention staff telephoned each intervention HH monthly between sessions. Email also was used to maintain regular contact with intervention HHs. The purpose of these contacts was to provide support for the behavior changes being made by HHs. Intervention staff queried the adult HH contact person about progress and problems, assisted with problem solving when needed, and reinforced progress on HH behavior changes.
Measures
Measures were collected in-person at clinic visits at baseline and 12 months by trained research staff (22). Each HH member ages ≥5 years was weighed and measured for height. HH members ages ≥12 years completed a behavioral survey about their dietary, PA and TV viewing behaviors. Research staff conducted home visits at baseline and 12 month follow-up to complete home food inventories. HH primary shoppers completed 4 weeks of annotated receipt collection at baseline and follow-up.
Weight and height
Body weight was measured in street clothing without shoes using a calibrated electronic scale. Height was measured using a wall-mounted stadiometer. Two separate measurements were conducted for both the weight and the height measures. The average of the two values were used in statistical analyses. BMI was calculated as weight (kg)/height (m2).
Dietary intake and eating behaviors
Food choices were measured using a modified food frequency questionnaire (23,24). Participants reported the frequency of consumption during the past month of the following foods and beverages targeted by the intervention: sweets and snacks (nine items); sugar-sweetened beverages (two items); fruits and vegetables (four items). Frequency of consumption was multiplied by average serving size to estimate average number of servings per day.
Physical activity
PA was measured among adults with a modified long form International Physical Activity Questionnaire (IPAQ) (25,26). The modification was the use of shorter, simplified instructions. Minutes were summed across settings to provide a total minutes score for walking, moderate, and vigorous activity. The 3 day PA Recall was used to measure PA among the children aged ≥12 years (27–29). The 3 day PA Recall queries children about their main PA during each 30 min time block between 6 am and midnight during the past 3 days. Scores are computed based on the number of blocks of time in which physical activities of different intensities are engaged. The IPAQ and the 3 Day PA Recall have high test-retest reliability and validity (25–29).
TV viewing
TV viewing and computer use hours per day were self-reported using a standard set of questions (30).
Home food availability
Research staff completed a home food inventory during the baseline and follow-up home visit (31). Home food inventories captured foods and beverages from targeted intervention categories: prepackaged snacks, sweets, fruits, vegetables, 100% juice, sugar-sweetened beverages, no- and low-calorie beverages, and prepackaged entrees. Total ounces were computed for each food and beverage category.
HH food purchases
HH food purchases were measured using annotated food purchase receipts (32). Receipts from all food sources were collected and annotated by the HH primary shopper, including fast food and table-service restaurants, convenience stores, coffee shops, supercenters, grocery stores, and supermarkets. Using a standard protocol, trained research staff coded the annotated receipt information into categories targeted by the intervention (32). Total dollars were computed for each food and beverage category.
Statistical analysis
Statistical analyses were conducted using SAS (SAS/STAT Release 8.2, SAS Institute, Cary, NC). The unit of randomization, intervention and evaluation was the HH (33). The study is a cluster-randomized trial in which HHs are randomized to intervention or control condition. In such a situation, it is imperative that HH be included in the statistical model as a random effect nested within randomization condition (33). Data are presented individually to the calculation of the maximum likelihood (proc MIXED, SAS) but are modeled as correlated within HH. The analysis essentially estimates a HH mean outcome, adjusted for individual characteristics, and analyzes these means further adjusted for HH level characteristics. However, it does this in a single step (which is iterative).
BMI z-score is the most widely accepted measure of BMI change in obesity prevention interventions with children (34). To examine change in BMI at the HH level, first a BMI z-score was assigned to each HH member (ages ≥5 years). For participants ages ≥20 years, BMI z-score was calculated using sex and 5-year age group values from the NHANES-I (35). The Box–Cox method was used to estimate the shape and spread parameters to transform the percentiles to Gaussian distribution (36). These parameters were then applied to individual adult BMI to convert to a normal BMI z-score.
The creation of BMI z-scores addresses the issue of a common metric for all HH members of different ages, genders, and heights. Note that, while HH composition varies widely, stratified analyses (adults, adolescents) reduce the variability. As height does not change in adults in the age range of this study, it would be possible to analyze change in weight directly, but this could not be done in growing adolescents. Further, weight is skew, and direct analysis of weight has some statistical problems, whereas BMI z-scores are approximately Gaussian distributed, making for an uncomplicated analysis. Rather than having two measures for the outcome (BMI-z for adolescents; weight for adults), we have opted for a common outcome measure for adults and for adolescents.
The primary outcome was change in HH mean BMI z-score. Secondary outcomes included changes in food choices, PA, self-weighing (adults only), and TV viewing behaviors. These analyzes were adjusted for individual gender, smoking status and age, and HH configuration, income, education, and race of main HH adult contact person. Intervention effects are reported from baseline-adjusted models. HH identification number was included as a random effect in all models. In addition to the HH-level analysis, parallel analyzes were conducted separately among adolescents and adults to examine potential age-group-related differences in response to the intervention.
RESULTS
HH descriptive characteristics
Ninety-three percent of the HH main respondents were female with an average age of 41 years and an average BMI of 29.6 kg/m2. Seventy-nine percent were white, and 62% married or cohabitating. HHs on average were comprised of four people (1.7 adults (range 1–3) and 2.0 children (range 1–5)). The most common HH configuration was two adults and two or more children (52%), followed by one adult and two or more children (19%), two adults and one child (18%), and one adult and one child (12%). Reported HH annual income was distributed as follows: 34% ≤$45,000 per year; 29% between $50,000 and $95,000; and 37% ≥$100,000 per year. Sixty-three percent of HH had a member with a college or advanced degree. During the previous week, HHs reported eating a meal together an average of six times and eating from a fast food restaurant an average of 1.2 times. HH members reported TV viewing an average of 2.7 hours per day. Seventy-one percent of HH’s reported the presence of a working home scale in the HH at baseline.
Cohort retention and follow-up
At 12 months, 86 of 90 HHs completed the follow-up clinic and home data collection visit (96% retention). Seventy-seven HHs also completed the 4-week annotated receipt data collection (77/90 = 86%).
Intervention participation
Over 73% of the 45 intervention HHs attended at least four of six face-to-face group sessions and completed half or more of the home activities. About 20% of HHs had perfect attendance and home activity completion rates. Within-HH attendance, or the average percent of eligible HH members who attended each session, was 59%. Two-thirds (68%) of HHs had 50% or more HH members attending sessions, and one-third of HHs had 75% or more HH members attending sessions. TV-limiting devices were placed in 93% of intervention HHs. The average duration the devices were kept attached to the TVs was 10.6 months. Monitors were programmed to a weekly mean of 29.8 h (range 11–70), a 44% reduction from baseline (52.8 h weekly). Twenty-eight of 42 HHs kept the TV monitors on the TV after the end of the study. Session evaluations were administered during the last face-to-face group session. Eighty-three percent of the intervention participants rated overall sessions as satisfactory or very satisfactory (on a five-point scale).
Change in BMI Z-score
Change in HH BMI z score is shown in Table 2. No significant HH differences were observed by treatment group for change in BMI z score, or (adults only) change in BMI.
Table 2.
Intervention effects for BMI, eating and physical activity behaviors, and television viewing among 90 community households
| BL
|
FU
|
Intervention effect
|
|||||
|---|---|---|---|---|---|---|---|
| Intervention | Control | Intervention | Control | Estimate | SE | P | |
| BMI z score (standard deviations) | 0.55 | 0.77 | 0.52 | 0.76 | −0.0038 | 0.05 | 0.93 |
| Adolescent | 0.71 | 0.76 | 0.69 | 0.67 | 0.0638 | 0.10 | 0.53 |
| Adult | 0.71 | 0.77 | 0.68 | 0.84 | −0.0446 | 0.04 | 0.30 |
| BMI (kg/m2) (adults only) | 28.81 | 29.64 | 28.78 | 29.88 | −0.1801 | 0.25 | 0.48 |
| Eating behaviors (times/week) | |||||||
| Fast food | 1.20 | 1.38 | 0.92 | 1.10 | −0.0757 | 0.16 | 0.64 |
| Adolescent | 1.32 | 1.35 | 1.42 | 1.04 | 0.3847 | 0.35 | 0.27 |
| Adult | 1.07 | 1.42 | 0.74 | 1.04 | −0.1685 | 0.17 | 0.34 |
| Family meals | 5.80 | 6.54 | 5.43 | 5.01 | 0.7137 | 0.52 | 0.17 |
| Adolescent | 4.78 | 5.55 | 4.55 | 3.24 | 1.4476 | 0.88 | 0.11 |
| Adult | 5.87 | 6.70 | 5.55 | 5.59 | 0.4550 | 0.51 | 0.37 |
| Dietary intake (portions/day) | |||||||
| Fruit & vegetable | 2.05 | 2.01 | 2.13 | 1.92 | 0.1952 | 0.13 | 0.16 |
| Adolescent | 1.85 | 1.78 | 2.05 | 1.50 | 0.4658 | 0.23 | 0.05 |
| Adult | 2.15 | 2.12 | 2.20 | 2.08 | 0.1153 | 0.16 | 0.48 |
| Snack/sweet | 1.57 | 1.39 | 1.07 | 1.30 | −0.2587 | 0.11 | 0.02 |
| Adolescent | 1.60 | 1.42 | 1.49 | 1.29 | 0.1879 | 0.26 | 0.48 |
| Adult | 1.53 | 1.39 | 0.89 | 1.26 | −0.3831 | 0.12 | 0.002 |
| Sugar beverages | 0.42 | 0.47 | 0.30 | 0.42 | −0.0964 | 0.05 | 0.10 |
| Adolescent | 0.46 | 0.60 | 0.53 | 0.64 | −0.0071 | 0.16 | 0.96 |
| Adult | 0.40 | 0.41 | 0.20 | 0.31 | −0.1145 | 0.05 | 0.03 |
| Physical activity (min/day) | |||||||
| Walking (adults) | 93.74 | 80.99 | 103.97 | 76.98 | 22.4921 | 11.11 | 0.04 |
| MVPA (adult) | 132.88 | 104.85 | 145.52 | 103.57 | 29.6331 | 12.77 | 0.02 |
| MVPA (adolescent) | 118.35 | 140.16 | 123.56 | 102.07 | 24.375 | 28.38 | 0.39 |
| PA with HH (days/week) | 1.65 | 2.23 | 1.65 | 1.38 | 0.4417 | 0.20 | 0.03 |
| Adolescent | 1.18 | 2.83 | 1.12 | 1.23 | 0.1412 | 0.43 | 0.75 |
| Adult | 1.85 | 1.98 | 1.82 | 1.49 | 0.3729 | 0.23 | 0.11 |
| PA encourage (days/week) | 2.40 | 3.11 | 3.33 | 2.64 | 0.9927 | 0.28 | 0.001 |
| Adolescent | 1.49 | 2.37 | 1.99 | 1.73 | 0.5910 | 0.57 | 0.31 |
| Adult | 2.83 | 3.45 | 3.94 | 2.99 | 1.2152 | 0.35 | 0.001 |
| TV viewing in home | |||||||
| TV viewing (hours/day) | 2.82 | 2.67 | 1.70 | 2.04 | −0.3745 | 0.17 | 0.03 |
| Adolescent | 2.89 | 2.71 | 2.08 | 1.93 | 0.1105 | 0.40 | 0.79 |
| Adult | 2.79 | 2.64 | 1.51 | 2.01 | −0.5461 | 0.20 | 0.01 |
| TV is on (1 = most of the time; 5 = none) | 3.36 | 3.85 | 4.63 | 3.94 | 0.8833 | 0.17 | <0.0001 |
| Adolescent | 3.16 | 3.67 | 4.46 | 3.68 | 0.9798 | 0.33 | 0.005 |
| Adult | 3.39 | 3.91 | 4.74 | 4.05 | 0.9084 | 0.19 | <0.0001 |
| TV is usually on during meals (% yes) | 52.30 | 44.38 | 30.45 | 42.26 | −15.5 | 6.92 | 0.02 |
| Adolescent | 59.76 | 45.16 | 36.84 | 46.04 | −14.45 | 11.79 | 0.23 |
| Adult | 52.09 | 43.72 | 29.21 | 42.77 | −18.04 | 7.61 | 0.02 |
| Self-weighing (adults) at least weekly (%) | 52.64 | 47.36 | 70.65 | 36.24 | 32.46 | 7.38 | <0.0001 |
| Receipt food purchases ($/person/week) | |||||||
| Total | 26.31 | 25.97 | 19.60 | 23.63 | −4.2581 | 2.53 | 0.09 |
| Eating out | 11.91 | 13.93 | 7.31 | 12.36 | −3.9078 | 1.75 | 0.02 |
| Fruits & vegs | 5.31 | 4.70 | 4.46 | 4.91 | −0.6916 | 1.27 | 0.59 |
| Sugar beverages | 1.32 | 1.44 | 0.77 | 1.03 | −0.1949 | 0.22 | 0.39 |
| Snacks/sweets | 5.32 | 4.60 | 4.41 | 3.99 | −0.3023 | 0.62 | 0.62 |
| Home food inventory (oz/person) | |||||||
| Fruits & vegs | 220.88 | 205.01 | 210.90 | 220.59 | −21.8702 | 23.28 | 0.35 |
| Sugar beverages | 57.18 | 79.27 | 38.95 | 60.68 | −13.0497 | 13.90 | 0.35 |
| Snacks/sweets | 147.39 | 152.29 | 140.63 | 142.75 | −1.8670 | 19.23 | 0.92 |
BL, baseline; FU, follow-up; HH, household; MVPA, moderate/vigorous physical activity; PA, physical activity; TV, television.
Means are adjusted for individual gender, smoking status, age, and HH configuration, income, education, and race of main HH adult contact person. Intervention effects are reported from baseline-adjusted models.
Change in food choices, physical activity, and TV viewing
Change in food choices, TV viewing and PA are shown in Table 2. Compared to control HHs, intervention HHs made no significant changes in the frequency of self-reported meals eaten at fast food restaurants, or intake of fruits and vegetables or sugar-sweetened beverages. Significant reductions were reported in frequency of consumption of sweets and snack foods. Results from analyses stratified by age group showed significant intervention-related increases among adolescents in fruit and vegetable intake, and significant intervention-related decreases among adults in snacks, sweets, and sugar-sweetened beverage intake.
Food purchase receipt data showed a significant intervention-related decrease in the HH per-person dollars spent on eating out. No significant changes were observed in the dollars spent per person or ounces present in the home for fruits, vegetables, sugar-sweetened beverages, snacks, and sweets.
TV viewing hours significantly decreased among intervention HHs compared to control HHs (about −0.4 h per day; P < 0.04). Significant reductions in reported TV on during meals and in “TV on most of the time” were reported among intervention HHs (and in both age groups) compared to control HH.
Adults in intervention HHs reported significant increases in minutes per day walking and in moderate/vigorous PA. No significant intervention related changes in PA were observed in adolescents. Significant increases were observed among intervention HHs in encouragement for PA by other HH members and in frequency of PA with other HH members compared with control HHs.
Adults in intervention HHs reported significant increases in the frequency of self-weighing compared with adults in control HHs. At follow-up, 71% of adults in intervention HHs weighed weekly or more frequently, compared to 36% of adults in control HHs (P < 0.0001).
DISCUSSION
Although its importance in obesity prevention is widely recognized, no previous obesity prevention interventions have intervened on the entire family in the home environment. The present study was unique and innovative because its intervention targeted all family members and the home environmental influences on body weight and weight-related behaviors. The study included both environmental and individual-level behavioral intervention strategies, thus recognizing the importance of multiple levels of influence for intervention effectiveness (21).
One particularly unique intervention component was the use of the TV viewing locking devices. A large majority of intervention HHs kept these devices attached to their TVs for the entire 12 month study period. This is a significant duration and we are aware of no previous study that has included a TV locking device component for this length of time. The significant reduction in TV viewing hours among HHs shows that this strong environmental intervention was effective to help HHs implement desired TV viewing reduction behavior changes for a significant length of time. This result points to the importance of using strong environmental interventions that are implemented for a lengthy duration.
The inclusion of the food purchase receipts and home food inventories was a unique study component, and provided direct information about the home food environment and intervention-related changes in HH food purchasing. The receipt measure revealed that intervention HHs significantly decreased their spending on eating out food sources compared to the control group.
It was hoped that the results of the present study would provide important information about the effectiveness of a broad-reaching weight-gain prevention program that is appropriate for HHs in community settings. Its focus on the home food, TV, and PA environment and on engaging the entire HH membership was unique. The results suggest that HHs will actively participate in such a program for an extended time period, including maintaining TV viewing monitors on HH TVs. The lack of significant results on body weight was disappointing, but perhaps not surprising, for several reasons. First, the intervention was designed with prevention of weight gain as its aim. Therefore, recommended changes in eating and PA behaviors were modest. Small changes that are sustained for lengthy time periods do have the potential for long-term impact. However, the 12 month intervention period may have been too short in duration to observe significant prevention effects on body weight. A second challenge was the effort to target all HH members for behavior changes, some of whom were less enthusiastic than others about reducing TV viewing and changing eating habits. Related to the issue of motivation, HHs were not recruited for a weight loss study and so were not motivated by an interest in weight change. A third challenge was the number of behaviors targeted for change and the complexity of changing even one of these behaviors. PA, food choices, and TV viewing are influenced by multiple physical and social environmental factors and are thus difficult to change. Despite these challenges, the intervention was successful in changing several behaviors related to energy balance. Among adults, PA and self-weighing increased, and snacks and sweets and sugar-sweetened beverage intake decreased. Among all HH members, TV viewing decreased. Reported family support for PA and decreases in the frequency of TV being on at home were significant intervention-related positive changes in the home environment. These changes are meaningful in their potential impact on body weight if sustained over time.
Limitations of the study include its lack of a strong home food environment intervention. The TV viewing component consisted of a strong environmental intervention because it physically limited the time that the HH TVs could operate. The self-weighing intervention was also strengthened by the provision of digital scales for daily self-weighing at home among the adults. By contrast, the food and eating behavior targets included several behaviors that were more complex to implement. Other community interventions that have tried to change the home food environment have focused on a single behavior, such as reducing the home availability of sugar-sweetened beverages (37). Direct provision of noncaloric beverages was successful in significantly reducing intake of sugar sweetened beverages among adolescents, and among overweight adolescents, significantly reduced BMI (37). Further research could explore stronger home food environmental interventions such as home provision of noncaloric beverages and fruits and vegetables. Home visits could also be used to physically add or remove specific types of foods from the home environment to facilitate home food environmental changes. Greater structured intervention around the development of specific grocery shopping lists, shopping purchases, and preparing meals at home are strategies that strengthen the HHs ability to make more healthful food choices. Other limitations were the self-selected sample, which limits the generalizability of these results. Seventy percent of the sample consisted of two-parent HHs, and about 60% had a college degree or more education. The use of PA and dietary measures that have higher levels of validity would have provided a greater ability to detect any intervention-related eating behavior changes. The use of the IPAQ to measure PA resulted in over-reporting, which is now recognized as a problem with the IPAQ (38).
This was the first study to show that a family-based HH intervention can promote HHs to reduce TV viewing, increase PA and decrease intake of snacks, sweets and sugar-sweetened beverages over a 1 year time period. Stronger home food environment intervention components and longer intervention durations are needed to prevent excess weight gain among families in the community.
Acknowledgments
This study was supported by grant #1U54CA116849 and #R21CA137240 from the National Institutes of Health/National Cancer Institute.
Footnotes
DISCLOSURE
The authors declared no conflict of interest.
References
- 1.Flegal KM, Carroll MD, Ogden CL, Johnson CL. Prevalence and trends in obesity among US adults, 1999–2000. JAMA. 2002;288:1723–1727. doi: 10.1001/jama.288.14.1723. [DOI] [PubMed] [Google Scholar]
- 2.Ogden CL, Carroll MD, Curtin LR, Lamb MM, Flegal KM. Prevalence of high body mass index in US children and adolescents, 2007–2008. JAMA. 2010;303:242–249. doi: 10.1001/jama.2009.2012. [DOI] [PubMed] [Google Scholar]
- 3.Institute of Medicine, Committee on the Prevention of Obesity in Children and Youth. Preventing childhood obesity: Health in the balance. Washington DC: Institute of Medicine, National Academies of Science; 2005. [Google Scholar]
- 4.The White House. Presidential Memorandum: Establishing a Task Force on Childhood Obesity. 2010 Feb 9; < http://www.whitehouse.gov/the-press-office/presidential-memorandum-establishing-a-task-force-childhood-obesity>. To be published in the Federal Register.
- 5.Epstein LH, Valoski A, Wing RR, McCurley J. Ten-year outcomes of behavioral family-based treatment for childhood obesity. Health Psychol. 1994;13:373–383. doi: 10.1037//0278-6133.13.5.373. [DOI] [PubMed] [Google Scholar]
- 6.Golan M, Crow S. Targeting parents exclusively in the treatment of childhood obesity: long-term results. Obes Res. 2004;12:357–361. doi: 10.1038/oby.2004.45. [DOI] [PubMed] [Google Scholar]
- 7.Kitzmann KM, Dalton WT, Buscemi J. Beyond parenting practices: Family context and the treatment of pediatric obesity. Fam Rel. 2008;57:13–23. [Google Scholar]
- 8.Robinson TN, Hammer LD, Killen JD, et al. Does television viewing increase obesity and reduce physical activity? Cross-sectional and longitudinal analyses among adolescent girls. Pediatrics. 1993;91:273–280. [PubMed] [Google Scholar]
- 9.Andersen RE, Crespo CJ, Bartlett SJ, Cheskin LJ, Pratt M. Relationship of physical activity and television watching with body weight and level of fatness among children: results from the Third National Health and Nutrition Examination Survey. JAMA. 1998;279:938–942. doi: 10.1001/jama.279.12.938. [DOI] [PubMed] [Google Scholar]
- 10.Nielsen SJ, Popkin BM. Patterns and trends in food portion sizes, 1977–1998. JAMA. 2003;289:450–453. doi: 10.1001/jama.289.4.450. [DOI] [PubMed] [Google Scholar]
- 11.Smiciklas-Wright H, Mitchell DC, Mickle SJ, Goldman JD, Cook A. Foods commonly eaten in the United States, 1989–1991 and 1994–1996: are portion sizes changing? J Am Diet Assoc. 2003;103:41–47. doi: 10.1053/jada.2003.50000. [DOI] [PubMed] [Google Scholar]
- 12.Lin B-H, Guthrie JF, Blaylock J. The diets of America’s children: Influences of dining out, household characteristics, and nutrition knowledge. Washington, DC: 1996. (US Dept of Agriculture, Economic Report No. 746(AER-746)). [Google Scholar]
- 13.Lin B-H, Guthrie JF, Frazao E. Nutrient contribution of food away from home. In: Frazao E, editor. America’s Eating Habits: Changes and consequences. USDA/Economic Research Service; Washington, DC: 1999. pp. 213–242. [Google Scholar]
- 14.Harnack L, Stang J, Story M. Soft drink consumption among US children and adolescents: nutritional consequences. J Am Diet Assoc. 1999;99:436–441. doi: 10.1016/S0002-8223(99)00106-6. [DOI] [PubMed] [Google Scholar]
- 15.Ludwig DS, Peterson KE, Gortmaker SL. Relation between consumption of sugar-sweetened drinks and childhood obesity: a prospective, observational analysis. Lancet. 2001;357:505–508. doi: 10.1016/S0140-6736(00)04041-1. [DOI] [PubMed] [Google Scholar]
- 16.Birch LL, Fisher JO. Mothers’ child-feeding practices influence daughters’ eating and weight. Am J Clin Nutr. 2000;71:1054–1061. doi: 10.1093/ajcn/71.5.1054. [DOI] [PMC free article] [PubMed] [Google Scholar]
- 17.Rhee K. Childhood overweight and the relationship between parent behaviors, parenting style and family functioning. Ann Am Acad Pol Soc Sci. 2008;615:11–37. [Google Scholar]
- 18.Fitzgibbon ML, Stolley MR, Schiffer L, et al. Hip-Hop to Health Jr. for Latino preschool children. Obesity (Silver Spring) 2006;14:1616–1625. doi: 10.1038/oby.2006.186. [DOI] [PubMed] [Google Scholar]
- 19.Fitzgibbon ML, Stolley MR, Schiffer L, et al. Two-year follow-up results for Hip-Hop to Health Jr.: a randomized controlled trial for overweight prevention in preschool minority children. J Pediatr. 2005;146:618–625. doi: 10.1016/j.jpeds.2004.12.019. [DOI] [PubMed] [Google Scholar]
- 20.Van Wormer JJ, French SA, Pereira MA, Welch EM. The impact of regular self-weighing on weight management: A systematic literature review. Int J Behav Nutr Phys Act. 2008;5:54. doi: 10.1186/1479-5868-5-54. [DOI] [PMC free article] [PubMed] [Google Scholar]
- 21.Stokols D. Establishing and maintaining healthy environments. Toward a social ecology of health promotion. Am Psychol. 1992;47:6–22. doi: 10.1037//0003-066x.47.1.6. [DOI] [PubMed] [Google Scholar]
- 22.Kuczmarski RJ, Ogden CL, Guo SS, et al. 2000 CDC Growth Charts for the United States: methods and development. Vital Health Stat. 2002;11:1–190. [PubMed] [Google Scholar]
- 23.Thompson F, Kipnis V, Subar A, et al. Performance of a short instrument to estimate usual dietary intake of percent calories from fat. Third International Conference on Dietary Assessment Methods; Arnhem, Netherlands. 1998. [Google Scholar]
- 24.Thompson FE, Subar AF, Smith AF, et al. Fruit and vegetable assessment: performance of 2 new short instruments and a food frequency questionnaire. J Am Diet Assoc. 2002;102:1764–1772. doi: 10.1016/s0002-8223(02)90379-2. [DOI] [PubMed] [Google Scholar]
- 25.Craig CL, Marshall AL, Sjöström M, et al. International physical activity questionnaire: 12-country reliability and validity. Med Sci Sports Exerc. 2003;35:1381–1395. doi: 10.1249/01.MSS.0000078924.61453.FB. [DOI] [PubMed] [Google Scholar]
- 26.Hagströmer M, Oja P, Sjöström M. The International Physical Activity Questionnaire (IPAQ): a study of concurrent and construct validity. Public Health Nutr. 2006;9:755–762. doi: 10.1079/phn2005898. [DOI] [PubMed] [Google Scholar]
- 27.Pate RR, Ross R, Dowda M, Trost SG, Sirard JR. Validation of a 3-day physical activity recall instrument in female youth. Pediatr Exerc Sci. 2003;15:257–265. [Google Scholar]
- 28.McMurray RG, Ring KB, Treuth MS, et al. Comparison of two approaches to structured physical activity surveys for adolescents. Med Sci Sports Exerc. 2004;36:2135–2143. doi: 10.1249/01.mss.0000147628.78551.3b. [DOI] [PMC free article] [PubMed] [Google Scholar]
- 29.Weston AT, Petosa R, Pate RR. Validation of an instrument for measurement of physical activity in youth. Med Sci Sports Exerc. 1997;29:138–143. doi: 10.1097/00005768-199701000-00020. [DOI] [PubMed] [Google Scholar]
- 30.Roberts DF, Foehr UG, Rideout VJ, Brodie M. Kids and media at the new millennium: A comprehensive national analysis of children’s media use. Henry J. Kaiser Family Foundation; 1999. [Google Scholar]
- 31.French SA, Shimotsu ST, Wall M, Gerlach AF. Capturing the spectrum of household food and beverage purchasing behavior: a review. J Am Diet Assoc. 2008;108:2051–2058. doi: 10.1016/j.jada.2008.09.001. [DOI] [PubMed] [Google Scholar]
- 32.French SA, Wall M, Mitchell NR, Shimotsu ST, Welsh E. Annotated receipts capture household food purchases from a broad range of sources. Int J Behav Nutr Phys Act. 2009;6:37. doi: 10.1186/1479-5868-6-37. [DOI] [PMC free article] [PubMed] [Google Scholar]
- 33.Murray DM. Group Randomized Trials Design and analysis of group-randomized trials. Oxford University Press; 1998. [Google Scholar]
- 34.Krebs NF, Himes JH, Jacobson D, et al. Assessment of child and adolescent overweight and obesity. Pediatrics. 2007;120(Suppl 4):S193–S228. doi: 10.1542/peds.2007-2329D. [DOI] [PubMed] [Google Scholar]
- 35.Must A, Dallal GE, Dietz WH. Reference data for obesity: 85th and 95th percentiles of body mass index (wt/ht2) and triceps skinfold thickness. Am J Clin Nutr. 1991;53:839–846. doi: 10.1093/ajcn/53.4.839. [DOI] [PubMed] [Google Scholar]
- 36.Box GEP, Cox DR. An Analysis of Transformations. J Royal Statistics Soc. 1964;B-26:211–252. [Google Scholar]
- 37.Ebbeling CB, Feldman HA, Osganian SK, et al. Effects of decreasing sugar-sweetened beverage consumption on body weight in adolescents: a randomized, controlled pilot study. Pediatrics. 2006;117:673–680. doi: 10.1542/peds.2005-0983. [DOI] [PubMed] [Google Scholar]
- 38.Johnson-Kozlow M, Sallis JF, Gilpin EA, Rock CL, Pierce JP. Comparative validation of the IPAQ and the 7-Day PAR among women diagnosed with breast cancer. Int J Behav Nutr Phys Act. 2006;3:7. doi: 10.1186/1479-5868-3-7. [DOI] [PMC free article] [PubMed] [Google Scholar]